Free Statistics

of Irreproducible Research!

Author's title

Author*Unverified author*
R Software Modulerwasp_autocorrelation.wasp
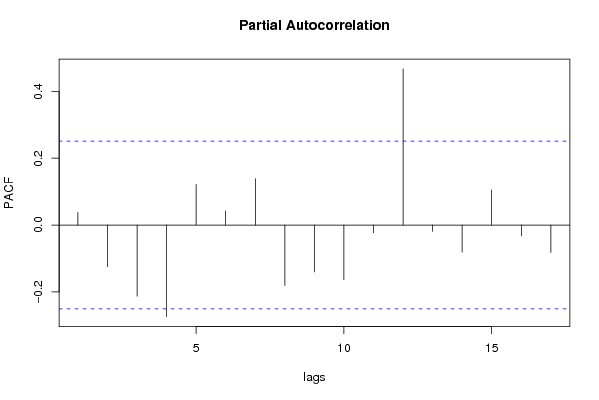
Title produced by software(Partial) Autocorrelation Function
Date of computationTue, 09 Dec 2008 07:06:56 -0700
Cite this page as followsStatistical Computations at FreeStatistics.org, Office for Research Development and Education, URL https://freestatistics.org/blog/index.php?v=date/2008/Dec/09/t122883167584fpkx595dw7o4r.htm/, Retrieved Sun, 19 May 2024 09:22:48 +0000
Statistical Computations at FreeStatistics.org, Office for Research Development and Education, URL https://freestatistics.org/blog/index.php?pk=31416, Retrieved Sun, 19 May 2024 09:22:48 +0000
QR Codes:

Original text written by user:
IsPrivate?No (this computation is public)
User-defined keywords
Estimated Impact180
Family? (F = Feedback message, R = changed R code, M = changed R Module, P = changed Parameters, D = changed Data)
F     [Univariate Data Series] [Airline data] [2007-10-18 09:58:47] [42daae401fd3def69a25014f2252b4c2]
F RMPD  [Variance Reduction Matrix] [] [2008-12-02 14:53:11] [3ba9e05a140f75dbe22af2042ab9e185]
F RMP       [(Partial) Autocorrelation Function] [] [2008-12-09 14:06:56] [84357e896eab491ec515599b43df427d] [Current]
Feedback Forum
2008-12-16 09:12:12 [Katja van Hek] [reply
De ACF grafiek laat een op en neergaand patroon zien dat enkel significant is bij lag 12. Je kunt er vanuit gaan dat bij meerdere observaties seizoenaliteit zichtbaar is. Als je volgens de VRM D gelijkstelt aan 1 zul je zien dat die seizoenaliteit verdwenen is en er geen significante waarden meer zijn.

Post a new message
Dataseries X:
45
24
18
20
22
39
55
35
38
47
1
57
50
33
19
2
7
15
56
53
24
48
2
49
46
32
37
10
8
16
55
46
46
45
6
45
52
44
35
15
44
51
58
23
44
43
6
51
53
47
19
18
38
43
23
43
18
43
6
31
49


Summary of computational transaction
Raw Inputview raw input (R code)
Raw Outputview raw output of R engine
Computing time3 seconds
R Server'Herman Ole Andreas Wold' @ 193.190.124.10:1001

\begin{tabular}{lllllllll}
\hline
Summary of computational transaction \tabularnewline
Raw Input & view raw input (R code)  \tabularnewline
Raw Output & view raw output of R engine  \tabularnewline
Computing time & 3 seconds \tabularnewline
R Server & 'Herman Ole Andreas Wold' @ 193.190.124.10:1001 \tabularnewline
\hline
\end{tabular}
%Source: https://freestatistics.org/blog/index.php?pk=31416&T=0

[TABLE]
[ROW][C]Summary of computational transaction[/C][/ROW]
[ROW][C]Raw Input[/C][C]view raw input (R code) [/C][/ROW]
[ROW][C]Raw Output[/C][C]view raw output of R engine [/C][/ROW]
[ROW][C]Computing time[/C][C]3 seconds[/C][/ROW]
[ROW][C]R Server[/C][C]'Herman Ole Andreas Wold' @ 193.190.124.10:1001[/C][/ROW]
[/TABLE]
Source: https://freestatistics.org/blog/index.php?pk=31416&T=0

Globally Unique Identifier (entire table): ba.freestatistics.org/blog/index.php?pk=31416&T=0

As an alternative you can also use a QR Code:  

The GUIDs for individual cells are displayed in the table below:

Summary of computational transaction
Raw Inputview raw input (R code)
Raw Outputview raw output of R engine
Computing time3 seconds
R Server'Herman Ole Andreas Wold' @ 193.190.124.10:1001


Autocorrelation Function
Time lag kACF(k)T-STATP-value
10.0378670.29580.384211
2-0.123003-0.96070.170252
3-0.219043-1.71080.046101
4-0.254627-1.98870.025613
50.1636181.27790.103063
60.1448681.13150.131146
70.1893031.47850.072209
8-0.16722-1.3060.098223
9-0.257042-2.00760.024563
10-0.167133-1.30540.098338
110.0238760.18650.426344
120.5799294.52941.4e-05
130.0662830.51770.303275
14-0.110755-0.8650.195207
15-0.11709-0.91450.182027
16-0.25903-2.02310.023726
170.0707710.55270.29123

\begin{tabular}{lllllllll}
\hline
Autocorrelation Function \tabularnewline
Time lag k & ACF(k) & T-STAT & P-value \tabularnewline
1 & 0.037867 & 0.2958 & 0.384211 \tabularnewline
2 & -0.123003 & -0.9607 & 0.170252 \tabularnewline
3 & -0.219043 & -1.7108 & 0.046101 \tabularnewline
4 & -0.254627 & -1.9887 & 0.025613 \tabularnewline
5 & 0.163618 & 1.2779 & 0.103063 \tabularnewline
6 & 0.144868 & 1.1315 & 0.131146 \tabularnewline
7 & 0.189303 & 1.4785 & 0.072209 \tabularnewline
8 & -0.16722 & -1.306 & 0.098223 \tabularnewline
9 & -0.257042 & -2.0076 & 0.024563 \tabularnewline
10 & -0.167133 & -1.3054 & 0.098338 \tabularnewline
11 & 0.023876 & 0.1865 & 0.426344 \tabularnewline
12 & 0.579929 & 4.5294 & 1.4e-05 \tabularnewline
13 & 0.066283 & 0.5177 & 0.303275 \tabularnewline
14 & -0.110755 & -0.865 & 0.195207 \tabularnewline
15 & -0.11709 & -0.9145 & 0.182027 \tabularnewline
16 & -0.25903 & -2.0231 & 0.023726 \tabularnewline
17 & 0.070771 & 0.5527 & 0.29123 \tabularnewline
\hline
\end{tabular}
%Source: https://freestatistics.org/blog/index.php?pk=31416&T=1

[TABLE]
[ROW][C]Autocorrelation Function[/C][/ROW]
[ROW][C]Time lag k[/C][C]ACF(k)[/C][C]T-STAT[/C][C]P-value[/C][/ROW]
[ROW][C]1[/C][C]0.037867[/C][C]0.2958[/C][C]0.384211[/C][/ROW]
[ROW][C]2[/C][C]-0.123003[/C][C]-0.9607[/C][C]0.170252[/C][/ROW]
[ROW][C]3[/C][C]-0.219043[/C][C]-1.7108[/C][C]0.046101[/C][/ROW]
[ROW][C]4[/C][C]-0.254627[/C][C]-1.9887[/C][C]0.025613[/C][/ROW]
[ROW][C]5[/C][C]0.163618[/C][C]1.2779[/C][C]0.103063[/C][/ROW]
[ROW][C]6[/C][C]0.144868[/C][C]1.1315[/C][C]0.131146[/C][/ROW]
[ROW][C]7[/C][C]0.189303[/C][C]1.4785[/C][C]0.072209[/C][/ROW]
[ROW][C]8[/C][C]-0.16722[/C][C]-1.306[/C][C]0.098223[/C][/ROW]
[ROW][C]9[/C][C]-0.257042[/C][C]-2.0076[/C][C]0.024563[/C][/ROW]
[ROW][C]10[/C][C]-0.167133[/C][C]-1.3054[/C][C]0.098338[/C][/ROW]
[ROW][C]11[/C][C]0.023876[/C][C]0.1865[/C][C]0.426344[/C][/ROW]
[ROW][C]12[/C][C]0.579929[/C][C]4.5294[/C][C]1.4e-05[/C][/ROW]
[ROW][C]13[/C][C]0.066283[/C][C]0.5177[/C][C]0.303275[/C][/ROW]
[ROW][C]14[/C][C]-0.110755[/C][C]-0.865[/C][C]0.195207[/C][/ROW]
[ROW][C]15[/C][C]-0.11709[/C][C]-0.9145[/C][C]0.182027[/C][/ROW]
[ROW][C]16[/C][C]-0.25903[/C][C]-2.0231[/C][C]0.023726[/C][/ROW]
[ROW][C]17[/C][C]0.070771[/C][C]0.5527[/C][C]0.29123[/C][/ROW]
[/TABLE]
Source: https://freestatistics.org/blog/index.php?pk=31416&T=1

Globally Unique Identifier (entire table): ba.freestatistics.org/blog/index.php?pk=31416&T=1

As an alternative you can also use a QR Code:  

The GUIDs for individual cells are displayed in the table below:

Autocorrelation Function
Time lag kACF(k)T-STATP-value
10.0378670.29580.384211
2-0.123003-0.96070.170252
3-0.219043-1.71080.046101
4-0.254627-1.98870.025613
50.1636181.27790.103063
60.1448681.13150.131146
70.1893031.47850.072209
8-0.16722-1.3060.098223
9-0.257042-2.00760.024563
10-0.167133-1.30540.098338
110.0238760.18650.426344
120.5799294.52941.4e-05
130.0662830.51770.303275
14-0.110755-0.8650.195207
15-0.11709-0.91450.182027
16-0.25903-2.02310.023726
170.0707710.55270.29123


Partial Autocorrelation Function
Time lag kPACF(k)T-STATP-value
10.0378670.29580.384211
2-0.124616-0.97330.167129
3-0.212689-1.66120.050907
4-0.274097-2.14080.018149
50.1213940.94810.173406
60.0419630.32770.372113
70.1388981.08480.141133
8-0.181152-1.41480.0811
9-0.140331-1.0960.138689
10-0.163531-1.27720.103183
11-0.02308-0.18030.428773
120.4671473.64850.000274
13-0.019095-0.14910.440969
14-0.08124-0.63450.264062
150.1051830.82150.207279
16-0.032599-0.25460.399943
17-0.081941-0.640.262291

\begin{tabular}{lllllllll}
\hline
Partial Autocorrelation Function \tabularnewline
Time lag k & PACF(k) & T-STAT & P-value \tabularnewline
1 & 0.037867 & 0.2958 & 0.384211 \tabularnewline
2 & -0.124616 & -0.9733 & 0.167129 \tabularnewline
3 & -0.212689 & -1.6612 & 0.050907 \tabularnewline
4 & -0.274097 & -2.1408 & 0.018149 \tabularnewline
5 & 0.121394 & 0.9481 & 0.173406 \tabularnewline
6 & 0.041963 & 0.3277 & 0.372113 \tabularnewline
7 & 0.138898 & 1.0848 & 0.141133 \tabularnewline
8 & -0.181152 & -1.4148 & 0.0811 \tabularnewline
9 & -0.140331 & -1.096 & 0.138689 \tabularnewline
10 & -0.163531 & -1.2772 & 0.103183 \tabularnewline
11 & -0.02308 & -0.1803 & 0.428773 \tabularnewline
12 & 0.467147 & 3.6485 & 0.000274 \tabularnewline
13 & -0.019095 & -0.1491 & 0.440969 \tabularnewline
14 & -0.08124 & -0.6345 & 0.264062 \tabularnewline
15 & 0.105183 & 0.8215 & 0.207279 \tabularnewline
16 & -0.032599 & -0.2546 & 0.399943 \tabularnewline
17 & -0.081941 & -0.64 & 0.262291 \tabularnewline
\hline
\end{tabular}
%Source: https://freestatistics.org/blog/index.php?pk=31416&T=2

[TABLE]
[ROW][C]Partial Autocorrelation Function[/C][/ROW]
[ROW][C]Time lag k[/C][C]PACF(k)[/C][C]T-STAT[/C][C]P-value[/C][/ROW]
[ROW][C]1[/C][C]0.037867[/C][C]0.2958[/C][C]0.384211[/C][/ROW]
[ROW][C]2[/C][C]-0.124616[/C][C]-0.9733[/C][C]0.167129[/C][/ROW]
[ROW][C]3[/C][C]-0.212689[/C][C]-1.6612[/C][C]0.050907[/C][/ROW]
[ROW][C]4[/C][C]-0.274097[/C][C]-2.1408[/C][C]0.018149[/C][/ROW]
[ROW][C]5[/C][C]0.121394[/C][C]0.9481[/C][C]0.173406[/C][/ROW]
[ROW][C]6[/C][C]0.041963[/C][C]0.3277[/C][C]0.372113[/C][/ROW]
[ROW][C]7[/C][C]0.138898[/C][C]1.0848[/C][C]0.141133[/C][/ROW]
[ROW][C]8[/C][C]-0.181152[/C][C]-1.4148[/C][C]0.0811[/C][/ROW]
[ROW][C]9[/C][C]-0.140331[/C][C]-1.096[/C][C]0.138689[/C][/ROW]
[ROW][C]10[/C][C]-0.163531[/C][C]-1.2772[/C][C]0.103183[/C][/ROW]
[ROW][C]11[/C][C]-0.02308[/C][C]-0.1803[/C][C]0.428773[/C][/ROW]
[ROW][C]12[/C][C]0.467147[/C][C]3.6485[/C][C]0.000274[/C][/ROW]
[ROW][C]13[/C][C]-0.019095[/C][C]-0.1491[/C][C]0.440969[/C][/ROW]
[ROW][C]14[/C][C]-0.08124[/C][C]-0.6345[/C][C]0.264062[/C][/ROW]
[ROW][C]15[/C][C]0.105183[/C][C]0.8215[/C][C]0.207279[/C][/ROW]
[ROW][C]16[/C][C]-0.032599[/C][C]-0.2546[/C][C]0.399943[/C][/ROW]
[ROW][C]17[/C][C]-0.081941[/C][C]-0.64[/C][C]0.262291[/C][/ROW]
[/TABLE]
Source: https://freestatistics.org/blog/index.php?pk=31416&T=2

Globally Unique Identifier (entire table): ba.freestatistics.org/blog/index.php?pk=31416&T=2

As an alternative you can also use a QR Code:  

The GUIDs for individual cells are displayed in the table below:

Partial Autocorrelation Function
Time lag kPACF(k)T-STATP-value
10.0378670.29580.384211
2-0.124616-0.97330.167129
3-0.212689-1.66120.050907
4-0.274097-2.14080.018149
50.1213940.94810.173406
60.0419630.32770.372113
70.1388981.08480.141133
8-0.181152-1.41480.0811
9-0.140331-1.0960.138689
10-0.163531-1.27720.103183
11-0.02308-0.18030.428773
120.4671473.64850.000274
13-0.019095-0.14910.440969
14-0.08124-0.63450.264062
150.1051830.82150.207279
16-0.032599-0.25460.399943
17-0.081941-0.640.262291


Parameters (Session):
par1 = FALSE ; par2 = 1 ; par3 = 0 ; par4 = 1 ; par5 = 12 ; par6 = 3 ; par7 = 1 ; par8 = 2 ; par9 = 1 ;
Parameters (R input):
par1 = Default ; par2 = 1 ; par3 = 0 ; par4 = 0 ; par5 = 12 ;
R code (references can be found in the software module):
if (par1 == 'Default') {
par1 = 10*log10(length(x))
} else {
par1 <- as.numeric(par1)
}
par2 <- as.numeric(par2)
par3 <- as.numeric(par3)
par4 <- as.numeric(par4)
par5 <- as.numeric(par5)
if (par2 == 0) {
x <- log(x)
} else {
x <- (x ^ par2 - 1) / par2
}
if (par3 > 0) x <- diff(x,lag=1,difference=par3)
if (par4 > 0) x <- diff(x,lag=par5,difference=par4)
bitmap(file='pic1.png')
racf <- acf(x,par1,main='Autocorrelation',xlab='lags',ylab='ACF')
dev.off()
bitmap(file='pic2.png')
rpacf <- pacf(x,par1,main='Partial Autocorrelation',xlab='lags',ylab='PACF')
dev.off()
(myacf <- c(racf$acf))
(mypacf <- c(rpacf$acf))
lengthx <- length(x)
sqrtn <- sqrt(lengthx)
load(file='createtable')
a<-table.start()
a<-table.row.start(a)
a<-table.element(a,'Autocorrelation Function',4,TRUE)
a<-table.row.end(a)
a<-table.row.start(a)
a<-table.element(a,'Time lag k',header=TRUE)
a<-table.element(a,hyperlink('basics.htm','ACF(k)','click here for more information about the Autocorrelation Function'),header=TRUE)
a<-table.element(a,'T-STAT',header=TRUE)
a<-table.element(a,'P-value',header=TRUE)
a<-table.row.end(a)
for (i in 2:(par1+1)) {
a<-table.row.start(a)
a<-table.element(a,i-1,header=TRUE)
a<-table.element(a,round(myacf[i],6))
mytstat <- myacf[i]*sqrtn
a<-table.element(a,round(mytstat,4))
a<-table.element(a,round(1-pt(abs(mytstat),lengthx),6))
a<-table.row.end(a)
}
a<-table.end(a)
table.save(a,file='mytable.tab')
a<-table.start()
a<-table.row.start(a)
a<-table.element(a,'Partial Autocorrelation Function',4,TRUE)
a<-table.row.end(a)
a<-table.row.start(a)
a<-table.element(a,'Time lag k',header=TRUE)
a<-table.element(a,hyperlink('basics.htm','PACF(k)','click here for more information about the Partial Autocorrelation Function'),header=TRUE)
a<-table.element(a,'T-STAT',header=TRUE)
a<-table.element(a,'P-value',header=TRUE)
a<-table.row.end(a)
for (i in 1:par1) {
a<-table.row.start(a)
a<-table.element(a,i,header=TRUE)
a<-table.element(a,round(mypacf[i],6))
mytstat <- mypacf[i]*sqrtn
a<-table.element(a,round(mytstat,4))
a<-table.element(a,round(1-pt(abs(mytstat),lengthx),6))
a<-table.row.end(a)
}
a<-table.end(a)
table.save(a,file='mytable1.tab')