Free Statistics

of Irreproducible Research!

Author's title

Author*The author of this computation has been verified*
R Software Modulerwasp_autocorrelation.wasp
Title produced by software(Partial) Autocorrelation Function
Date of computationTue, 09 Dec 2008 05:52:58 -0700
Cite this page as followsStatistical Computations at FreeStatistics.org, Office for Research Development and Education, URL https://freestatistics.org/blog/index.php?v=date/2008/Dec/09/t1228827323ufxxfyyitmncxlu.htm/, Retrieved Sun, 19 May 2024 12:35:52 +0000
Statistical Computations at FreeStatistics.org, Office for Research Development and Education, URL https://freestatistics.org/blog/index.php?pk=31349, Retrieved Sun, 19 May 2024 12:35:52 +0000
QR Codes:

Original text written by user:
IsPrivate?No (this computation is public)
User-defined keywords
Estimated Impact185
Family? (F = Feedback message, R = changed R code, M = changed R Module, P = changed Parameters, D = changed Data)
F     [Univariate Data Series] [Airline data] [2007-10-18 09:58:47] [42daae401fd3def69a25014f2252b4c2]
F RMPD  [Spectral Analysis] [airline data] [2008-12-02 12:35:12] [0e5eff269cdcaf8789c45b6ee36b0c3d]
F RMPD    [Cross Correlation Function] [airline data] [2008-12-02 13:18:05] [0e5eff269cdcaf8789c45b6ee36b0c3d]
- RMPD      [(Partial) Autocorrelation Function] [paper] [2008-12-02 14:51:55] [0e5eff269cdcaf8789c45b6ee36b0c3d]
-   P           [(Partial) Autocorrelation Function] [acf] [2008-12-09 12:52:58] [09074fbe368d26382bb94e5bb318a104] [Current]
Feedback Forum

Post a new message
Dataseries X:
35810356.5
35492936.3
38937434.1
40059102.8
37708710.2
41570965.7
36333563
34181220.1
42593543.9
43119727.6
38497690.9
45473273.4
38399780.4
38882302.6
44051120.6
41677559.9
40699203.5
44150027.6
38225518.7
35447405.7
43075518.3
42302792
39743541.7
44670641.2
37123384
37668266.4
46117528.8
42273156.4
39404153.2
45799994.5
38602505.2
39454830.1
47427901.4
46497980.9
45057149.4
50615569.2
43033396.2
46013056.5
54222266.3
46417306.4
51046271.8
51201279.6
43475288.7
44968981.1
53939345.4
54549319.7
54072107.3
58434230.1
51158751
50039368
57872617.4
51642978.8
54534465.9
56094697.8
48189983.1
47492381
52987449.1
55719803.5
53922860.5
54931231.9


Summary of computational transaction
Raw Inputview raw input (R code)
Raw Outputview raw output of R engine
Computing time1 seconds
R Server'Gwilym Jenkins' @ 72.249.127.135

\begin{tabular}{lllllllll}
\hline
Summary of computational transaction \tabularnewline
Raw Input & view raw input (R code)  \tabularnewline
Raw Output & view raw output of R engine  \tabularnewline
Computing time & 1 seconds \tabularnewline
R Server & 'Gwilym Jenkins' @ 72.249.127.135 \tabularnewline
\hline
\end{tabular}
%Source: https://freestatistics.org/blog/index.php?pk=31349&T=0

[TABLE]
[ROW][C]Summary of computational transaction[/C][/ROW]
[ROW][C]Raw Input[/C][C]view raw input (R code) [/C][/ROW]
[ROW][C]Raw Output[/C][C]view raw output of R engine [/C][/ROW]
[ROW][C]Computing time[/C][C]1 seconds[/C][/ROW]
[ROW][C]R Server[/C][C]'Gwilym Jenkins' @ 72.249.127.135[/C][/ROW]
[/TABLE]
Source: https://freestatistics.org/blog/index.php?pk=31349&T=0

Globally Unique Identifier (entire table): ba.freestatistics.org/blog/index.php?pk=31349&T=0

As an alternative you can also use a QR Code:  

The GUIDs for individual cells are displayed in the table below:

Summary of computational transaction
Raw Inputview raw input (R code)
Raw Outputview raw output of R engine
Computing time1 seconds
R Server'Gwilym Jenkins' @ 72.249.127.135


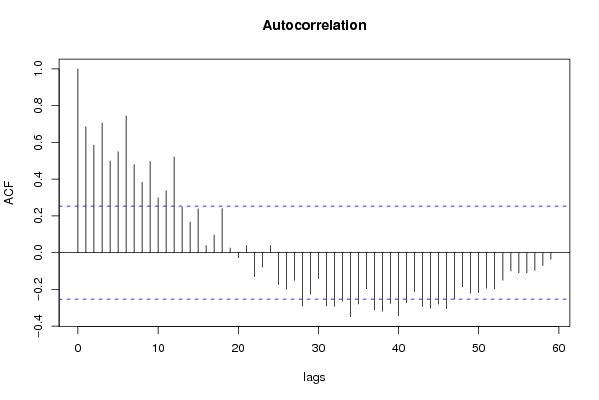
Autocorrelation Function
Time lag kACF(k)T-STATP-value
10.6860795.31431e-06
20.5858284.53781.4e-05
30.7056195.46570
40.4993483.86790.000136
50.5493324.25513.7e-05
60.7445945.76760
70.4797073.71580.000223
80.3832842.96890.002145
90.4967043.84750.000146
100.2986012.3130.012085
110.337412.61360.005655
120.5211344.03677.8e-05
130.2471871.91470.030151
140.167711.29910.099444
150.2389951.85120.034529
160.0388460.30090.382267
170.0971380.75240.227369
180.2402111.86070.033847
190.0255170.19770.421993
20-0.027013-0.20920.417484
210.0395480.30630.380204
22-0.130003-1.0070.158989
23-0.07812-0.60510.273691
240.0395980.30670.380057
25-0.172487-1.33610.093284
26-0.199037-1.54170.064198
27-0.150414-1.16510.124295
28-0.290502-2.25020.014057
29-0.22574-1.74860.042739
30-0.140259-1.08640.140814
31-0.28911-2.23940.014423
32-0.291667-2.25920.013757
33-0.26279-2.03560.023109
34-0.34782-2.69420.004569
35-0.278713-2.15890.017434
36-0.195743-1.51620.067358
37-0.310115-2.40210.009706
38-0.31861-2.46790.008229
39-0.27615-2.1390.018255
40-0.343551-2.66110.004989
41-0.271698-2.10460.019763
42-0.211573-1.63880.053241
43-0.29304-2.26990.013411
44-0.301719-2.33710.011395
45-0.27952-2.16520.017182
46-0.30384-2.35350.010945
47-0.25227-1.95410.027679
48-0.185432-1.43640.078048
49-0.221126-1.71280.045953
50-0.216643-1.67810.049264
51-0.193235-1.49680.069845
52-0.197151-1.52710.065993
53-0.149325-1.15670.125997
54-0.099099-0.76760.222863
55-0.109607-0.8490.199626
56-0.109313-0.84670.200255
57-0.095435-0.73920.231323
58-0.068847-0.53330.297902
59-0.035674-0.27630.391623
60NANANA

\begin{tabular}{lllllllll}
\hline
Autocorrelation Function \tabularnewline
Time lag k & ACF(k) & T-STAT & P-value \tabularnewline
1 & 0.686079 & 5.3143 & 1e-06 \tabularnewline
2 & 0.585828 & 4.5378 & 1.4e-05 \tabularnewline
3 & 0.705619 & 5.4657 & 0 \tabularnewline
4 & 0.499348 & 3.8679 & 0.000136 \tabularnewline
5 & 0.549332 & 4.2551 & 3.7e-05 \tabularnewline
6 & 0.744594 & 5.7676 & 0 \tabularnewline
7 & 0.479707 & 3.7158 & 0.000223 \tabularnewline
8 & 0.383284 & 2.9689 & 0.002145 \tabularnewline
9 & 0.496704 & 3.8475 & 0.000146 \tabularnewline
10 & 0.298601 & 2.313 & 0.012085 \tabularnewline
11 & 0.33741 & 2.6136 & 0.005655 \tabularnewline
12 & 0.521134 & 4.0367 & 7.8e-05 \tabularnewline
13 & 0.247187 & 1.9147 & 0.030151 \tabularnewline
14 & 0.16771 & 1.2991 & 0.099444 \tabularnewline
15 & 0.238995 & 1.8512 & 0.034529 \tabularnewline
16 & 0.038846 & 0.3009 & 0.382267 \tabularnewline
17 & 0.097138 & 0.7524 & 0.227369 \tabularnewline
18 & 0.240211 & 1.8607 & 0.033847 \tabularnewline
19 & 0.025517 & 0.1977 & 0.421993 \tabularnewline
20 & -0.027013 & -0.2092 & 0.417484 \tabularnewline
21 & 0.039548 & 0.3063 & 0.380204 \tabularnewline
22 & -0.130003 & -1.007 & 0.158989 \tabularnewline
23 & -0.07812 & -0.6051 & 0.273691 \tabularnewline
24 & 0.039598 & 0.3067 & 0.380057 \tabularnewline
25 & -0.172487 & -1.3361 & 0.093284 \tabularnewline
26 & -0.199037 & -1.5417 & 0.064198 \tabularnewline
27 & -0.150414 & -1.1651 & 0.124295 \tabularnewline
28 & -0.290502 & -2.2502 & 0.014057 \tabularnewline
29 & -0.22574 & -1.7486 & 0.042739 \tabularnewline
30 & -0.140259 & -1.0864 & 0.140814 \tabularnewline
31 & -0.28911 & -2.2394 & 0.014423 \tabularnewline
32 & -0.291667 & -2.2592 & 0.013757 \tabularnewline
33 & -0.26279 & -2.0356 & 0.023109 \tabularnewline
34 & -0.34782 & -2.6942 & 0.004569 \tabularnewline
35 & -0.278713 & -2.1589 & 0.017434 \tabularnewline
36 & -0.195743 & -1.5162 & 0.067358 \tabularnewline
37 & -0.310115 & -2.4021 & 0.009706 \tabularnewline
38 & -0.31861 & -2.4679 & 0.008229 \tabularnewline
39 & -0.27615 & -2.139 & 0.018255 \tabularnewline
40 & -0.343551 & -2.6611 & 0.004989 \tabularnewline
41 & -0.271698 & -2.1046 & 0.019763 \tabularnewline
42 & -0.211573 & -1.6388 & 0.053241 \tabularnewline
43 & -0.29304 & -2.2699 & 0.013411 \tabularnewline
44 & -0.301719 & -2.3371 & 0.011395 \tabularnewline
45 & -0.27952 & -2.1652 & 0.017182 \tabularnewline
46 & -0.30384 & -2.3535 & 0.010945 \tabularnewline
47 & -0.25227 & -1.9541 & 0.027679 \tabularnewline
48 & -0.185432 & -1.4364 & 0.078048 \tabularnewline
49 & -0.221126 & -1.7128 & 0.045953 \tabularnewline
50 & -0.216643 & -1.6781 & 0.049264 \tabularnewline
51 & -0.193235 & -1.4968 & 0.069845 \tabularnewline
52 & -0.197151 & -1.5271 & 0.065993 \tabularnewline
53 & -0.149325 & -1.1567 & 0.125997 \tabularnewline
54 & -0.099099 & -0.7676 & 0.222863 \tabularnewline
55 & -0.109607 & -0.849 & 0.199626 \tabularnewline
56 & -0.109313 & -0.8467 & 0.200255 \tabularnewline
57 & -0.095435 & -0.7392 & 0.231323 \tabularnewline
58 & -0.068847 & -0.5333 & 0.297902 \tabularnewline
59 & -0.035674 & -0.2763 & 0.391623 \tabularnewline
60 & NA & NA & NA \tabularnewline
\hline
\end{tabular}
%Source: https://freestatistics.org/blog/index.php?pk=31349&T=1

[TABLE]
[ROW][C]Autocorrelation Function[/C][/ROW]
[ROW][C]Time lag k[/C][C]ACF(k)[/C][C]T-STAT[/C][C]P-value[/C][/ROW]
[ROW][C]1[/C][C]0.686079[/C][C]5.3143[/C][C]1e-06[/C][/ROW]
[ROW][C]2[/C][C]0.585828[/C][C]4.5378[/C][C]1.4e-05[/C][/ROW]
[ROW][C]3[/C][C]0.705619[/C][C]5.4657[/C][C]0[/C][/ROW]
[ROW][C]4[/C][C]0.499348[/C][C]3.8679[/C][C]0.000136[/C][/ROW]
[ROW][C]5[/C][C]0.549332[/C][C]4.2551[/C][C]3.7e-05[/C][/ROW]
[ROW][C]6[/C][C]0.744594[/C][C]5.7676[/C][C]0[/C][/ROW]
[ROW][C]7[/C][C]0.479707[/C][C]3.7158[/C][C]0.000223[/C][/ROW]
[ROW][C]8[/C][C]0.383284[/C][C]2.9689[/C][C]0.002145[/C][/ROW]
[ROW][C]9[/C][C]0.496704[/C][C]3.8475[/C][C]0.000146[/C][/ROW]
[ROW][C]10[/C][C]0.298601[/C][C]2.313[/C][C]0.012085[/C][/ROW]
[ROW][C]11[/C][C]0.33741[/C][C]2.6136[/C][C]0.005655[/C][/ROW]
[ROW][C]12[/C][C]0.521134[/C][C]4.0367[/C][C]7.8e-05[/C][/ROW]
[ROW][C]13[/C][C]0.247187[/C][C]1.9147[/C][C]0.030151[/C][/ROW]
[ROW][C]14[/C][C]0.16771[/C][C]1.2991[/C][C]0.099444[/C][/ROW]
[ROW][C]15[/C][C]0.238995[/C][C]1.8512[/C][C]0.034529[/C][/ROW]
[ROW][C]16[/C][C]0.038846[/C][C]0.3009[/C][C]0.382267[/C][/ROW]
[ROW][C]17[/C][C]0.097138[/C][C]0.7524[/C][C]0.227369[/C][/ROW]
[ROW][C]18[/C][C]0.240211[/C][C]1.8607[/C][C]0.033847[/C][/ROW]
[ROW][C]19[/C][C]0.025517[/C][C]0.1977[/C][C]0.421993[/C][/ROW]
[ROW][C]20[/C][C]-0.027013[/C][C]-0.2092[/C][C]0.417484[/C][/ROW]
[ROW][C]21[/C][C]0.039548[/C][C]0.3063[/C][C]0.380204[/C][/ROW]
[ROW][C]22[/C][C]-0.130003[/C][C]-1.007[/C][C]0.158989[/C][/ROW]
[ROW][C]23[/C][C]-0.07812[/C][C]-0.6051[/C][C]0.273691[/C][/ROW]
[ROW][C]24[/C][C]0.039598[/C][C]0.3067[/C][C]0.380057[/C][/ROW]
[ROW][C]25[/C][C]-0.172487[/C][C]-1.3361[/C][C]0.093284[/C][/ROW]
[ROW][C]26[/C][C]-0.199037[/C][C]-1.5417[/C][C]0.064198[/C][/ROW]
[ROW][C]27[/C][C]-0.150414[/C][C]-1.1651[/C][C]0.124295[/C][/ROW]
[ROW][C]28[/C][C]-0.290502[/C][C]-2.2502[/C][C]0.014057[/C][/ROW]
[ROW][C]29[/C][C]-0.22574[/C][C]-1.7486[/C][C]0.042739[/C][/ROW]
[ROW][C]30[/C][C]-0.140259[/C][C]-1.0864[/C][C]0.140814[/C][/ROW]
[ROW][C]31[/C][C]-0.28911[/C][C]-2.2394[/C][C]0.014423[/C][/ROW]
[ROW][C]32[/C][C]-0.291667[/C][C]-2.2592[/C][C]0.013757[/C][/ROW]
[ROW][C]33[/C][C]-0.26279[/C][C]-2.0356[/C][C]0.023109[/C][/ROW]
[ROW][C]34[/C][C]-0.34782[/C][C]-2.6942[/C][C]0.004569[/C][/ROW]
[ROW][C]35[/C][C]-0.278713[/C][C]-2.1589[/C][C]0.017434[/C][/ROW]
[ROW][C]36[/C][C]-0.195743[/C][C]-1.5162[/C][C]0.067358[/C][/ROW]
[ROW][C]37[/C][C]-0.310115[/C][C]-2.4021[/C][C]0.009706[/C][/ROW]
[ROW][C]38[/C][C]-0.31861[/C][C]-2.4679[/C][C]0.008229[/C][/ROW]
[ROW][C]39[/C][C]-0.27615[/C][C]-2.139[/C][C]0.018255[/C][/ROW]
[ROW][C]40[/C][C]-0.343551[/C][C]-2.6611[/C][C]0.004989[/C][/ROW]
[ROW][C]41[/C][C]-0.271698[/C][C]-2.1046[/C][C]0.019763[/C][/ROW]
[ROW][C]42[/C][C]-0.211573[/C][C]-1.6388[/C][C]0.053241[/C][/ROW]
[ROW][C]43[/C][C]-0.29304[/C][C]-2.2699[/C][C]0.013411[/C][/ROW]
[ROW][C]44[/C][C]-0.301719[/C][C]-2.3371[/C][C]0.011395[/C][/ROW]
[ROW][C]45[/C][C]-0.27952[/C][C]-2.1652[/C][C]0.017182[/C][/ROW]
[ROW][C]46[/C][C]-0.30384[/C][C]-2.3535[/C][C]0.010945[/C][/ROW]
[ROW][C]47[/C][C]-0.25227[/C][C]-1.9541[/C][C]0.027679[/C][/ROW]
[ROW][C]48[/C][C]-0.185432[/C][C]-1.4364[/C][C]0.078048[/C][/ROW]
[ROW][C]49[/C][C]-0.221126[/C][C]-1.7128[/C][C]0.045953[/C][/ROW]
[ROW][C]50[/C][C]-0.216643[/C][C]-1.6781[/C][C]0.049264[/C][/ROW]
[ROW][C]51[/C][C]-0.193235[/C][C]-1.4968[/C][C]0.069845[/C][/ROW]
[ROW][C]52[/C][C]-0.197151[/C][C]-1.5271[/C][C]0.065993[/C][/ROW]
[ROW][C]53[/C][C]-0.149325[/C][C]-1.1567[/C][C]0.125997[/C][/ROW]
[ROW][C]54[/C][C]-0.099099[/C][C]-0.7676[/C][C]0.222863[/C][/ROW]
[ROW][C]55[/C][C]-0.109607[/C][C]-0.849[/C][C]0.199626[/C][/ROW]
[ROW][C]56[/C][C]-0.109313[/C][C]-0.8467[/C][C]0.200255[/C][/ROW]
[ROW][C]57[/C][C]-0.095435[/C][C]-0.7392[/C][C]0.231323[/C][/ROW]
[ROW][C]58[/C][C]-0.068847[/C][C]-0.5333[/C][C]0.297902[/C][/ROW]
[ROW][C]59[/C][C]-0.035674[/C][C]-0.2763[/C][C]0.391623[/C][/ROW]
[ROW][C]60[/C][C]NA[/C][C]NA[/C][C]NA[/C][/ROW]
[/TABLE]
Source: https://freestatistics.org/blog/index.php?pk=31349&T=1

Globally Unique Identifier (entire table): ba.freestatistics.org/blog/index.php?pk=31349&T=1

As an alternative you can also use a QR Code:  

The GUIDs for individual cells are displayed in the table below:

Autocorrelation Function
Time lag kACF(k)T-STATP-value
10.6860795.31431e-06
20.5858284.53781.4e-05
30.7056195.46570
40.4993483.86790.000136
50.5493324.25513.7e-05
60.7445945.76760
70.4797073.71580.000223
80.3832842.96890.002145
90.4967043.84750.000146
100.2986012.3130.012085
110.337412.61360.005655
120.5211344.03677.8e-05
130.2471871.91470.030151
140.167711.29910.099444
150.2389951.85120.034529
160.0388460.30090.382267
170.0971380.75240.227369
180.2402111.86070.033847
190.0255170.19770.421993
20-0.027013-0.20920.417484
210.0395480.30630.380204
22-0.130003-1.0070.158989
23-0.07812-0.60510.273691
240.0395980.30670.380057
25-0.172487-1.33610.093284
26-0.199037-1.54170.064198
27-0.150414-1.16510.124295
28-0.290502-2.25020.014057
29-0.22574-1.74860.042739
30-0.140259-1.08640.140814
31-0.28911-2.23940.014423
32-0.291667-2.25920.013757
33-0.26279-2.03560.023109
34-0.34782-2.69420.004569
35-0.278713-2.15890.017434
36-0.195743-1.51620.067358
37-0.310115-2.40210.009706
38-0.31861-2.46790.008229
39-0.27615-2.1390.018255
40-0.343551-2.66110.004989
41-0.271698-2.10460.019763
42-0.211573-1.63880.053241
43-0.29304-2.26990.013411
44-0.301719-2.33710.011395
45-0.27952-2.16520.017182
46-0.30384-2.35350.010945
47-0.25227-1.95410.027679
48-0.185432-1.43640.078048
49-0.221126-1.71280.045953
50-0.216643-1.67810.049264
51-0.193235-1.49680.069845
52-0.197151-1.52710.065993
53-0.149325-1.15670.125997
54-0.099099-0.76760.222863
55-0.109607-0.8490.199626
56-0.109313-0.84670.200255
57-0.095435-0.73920.231323
58-0.068847-0.53330.297902
59-0.035674-0.27630.391623
60NANANA


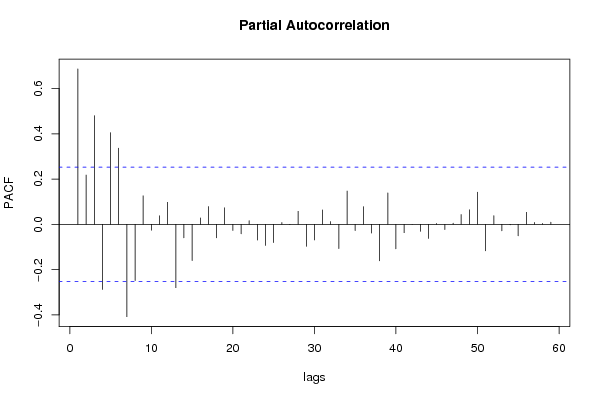
Partial Autocorrelation Function
Time lag kPACF(k)T-STATP-value
10.6860795.31431e-06
20.2175041.68480.048613
30.4796963.71570.000223
4-0.287227-2.22490.014932
50.404753.13520.001329
60.3363492.60530.005778
7-0.407367-3.15540.001253
8-0.248051-1.92140.029718
90.126050.97640.166398
10-0.025516-0.19760.421994
110.0375240.29070.386157
120.0970930.75210.227472
13-0.279642-2.16610.017144
14-0.059265-0.45910.323923
15-0.159993-1.23930.110029
160.0283160.21930.413567
170.0788040.61040.271947
18-0.059496-0.46090.323286
190.0729540.56510.287056
20-0.026733-0.20710.418328
21-0.041513-0.32160.374453
220.0163470.12660.44983
23-0.069123-0.53540.297168
24-0.093053-0.72080.23692
25-0.080354-0.62240.268012
260.0078510.06080.475854
27-0.000851-0.00660.497382
280.0579280.44870.327629
29-0.096918-0.75070.227876
30-0.068772-0.53270.298103
310.0637330.49370.311669
320.0121160.09380.462772
33-0.106973-0.82860.205306
340.1467631.13680.130067
35-0.027404-0.21230.416308
360.0779120.60350.274225
37-0.038136-0.29540.384353
38-0.160667-1.24450.109074
390.1386151.07370.143626
40-0.108089-0.83730.202887
41-0.036873-0.28560.388077
424.4e-053e-040.499866
43-0.03059-0.23690.406752
44-0.062277-0.48240.315641
450.0040620.03150.487501
46-0.022718-0.1760.430455
470.0049690.03850.484714
480.0430710.33360.369912
490.0641650.4970.310495
500.1419041.09920.138039
51-0.11668-0.90380.184858
520.0382070.2960.384144
53-0.028686-0.22220.412456
54-0.00213-0.01650.493447
55-0.050347-0.390.348964
560.0532910.41280.340615
570.0084330.06530.474066
580.003890.03010.488032
590.00980.07590.46987
60NANANA

\begin{tabular}{lllllllll}
\hline
Partial Autocorrelation Function \tabularnewline
Time lag k & PACF(k) & T-STAT & P-value \tabularnewline
1 & 0.686079 & 5.3143 & 1e-06 \tabularnewline
2 & 0.217504 & 1.6848 & 0.048613 \tabularnewline
3 & 0.479696 & 3.7157 & 0.000223 \tabularnewline
4 & -0.287227 & -2.2249 & 0.014932 \tabularnewline
5 & 0.40475 & 3.1352 & 0.001329 \tabularnewline
6 & 0.336349 & 2.6053 & 0.005778 \tabularnewline
7 & -0.407367 & -3.1554 & 0.001253 \tabularnewline
8 & -0.248051 & -1.9214 & 0.029718 \tabularnewline
9 & 0.12605 & 0.9764 & 0.166398 \tabularnewline
10 & -0.025516 & -0.1976 & 0.421994 \tabularnewline
11 & 0.037524 & 0.2907 & 0.386157 \tabularnewline
12 & 0.097093 & 0.7521 & 0.227472 \tabularnewline
13 & -0.279642 & -2.1661 & 0.017144 \tabularnewline
14 & -0.059265 & -0.4591 & 0.323923 \tabularnewline
15 & -0.159993 & -1.2393 & 0.110029 \tabularnewline
16 & 0.028316 & 0.2193 & 0.413567 \tabularnewline
17 & 0.078804 & 0.6104 & 0.271947 \tabularnewline
18 & -0.059496 & -0.4609 & 0.323286 \tabularnewline
19 & 0.072954 & 0.5651 & 0.287056 \tabularnewline
20 & -0.026733 & -0.2071 & 0.418328 \tabularnewline
21 & -0.041513 & -0.3216 & 0.374453 \tabularnewline
22 & 0.016347 & 0.1266 & 0.44983 \tabularnewline
23 & -0.069123 & -0.5354 & 0.297168 \tabularnewline
24 & -0.093053 & -0.7208 & 0.23692 \tabularnewline
25 & -0.080354 & -0.6224 & 0.268012 \tabularnewline
26 & 0.007851 & 0.0608 & 0.475854 \tabularnewline
27 & -0.000851 & -0.0066 & 0.497382 \tabularnewline
28 & 0.057928 & 0.4487 & 0.327629 \tabularnewline
29 & -0.096918 & -0.7507 & 0.227876 \tabularnewline
30 & -0.068772 & -0.5327 & 0.298103 \tabularnewline
31 & 0.063733 & 0.4937 & 0.311669 \tabularnewline
32 & 0.012116 & 0.0938 & 0.462772 \tabularnewline
33 & -0.106973 & -0.8286 & 0.205306 \tabularnewline
34 & 0.146763 & 1.1368 & 0.130067 \tabularnewline
35 & -0.027404 & -0.2123 & 0.416308 \tabularnewline
36 & 0.077912 & 0.6035 & 0.274225 \tabularnewline
37 & -0.038136 & -0.2954 & 0.384353 \tabularnewline
38 & -0.160667 & -1.2445 & 0.109074 \tabularnewline
39 & 0.138615 & 1.0737 & 0.143626 \tabularnewline
40 & -0.108089 & -0.8373 & 0.202887 \tabularnewline
41 & -0.036873 & -0.2856 & 0.388077 \tabularnewline
42 & 4.4e-05 & 3e-04 & 0.499866 \tabularnewline
43 & -0.03059 & -0.2369 & 0.406752 \tabularnewline
44 & -0.062277 & -0.4824 & 0.315641 \tabularnewline
45 & 0.004062 & 0.0315 & 0.487501 \tabularnewline
46 & -0.022718 & -0.176 & 0.430455 \tabularnewline
47 & 0.004969 & 0.0385 & 0.484714 \tabularnewline
48 & 0.043071 & 0.3336 & 0.369912 \tabularnewline
49 & 0.064165 & 0.497 & 0.310495 \tabularnewline
50 & 0.141904 & 1.0992 & 0.138039 \tabularnewline
51 & -0.11668 & -0.9038 & 0.184858 \tabularnewline
52 & 0.038207 & 0.296 & 0.384144 \tabularnewline
53 & -0.028686 & -0.2222 & 0.412456 \tabularnewline
54 & -0.00213 & -0.0165 & 0.493447 \tabularnewline
55 & -0.050347 & -0.39 & 0.348964 \tabularnewline
56 & 0.053291 & 0.4128 & 0.340615 \tabularnewline
57 & 0.008433 & 0.0653 & 0.474066 \tabularnewline
58 & 0.00389 & 0.0301 & 0.488032 \tabularnewline
59 & 0.0098 & 0.0759 & 0.46987 \tabularnewline
60 & NA & NA & NA \tabularnewline
\hline
\end{tabular}
%Source: https://freestatistics.org/blog/index.php?pk=31349&T=2

[TABLE]
[ROW][C]Partial Autocorrelation Function[/C][/ROW]
[ROW][C]Time lag k[/C][C]PACF(k)[/C][C]T-STAT[/C][C]P-value[/C][/ROW]
[ROW][C]1[/C][C]0.686079[/C][C]5.3143[/C][C]1e-06[/C][/ROW]
[ROW][C]2[/C][C]0.217504[/C][C]1.6848[/C][C]0.048613[/C][/ROW]
[ROW][C]3[/C][C]0.479696[/C][C]3.7157[/C][C]0.000223[/C][/ROW]
[ROW][C]4[/C][C]-0.287227[/C][C]-2.2249[/C][C]0.014932[/C][/ROW]
[ROW][C]5[/C][C]0.40475[/C][C]3.1352[/C][C]0.001329[/C][/ROW]
[ROW][C]6[/C][C]0.336349[/C][C]2.6053[/C][C]0.005778[/C][/ROW]
[ROW][C]7[/C][C]-0.407367[/C][C]-3.1554[/C][C]0.001253[/C][/ROW]
[ROW][C]8[/C][C]-0.248051[/C][C]-1.9214[/C][C]0.029718[/C][/ROW]
[ROW][C]9[/C][C]0.12605[/C][C]0.9764[/C][C]0.166398[/C][/ROW]
[ROW][C]10[/C][C]-0.025516[/C][C]-0.1976[/C][C]0.421994[/C][/ROW]
[ROW][C]11[/C][C]0.037524[/C][C]0.2907[/C][C]0.386157[/C][/ROW]
[ROW][C]12[/C][C]0.097093[/C][C]0.7521[/C][C]0.227472[/C][/ROW]
[ROW][C]13[/C][C]-0.279642[/C][C]-2.1661[/C][C]0.017144[/C][/ROW]
[ROW][C]14[/C][C]-0.059265[/C][C]-0.4591[/C][C]0.323923[/C][/ROW]
[ROW][C]15[/C][C]-0.159993[/C][C]-1.2393[/C][C]0.110029[/C][/ROW]
[ROW][C]16[/C][C]0.028316[/C][C]0.2193[/C][C]0.413567[/C][/ROW]
[ROW][C]17[/C][C]0.078804[/C][C]0.6104[/C][C]0.271947[/C][/ROW]
[ROW][C]18[/C][C]-0.059496[/C][C]-0.4609[/C][C]0.323286[/C][/ROW]
[ROW][C]19[/C][C]0.072954[/C][C]0.5651[/C][C]0.287056[/C][/ROW]
[ROW][C]20[/C][C]-0.026733[/C][C]-0.2071[/C][C]0.418328[/C][/ROW]
[ROW][C]21[/C][C]-0.041513[/C][C]-0.3216[/C][C]0.374453[/C][/ROW]
[ROW][C]22[/C][C]0.016347[/C][C]0.1266[/C][C]0.44983[/C][/ROW]
[ROW][C]23[/C][C]-0.069123[/C][C]-0.5354[/C][C]0.297168[/C][/ROW]
[ROW][C]24[/C][C]-0.093053[/C][C]-0.7208[/C][C]0.23692[/C][/ROW]
[ROW][C]25[/C][C]-0.080354[/C][C]-0.6224[/C][C]0.268012[/C][/ROW]
[ROW][C]26[/C][C]0.007851[/C][C]0.0608[/C][C]0.475854[/C][/ROW]
[ROW][C]27[/C][C]-0.000851[/C][C]-0.0066[/C][C]0.497382[/C][/ROW]
[ROW][C]28[/C][C]0.057928[/C][C]0.4487[/C][C]0.327629[/C][/ROW]
[ROW][C]29[/C][C]-0.096918[/C][C]-0.7507[/C][C]0.227876[/C][/ROW]
[ROW][C]30[/C][C]-0.068772[/C][C]-0.5327[/C][C]0.298103[/C][/ROW]
[ROW][C]31[/C][C]0.063733[/C][C]0.4937[/C][C]0.311669[/C][/ROW]
[ROW][C]32[/C][C]0.012116[/C][C]0.0938[/C][C]0.462772[/C][/ROW]
[ROW][C]33[/C][C]-0.106973[/C][C]-0.8286[/C][C]0.205306[/C][/ROW]
[ROW][C]34[/C][C]0.146763[/C][C]1.1368[/C][C]0.130067[/C][/ROW]
[ROW][C]35[/C][C]-0.027404[/C][C]-0.2123[/C][C]0.416308[/C][/ROW]
[ROW][C]36[/C][C]0.077912[/C][C]0.6035[/C][C]0.274225[/C][/ROW]
[ROW][C]37[/C][C]-0.038136[/C][C]-0.2954[/C][C]0.384353[/C][/ROW]
[ROW][C]38[/C][C]-0.160667[/C][C]-1.2445[/C][C]0.109074[/C][/ROW]
[ROW][C]39[/C][C]0.138615[/C][C]1.0737[/C][C]0.143626[/C][/ROW]
[ROW][C]40[/C][C]-0.108089[/C][C]-0.8373[/C][C]0.202887[/C][/ROW]
[ROW][C]41[/C][C]-0.036873[/C][C]-0.2856[/C][C]0.388077[/C][/ROW]
[ROW][C]42[/C][C]4.4e-05[/C][C]3e-04[/C][C]0.499866[/C][/ROW]
[ROW][C]43[/C][C]-0.03059[/C][C]-0.2369[/C][C]0.406752[/C][/ROW]
[ROW][C]44[/C][C]-0.062277[/C][C]-0.4824[/C][C]0.315641[/C][/ROW]
[ROW][C]45[/C][C]0.004062[/C][C]0.0315[/C][C]0.487501[/C][/ROW]
[ROW][C]46[/C][C]-0.022718[/C][C]-0.176[/C][C]0.430455[/C][/ROW]
[ROW][C]47[/C][C]0.004969[/C][C]0.0385[/C][C]0.484714[/C][/ROW]
[ROW][C]48[/C][C]0.043071[/C][C]0.3336[/C][C]0.369912[/C][/ROW]
[ROW][C]49[/C][C]0.064165[/C][C]0.497[/C][C]0.310495[/C][/ROW]
[ROW][C]50[/C][C]0.141904[/C][C]1.0992[/C][C]0.138039[/C][/ROW]
[ROW][C]51[/C][C]-0.11668[/C][C]-0.9038[/C][C]0.184858[/C][/ROW]
[ROW][C]52[/C][C]0.038207[/C][C]0.296[/C][C]0.384144[/C][/ROW]
[ROW][C]53[/C][C]-0.028686[/C][C]-0.2222[/C][C]0.412456[/C][/ROW]
[ROW][C]54[/C][C]-0.00213[/C][C]-0.0165[/C][C]0.493447[/C][/ROW]
[ROW][C]55[/C][C]-0.050347[/C][C]-0.39[/C][C]0.348964[/C][/ROW]
[ROW][C]56[/C][C]0.053291[/C][C]0.4128[/C][C]0.340615[/C][/ROW]
[ROW][C]57[/C][C]0.008433[/C][C]0.0653[/C][C]0.474066[/C][/ROW]
[ROW][C]58[/C][C]0.00389[/C][C]0.0301[/C][C]0.488032[/C][/ROW]
[ROW][C]59[/C][C]0.0098[/C][C]0.0759[/C][C]0.46987[/C][/ROW]
[ROW][C]60[/C][C]NA[/C][C]NA[/C][C]NA[/C][/ROW]
[/TABLE]
Source: https://freestatistics.org/blog/index.php?pk=31349&T=2

Globally Unique Identifier (entire table): ba.freestatistics.org/blog/index.php?pk=31349&T=2

As an alternative you can also use a QR Code:  

The GUIDs for individual cells are displayed in the table below:

Partial Autocorrelation Function
Time lag kPACF(k)T-STATP-value
10.6860795.31431e-06
20.2175041.68480.048613
30.4796963.71570.000223
4-0.287227-2.22490.014932
50.404753.13520.001329
60.3363492.60530.005778
7-0.407367-3.15540.001253
8-0.248051-1.92140.029718
90.126050.97640.166398
10-0.025516-0.19760.421994
110.0375240.29070.386157
120.0970930.75210.227472
13-0.279642-2.16610.017144
14-0.059265-0.45910.323923
15-0.159993-1.23930.110029
160.0283160.21930.413567
170.0788040.61040.271947
18-0.059496-0.46090.323286
190.0729540.56510.287056
20-0.026733-0.20710.418328
21-0.041513-0.32160.374453
220.0163470.12660.44983
23-0.069123-0.53540.297168
24-0.093053-0.72080.23692
25-0.080354-0.62240.268012
260.0078510.06080.475854
27-0.000851-0.00660.497382
280.0579280.44870.327629
29-0.096918-0.75070.227876
30-0.068772-0.53270.298103
310.0637330.49370.311669
320.0121160.09380.462772
33-0.106973-0.82860.205306
340.1467631.13680.130067
35-0.027404-0.21230.416308
360.0779120.60350.274225
37-0.038136-0.29540.384353
38-0.160667-1.24450.109074
390.1386151.07370.143626
40-0.108089-0.83730.202887
41-0.036873-0.28560.388077
424.4e-053e-040.499866
43-0.03059-0.23690.406752
44-0.062277-0.48240.315641
450.0040620.03150.487501
46-0.022718-0.1760.430455
470.0049690.03850.484714
480.0430710.33360.369912
490.0641650.4970.310495
500.1419041.09920.138039
51-0.11668-0.90380.184858
520.0382070.2960.384144
53-0.028686-0.22220.412456
54-0.00213-0.01650.493447
55-0.050347-0.390.348964
560.0532910.41280.340615
570.0084330.06530.474066
580.003890.03010.488032
590.00980.07590.46987
60NANANA


Parameters (Session):
par1 = 60 ; par2 = 1 ; par3 = 0 ; par4 = 0 ; par5 = 12 ;
Parameters (R input):
par1 = 60 ; par2 = 1 ; par3 = 0 ; par4 = 0 ; par5 = 12 ;
R code (references can be found in the software module):
if (par1 == 'Default') {
par1 = 10*log10(length(x))
} else {
par1 <- as.numeric(par1)
}
par2 <- as.numeric(par2)
par3 <- as.numeric(par3)
par4 <- as.numeric(par4)
par5 <- as.numeric(par5)
if (par2 == 0) {
x <- log(x)
} else {
x <- (x ^ par2 - 1) / par2
}
if (par3 > 0) x <- diff(x,lag=1,difference=par3)
if (par4 > 0) x <- diff(x,lag=par5,difference=par4)
bitmap(file='pic1.png')
racf <- acf(x,par1,main='Autocorrelation',xlab='lags',ylab='ACF')
dev.off()
bitmap(file='pic2.png')
rpacf <- pacf(x,par1,main='Partial Autocorrelation',xlab='lags',ylab='PACF')
dev.off()
(myacf <- c(racf$acf))
(mypacf <- c(rpacf$acf))
lengthx <- length(x)
sqrtn <- sqrt(lengthx)
load(file='createtable')
a<-table.start()
a<-table.row.start(a)
a<-table.element(a,'Autocorrelation Function',4,TRUE)
a<-table.row.end(a)
a<-table.row.start(a)
a<-table.element(a,'Time lag k',header=TRUE)
a<-table.element(a,hyperlink('basics.htm','ACF(k)','click here for more information about the Autocorrelation Function'),header=TRUE)
a<-table.element(a,'T-STAT',header=TRUE)
a<-table.element(a,'P-value',header=TRUE)
a<-table.row.end(a)
for (i in 2:(par1+1)) {
a<-table.row.start(a)
a<-table.element(a,i-1,header=TRUE)
a<-table.element(a,round(myacf[i],6))
mytstat <- myacf[i]*sqrtn
a<-table.element(a,round(mytstat,4))
a<-table.element(a,round(1-pt(abs(mytstat),lengthx),6))
a<-table.row.end(a)
}
a<-table.end(a)
table.save(a,file='mytable.tab')
a<-table.start()
a<-table.row.start(a)
a<-table.element(a,'Partial Autocorrelation Function',4,TRUE)
a<-table.row.end(a)
a<-table.row.start(a)
a<-table.element(a,'Time lag k',header=TRUE)
a<-table.element(a,hyperlink('basics.htm','PACF(k)','click here for more information about the Partial Autocorrelation Function'),header=TRUE)
a<-table.element(a,'T-STAT',header=TRUE)
a<-table.element(a,'P-value',header=TRUE)
a<-table.row.end(a)
for (i in 1:par1) {
a<-table.row.start(a)
a<-table.element(a,i,header=TRUE)
a<-table.element(a,round(mypacf[i],6))
mytstat <- mypacf[i]*sqrtn
a<-table.element(a,round(mytstat,4))
a<-table.element(a,round(1-pt(abs(mytstat),lengthx),6))
a<-table.row.end(a)
}
a<-table.end(a)
table.save(a,file='mytable1.tab')