Free Statistics

of Irreproducible Research!

Author's title

Author*Unverified author*
R Software Modulerwasp_autocorrelation.wasp
Title produced by software(Partial) Autocorrelation Function
Date of computationTue, 09 Dec 2008 04:32:38 -0700
Cite this page as followsStatistical Computations at FreeStatistics.org, Office for Research Development and Education, URL https://freestatistics.org/blog/index.php?v=date/2008/Dec/09/t1228822411x3clsxuewzfmdxg.htm/, Retrieved Sun, 19 May 2024 08:44:48 +0000
Statistical Computations at FreeStatistics.org, Office for Research Development and Education, URL https://freestatistics.org/blog/index.php?pk=31307, Retrieved Sun, 19 May 2024 08:44:48 +0000
QR Codes:

Original text written by user:
IsPrivate?No (this computation is public)
User-defined keywords
Estimated Impact194
Family? (F = Feedback message, R = changed R code, M = changed R Module, P = changed Parameters, D = changed Data)
F       [(Partial) Autocorrelation Function] [Stefan Temmerman] [2008-12-09 11:32:38] [30f7cb12a8cb61e43b87da59ece37a2f] [Current]
Feedback Forum
2008-12-15 17:09:30 [Gert-Jan Geudens] [reply
We bekomen een inderdaad een stationaire reeks door enkel niet-seizonaal te differentiëren.
2008-12-15 17:32:48 [Gert-Jan Geudens] [reply
STAP 4

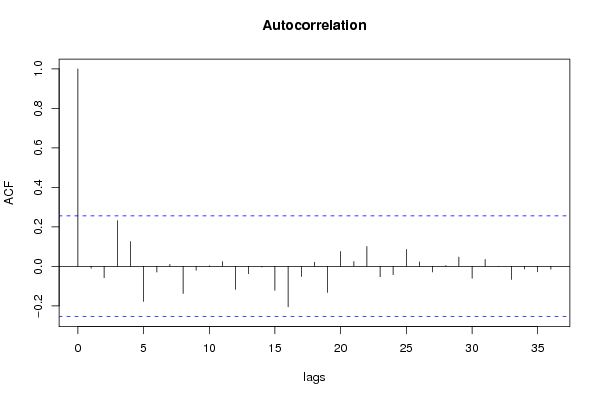
Een AR-proces kunnen we afleiden uit de autocorrelatie. We herkennen hier -mits een beetje goede wil- het typische patroon voor een AR-proces. Om parameter p te bepalen moeten we naar het aantal significante coëfficiënten in de partiële autocorrelatie kijken. We zien dat er geen significante partiële autocorrelatiecoëfficiënt is en dus is volgens ons p gelijk aan 0. Als p gelijk is aan nul, is er dus toch geen AR-proces. Dit lijkt ons een beetje vreemd. Daarom lijkt het ons beter om ons te baseren op het software model dat we zullen vinden in stap 5.
Een seizonaal AR-proces (seizonaliteit in de ACF) is er ook niet en een MA proces (PACF) en SMA (seizonaliteit in PCF) zijn er ook niet.

Post a new message
Dataseries X:
10709
10662
10570
10297
10635
10872
10296
10383
10431
10574
10653
10805
10872
10625
10407
10463
10556
10646
10702
11353
11346
11451
11964
12574
13031
13812
14544
14931
14886
16005
17064
15168
16050
15839
15137
14954
15648
15305
15579
16348
15928
16171
15937
15713
15594
15683
16438
17032
17696
17745
19394
20148
20108
18584
18441
18391
19178
18079
18483
19644


Summary of computational transaction
Raw Inputview raw input (R code)
Raw Outputview raw output of R engine
Computing time1 seconds
R Server'Gwilym Jenkins' @ 72.249.127.135

\begin{tabular}{lllllllll}
\hline
Summary of computational transaction \tabularnewline
Raw Input & view raw input (R code)  \tabularnewline
Raw Output & view raw output of R engine  \tabularnewline
Computing time & 1 seconds \tabularnewline
R Server & 'Gwilym Jenkins' @ 72.249.127.135 \tabularnewline
\hline
\end{tabular}
%Source: https://freestatistics.org/blog/index.php?pk=31307&T=0

[TABLE]
[ROW][C]Summary of computational transaction[/C][/ROW]
[ROW][C]Raw Input[/C][C]view raw input (R code) [/C][/ROW]
[ROW][C]Raw Output[/C][C]view raw output of R engine [/C][/ROW]
[ROW][C]Computing time[/C][C]1 seconds[/C][/ROW]
[ROW][C]R Server[/C][C]'Gwilym Jenkins' @ 72.249.127.135[/C][/ROW]
[/TABLE]
Source: https://freestatistics.org/blog/index.php?pk=31307&T=0

Globally Unique Identifier (entire table): ba.freestatistics.org/blog/index.php?pk=31307&T=0

As an alternative you can also use a QR Code:  

The GUIDs for individual cells are displayed in the table below:

Summary of computational transaction
Raw Inputview raw input (R code)
Raw Outputview raw output of R engine
Computing time1 seconds
R Server'Gwilym Jenkins' @ 72.249.127.135


Autocorrelation Function
Time lag kACF(k)T-STATP-value
1-0.009762-0.0750.470241
2-0.057552-0.44210.33003
30.2314551.77780.040292
40.1251470.96130.170169
5-0.178089-1.36790.088261
6-0.029416-0.2260.41101
70.0092110.07070.471919
8-0.137825-1.05870.147037
9-0.019731-0.15160.440026
100.0025150.01930.492327
110.0240640.18480.426995
12-0.117236-0.90050.185757
13-0.037451-0.28770.387304
14-0.00349-0.02680.489353
15-0.121418-0.93260.177406
16-0.205124-1.57560.060234
17-0.052062-0.39990.345339
180.0209360.16080.436395
19-0.132357-1.01670.156735
200.0751440.57720.283003
210.02430.18660.426288
220.099920.76750.222922
23-0.052606-0.40410.34381
24-0.042718-0.32810.371991
250.0852140.65450.257652
260.0222650.1710.432397
27-0.02879-0.22110.412875
280.0037450.02880.488575
290.0470910.36170.35943
30-0.060748-0.46660.321248
310.0345010.2650.395965
32-0.001593-0.01220.495138
33-0.066304-0.50930.306223
34-0.013949-0.10710.45752
35-0.027749-0.21310.415974
36-0.014854-0.11410.454775

\begin{tabular}{lllllllll}
\hline
Autocorrelation Function \tabularnewline
Time lag k & ACF(k) & T-STAT & P-value \tabularnewline
1 & -0.009762 & -0.075 & 0.470241 \tabularnewline
2 & -0.057552 & -0.4421 & 0.33003 \tabularnewline
3 & 0.231455 & 1.7778 & 0.040292 \tabularnewline
4 & 0.125147 & 0.9613 & 0.170169 \tabularnewline
5 & -0.178089 & -1.3679 & 0.088261 \tabularnewline
6 & -0.029416 & -0.226 & 0.41101 \tabularnewline
7 & 0.009211 & 0.0707 & 0.471919 \tabularnewline
8 & -0.137825 & -1.0587 & 0.147037 \tabularnewline
9 & -0.019731 & -0.1516 & 0.440026 \tabularnewline
10 & 0.002515 & 0.0193 & 0.492327 \tabularnewline
11 & 0.024064 & 0.1848 & 0.426995 \tabularnewline
12 & -0.117236 & -0.9005 & 0.185757 \tabularnewline
13 & -0.037451 & -0.2877 & 0.387304 \tabularnewline
14 & -0.00349 & -0.0268 & 0.489353 \tabularnewline
15 & -0.121418 & -0.9326 & 0.177406 \tabularnewline
16 & -0.205124 & -1.5756 & 0.060234 \tabularnewline
17 & -0.052062 & -0.3999 & 0.345339 \tabularnewline
18 & 0.020936 & 0.1608 & 0.436395 \tabularnewline
19 & -0.132357 & -1.0167 & 0.156735 \tabularnewline
20 & 0.075144 & 0.5772 & 0.283003 \tabularnewline
21 & 0.0243 & 0.1866 & 0.426288 \tabularnewline
22 & 0.09992 & 0.7675 & 0.222922 \tabularnewline
23 & -0.052606 & -0.4041 & 0.34381 \tabularnewline
24 & -0.042718 & -0.3281 & 0.371991 \tabularnewline
25 & 0.085214 & 0.6545 & 0.257652 \tabularnewline
26 & 0.022265 & 0.171 & 0.432397 \tabularnewline
27 & -0.02879 & -0.2211 & 0.412875 \tabularnewline
28 & 0.003745 & 0.0288 & 0.488575 \tabularnewline
29 & 0.047091 & 0.3617 & 0.35943 \tabularnewline
30 & -0.060748 & -0.4666 & 0.321248 \tabularnewline
31 & 0.034501 & 0.265 & 0.395965 \tabularnewline
32 & -0.001593 & -0.0122 & 0.495138 \tabularnewline
33 & -0.066304 & -0.5093 & 0.306223 \tabularnewline
34 & -0.013949 & -0.1071 & 0.45752 \tabularnewline
35 & -0.027749 & -0.2131 & 0.415974 \tabularnewline
36 & -0.014854 & -0.1141 & 0.454775 \tabularnewline
\hline
\end{tabular}
%Source: https://freestatistics.org/blog/index.php?pk=31307&T=1

[TABLE]
[ROW][C]Autocorrelation Function[/C][/ROW]
[ROW][C]Time lag k[/C][C]ACF(k)[/C][C]T-STAT[/C][C]P-value[/C][/ROW]
[ROW][C]1[/C][C]-0.009762[/C][C]-0.075[/C][C]0.470241[/C][/ROW]
[ROW][C]2[/C][C]-0.057552[/C][C]-0.4421[/C][C]0.33003[/C][/ROW]
[ROW][C]3[/C][C]0.231455[/C][C]1.7778[/C][C]0.040292[/C][/ROW]
[ROW][C]4[/C][C]0.125147[/C][C]0.9613[/C][C]0.170169[/C][/ROW]
[ROW][C]5[/C][C]-0.178089[/C][C]-1.3679[/C][C]0.088261[/C][/ROW]
[ROW][C]6[/C][C]-0.029416[/C][C]-0.226[/C][C]0.41101[/C][/ROW]
[ROW][C]7[/C][C]0.009211[/C][C]0.0707[/C][C]0.471919[/C][/ROW]
[ROW][C]8[/C][C]-0.137825[/C][C]-1.0587[/C][C]0.147037[/C][/ROW]
[ROW][C]9[/C][C]-0.019731[/C][C]-0.1516[/C][C]0.440026[/C][/ROW]
[ROW][C]10[/C][C]0.002515[/C][C]0.0193[/C][C]0.492327[/C][/ROW]
[ROW][C]11[/C][C]0.024064[/C][C]0.1848[/C][C]0.426995[/C][/ROW]
[ROW][C]12[/C][C]-0.117236[/C][C]-0.9005[/C][C]0.185757[/C][/ROW]
[ROW][C]13[/C][C]-0.037451[/C][C]-0.2877[/C][C]0.387304[/C][/ROW]
[ROW][C]14[/C][C]-0.00349[/C][C]-0.0268[/C][C]0.489353[/C][/ROW]
[ROW][C]15[/C][C]-0.121418[/C][C]-0.9326[/C][C]0.177406[/C][/ROW]
[ROW][C]16[/C][C]-0.205124[/C][C]-1.5756[/C][C]0.060234[/C][/ROW]
[ROW][C]17[/C][C]-0.052062[/C][C]-0.3999[/C][C]0.345339[/C][/ROW]
[ROW][C]18[/C][C]0.020936[/C][C]0.1608[/C][C]0.436395[/C][/ROW]
[ROW][C]19[/C][C]-0.132357[/C][C]-1.0167[/C][C]0.156735[/C][/ROW]
[ROW][C]20[/C][C]0.075144[/C][C]0.5772[/C][C]0.283003[/C][/ROW]
[ROW][C]21[/C][C]0.0243[/C][C]0.1866[/C][C]0.426288[/C][/ROW]
[ROW][C]22[/C][C]0.09992[/C][C]0.7675[/C][C]0.222922[/C][/ROW]
[ROW][C]23[/C][C]-0.052606[/C][C]-0.4041[/C][C]0.34381[/C][/ROW]
[ROW][C]24[/C][C]-0.042718[/C][C]-0.3281[/C][C]0.371991[/C][/ROW]
[ROW][C]25[/C][C]0.085214[/C][C]0.6545[/C][C]0.257652[/C][/ROW]
[ROW][C]26[/C][C]0.022265[/C][C]0.171[/C][C]0.432397[/C][/ROW]
[ROW][C]27[/C][C]-0.02879[/C][C]-0.2211[/C][C]0.412875[/C][/ROW]
[ROW][C]28[/C][C]0.003745[/C][C]0.0288[/C][C]0.488575[/C][/ROW]
[ROW][C]29[/C][C]0.047091[/C][C]0.3617[/C][C]0.35943[/C][/ROW]
[ROW][C]30[/C][C]-0.060748[/C][C]-0.4666[/C][C]0.321248[/C][/ROW]
[ROW][C]31[/C][C]0.034501[/C][C]0.265[/C][C]0.395965[/C][/ROW]
[ROW][C]32[/C][C]-0.001593[/C][C]-0.0122[/C][C]0.495138[/C][/ROW]
[ROW][C]33[/C][C]-0.066304[/C][C]-0.5093[/C][C]0.306223[/C][/ROW]
[ROW][C]34[/C][C]-0.013949[/C][C]-0.1071[/C][C]0.45752[/C][/ROW]
[ROW][C]35[/C][C]-0.027749[/C][C]-0.2131[/C][C]0.415974[/C][/ROW]
[ROW][C]36[/C][C]-0.014854[/C][C]-0.1141[/C][C]0.454775[/C][/ROW]
[/TABLE]
Source: https://freestatistics.org/blog/index.php?pk=31307&T=1

Globally Unique Identifier (entire table): ba.freestatistics.org/blog/index.php?pk=31307&T=1

As an alternative you can also use a QR Code:  

The GUIDs for individual cells are displayed in the table below:

Autocorrelation Function
Time lag kACF(k)T-STATP-value
1-0.009762-0.0750.470241
2-0.057552-0.44210.33003
30.2314551.77780.040292
40.1251470.96130.170169
5-0.178089-1.36790.088261
6-0.029416-0.2260.41101
70.0092110.07070.471919
8-0.137825-1.05870.147037
9-0.019731-0.15160.440026
100.0025150.01930.492327
110.0240640.18480.426995
12-0.117236-0.90050.185757
13-0.037451-0.28770.387304
14-0.00349-0.02680.489353
15-0.121418-0.93260.177406
16-0.205124-1.57560.060234
17-0.052062-0.39990.345339
180.0209360.16080.436395
19-0.132357-1.01670.156735
200.0751440.57720.283003
210.02430.18660.426288
220.099920.76750.222922
23-0.052606-0.40410.34381
24-0.042718-0.32810.371991
250.0852140.65450.257652
260.0222650.1710.432397
27-0.02879-0.22110.412875
280.0037450.02880.488575
290.0470910.36170.35943
30-0.060748-0.46660.321248
310.0345010.2650.395965
32-0.001593-0.01220.495138
33-0.066304-0.50930.306223
34-0.013949-0.10710.45752
35-0.027749-0.21310.415974
36-0.014854-0.11410.454775


Partial Autocorrelation Function
Time lag kPACF(k)T-STATP-value
1-0.009762-0.0750.470241
2-0.057652-0.44280.329752
30.2310881.7750.040526
40.1309451.00580.159308
5-0.160707-1.23440.110971
6-0.083086-0.63820.262908
7-0.067825-0.5210.302167
8-0.088895-0.68280.248698
90.0484120.37190.355664
10-0.000155-0.00120.499526
110.0741160.56930.285657
12-0.115937-0.89050.188399
13-0.093693-0.71970.237286
14-0.049035-0.37660.353894
15-0.108592-0.83410.203791
16-0.175083-1.34480.091913
17-0.081679-0.62740.266413
180.0393790.30250.381677
19-0.034627-0.2660.395593
200.1005470.77230.221505
21-0.060164-0.46210.322844
220.0851750.65420.257748
23-0.125158-0.96140.170148
24-0.173453-1.33230.09394
250.0331210.25440.400033
260.0412790.31710.376154
270.0706440.54260.294716
28-0.01749-0.13430.446795
29-0.063734-0.48950.313134
30-0.090422-0.69450.245032
31-0.080686-0.61980.2689
32-0.08691-0.66760.253506
33-0.076797-0.58990.278759
340.0148850.11430.454681
35-0.052173-0.40080.345025
360.0182950.14050.444362

\begin{tabular}{lllllllll}
\hline
Partial Autocorrelation Function \tabularnewline
Time lag k & PACF(k) & T-STAT & P-value \tabularnewline
1 & -0.009762 & -0.075 & 0.470241 \tabularnewline
2 & -0.057652 & -0.4428 & 0.329752 \tabularnewline
3 & 0.231088 & 1.775 & 0.040526 \tabularnewline
4 & 0.130945 & 1.0058 & 0.159308 \tabularnewline
5 & -0.160707 & -1.2344 & 0.110971 \tabularnewline
6 & -0.083086 & -0.6382 & 0.262908 \tabularnewline
7 & -0.067825 & -0.521 & 0.302167 \tabularnewline
8 & -0.088895 & -0.6828 & 0.248698 \tabularnewline
9 & 0.048412 & 0.3719 & 0.355664 \tabularnewline
10 & -0.000155 & -0.0012 & 0.499526 \tabularnewline
11 & 0.074116 & 0.5693 & 0.285657 \tabularnewline
12 & -0.115937 & -0.8905 & 0.188399 \tabularnewline
13 & -0.093693 & -0.7197 & 0.237286 \tabularnewline
14 & -0.049035 & -0.3766 & 0.353894 \tabularnewline
15 & -0.108592 & -0.8341 & 0.203791 \tabularnewline
16 & -0.175083 & -1.3448 & 0.091913 \tabularnewline
17 & -0.081679 & -0.6274 & 0.266413 \tabularnewline
18 & 0.039379 & 0.3025 & 0.381677 \tabularnewline
19 & -0.034627 & -0.266 & 0.395593 \tabularnewline
20 & 0.100547 & 0.7723 & 0.221505 \tabularnewline
21 & -0.060164 & -0.4621 & 0.322844 \tabularnewline
22 & 0.085175 & 0.6542 & 0.257748 \tabularnewline
23 & -0.125158 & -0.9614 & 0.170148 \tabularnewline
24 & -0.173453 & -1.3323 & 0.09394 \tabularnewline
25 & 0.033121 & 0.2544 & 0.400033 \tabularnewline
26 & 0.041279 & 0.3171 & 0.376154 \tabularnewline
27 & 0.070644 & 0.5426 & 0.294716 \tabularnewline
28 & -0.01749 & -0.1343 & 0.446795 \tabularnewline
29 & -0.063734 & -0.4895 & 0.313134 \tabularnewline
30 & -0.090422 & -0.6945 & 0.245032 \tabularnewline
31 & -0.080686 & -0.6198 & 0.2689 \tabularnewline
32 & -0.08691 & -0.6676 & 0.253506 \tabularnewline
33 & -0.076797 & -0.5899 & 0.278759 \tabularnewline
34 & 0.014885 & 0.1143 & 0.454681 \tabularnewline
35 & -0.052173 & -0.4008 & 0.345025 \tabularnewline
36 & 0.018295 & 0.1405 & 0.444362 \tabularnewline
\hline
\end{tabular}
%Source: https://freestatistics.org/blog/index.php?pk=31307&T=2

[TABLE]
[ROW][C]Partial Autocorrelation Function[/C][/ROW]
[ROW][C]Time lag k[/C][C]PACF(k)[/C][C]T-STAT[/C][C]P-value[/C][/ROW]
[ROW][C]1[/C][C]-0.009762[/C][C]-0.075[/C][C]0.470241[/C][/ROW]
[ROW][C]2[/C][C]-0.057652[/C][C]-0.4428[/C][C]0.329752[/C][/ROW]
[ROW][C]3[/C][C]0.231088[/C][C]1.775[/C][C]0.040526[/C][/ROW]
[ROW][C]4[/C][C]0.130945[/C][C]1.0058[/C][C]0.159308[/C][/ROW]
[ROW][C]5[/C][C]-0.160707[/C][C]-1.2344[/C][C]0.110971[/C][/ROW]
[ROW][C]6[/C][C]-0.083086[/C][C]-0.6382[/C][C]0.262908[/C][/ROW]
[ROW][C]7[/C][C]-0.067825[/C][C]-0.521[/C][C]0.302167[/C][/ROW]
[ROW][C]8[/C][C]-0.088895[/C][C]-0.6828[/C][C]0.248698[/C][/ROW]
[ROW][C]9[/C][C]0.048412[/C][C]0.3719[/C][C]0.355664[/C][/ROW]
[ROW][C]10[/C][C]-0.000155[/C][C]-0.0012[/C][C]0.499526[/C][/ROW]
[ROW][C]11[/C][C]0.074116[/C][C]0.5693[/C][C]0.285657[/C][/ROW]
[ROW][C]12[/C][C]-0.115937[/C][C]-0.8905[/C][C]0.188399[/C][/ROW]
[ROW][C]13[/C][C]-0.093693[/C][C]-0.7197[/C][C]0.237286[/C][/ROW]
[ROW][C]14[/C][C]-0.049035[/C][C]-0.3766[/C][C]0.353894[/C][/ROW]
[ROW][C]15[/C][C]-0.108592[/C][C]-0.8341[/C][C]0.203791[/C][/ROW]
[ROW][C]16[/C][C]-0.175083[/C][C]-1.3448[/C][C]0.091913[/C][/ROW]
[ROW][C]17[/C][C]-0.081679[/C][C]-0.6274[/C][C]0.266413[/C][/ROW]
[ROW][C]18[/C][C]0.039379[/C][C]0.3025[/C][C]0.381677[/C][/ROW]
[ROW][C]19[/C][C]-0.034627[/C][C]-0.266[/C][C]0.395593[/C][/ROW]
[ROW][C]20[/C][C]0.100547[/C][C]0.7723[/C][C]0.221505[/C][/ROW]
[ROW][C]21[/C][C]-0.060164[/C][C]-0.4621[/C][C]0.322844[/C][/ROW]
[ROW][C]22[/C][C]0.085175[/C][C]0.6542[/C][C]0.257748[/C][/ROW]
[ROW][C]23[/C][C]-0.125158[/C][C]-0.9614[/C][C]0.170148[/C][/ROW]
[ROW][C]24[/C][C]-0.173453[/C][C]-1.3323[/C][C]0.09394[/C][/ROW]
[ROW][C]25[/C][C]0.033121[/C][C]0.2544[/C][C]0.400033[/C][/ROW]
[ROW][C]26[/C][C]0.041279[/C][C]0.3171[/C][C]0.376154[/C][/ROW]
[ROW][C]27[/C][C]0.070644[/C][C]0.5426[/C][C]0.294716[/C][/ROW]
[ROW][C]28[/C][C]-0.01749[/C][C]-0.1343[/C][C]0.446795[/C][/ROW]
[ROW][C]29[/C][C]-0.063734[/C][C]-0.4895[/C][C]0.313134[/C][/ROW]
[ROW][C]30[/C][C]-0.090422[/C][C]-0.6945[/C][C]0.245032[/C][/ROW]
[ROW][C]31[/C][C]-0.080686[/C][C]-0.6198[/C][C]0.2689[/C][/ROW]
[ROW][C]32[/C][C]-0.08691[/C][C]-0.6676[/C][C]0.253506[/C][/ROW]
[ROW][C]33[/C][C]-0.076797[/C][C]-0.5899[/C][C]0.278759[/C][/ROW]
[ROW][C]34[/C][C]0.014885[/C][C]0.1143[/C][C]0.454681[/C][/ROW]
[ROW][C]35[/C][C]-0.052173[/C][C]-0.4008[/C][C]0.345025[/C][/ROW]
[ROW][C]36[/C][C]0.018295[/C][C]0.1405[/C][C]0.444362[/C][/ROW]
[/TABLE]
Source: https://freestatistics.org/blog/index.php?pk=31307&T=2

Globally Unique Identifier (entire table): ba.freestatistics.org/blog/index.php?pk=31307&T=2

As an alternative you can also use a QR Code:  

The GUIDs for individual cells are displayed in the table below:

Partial Autocorrelation Function
Time lag kPACF(k)T-STATP-value
1-0.009762-0.0750.470241
2-0.057652-0.44280.329752
30.2310881.7750.040526
40.1309451.00580.159308
5-0.160707-1.23440.110971
6-0.083086-0.63820.262908
7-0.067825-0.5210.302167
8-0.088895-0.68280.248698
90.0484120.37190.355664
10-0.000155-0.00120.499526
110.0741160.56930.285657
12-0.115937-0.89050.188399
13-0.093693-0.71970.237286
14-0.049035-0.37660.353894
15-0.108592-0.83410.203791
16-0.175083-1.34480.091913
17-0.081679-0.62740.266413
180.0393790.30250.381677
19-0.034627-0.2660.395593
200.1005470.77230.221505
21-0.060164-0.46210.322844
220.0851750.65420.257748
23-0.125158-0.96140.170148
24-0.173453-1.33230.09394
250.0331210.25440.400033
260.0412790.31710.376154
270.0706440.54260.294716
28-0.01749-0.13430.446795
29-0.063734-0.48950.313134
30-0.090422-0.69450.245032
31-0.080686-0.61980.2689
32-0.08691-0.66760.253506
33-0.076797-0.58990.278759
340.0148850.11430.454681
35-0.052173-0.40080.345025
360.0182950.14050.444362


Parameters (Session):
par1 = 36 ; par2 = -0.7 ; par3 = 1 ; par4 = 0 ; par5 = 12 ;
Parameters (R input):
par1 = 36 ; par2 = -0.7 ; par3 = 1 ; par4 = 0 ; par5 = 12 ;
R code (references can be found in the software module):
if (par1 == 'Default') {
par1 = 10*log10(length(x))
} else {
par1 <- as.numeric(par1)
}
par2 <- as.numeric(par2)
par3 <- as.numeric(par3)
par4 <- as.numeric(par4)
par5 <- as.numeric(par5)
if (par2 == 0) {
x <- log(x)
} else {
x <- (x ^ par2 - 1) / par2
}
if (par3 > 0) x <- diff(x,lag=1,difference=par3)
if (par4 > 0) x <- diff(x,lag=par5,difference=par4)
bitmap(file='pic1.png')
racf <- acf(x,par1,main='Autocorrelation',xlab='lags',ylab='ACF')
dev.off()
bitmap(file='pic2.png')
rpacf <- pacf(x,par1,main='Partial Autocorrelation',xlab='lags',ylab='PACF')
dev.off()
(myacf <- c(racf$acf))
(mypacf <- c(rpacf$acf))
lengthx <- length(x)
sqrtn <- sqrt(lengthx)
load(file='createtable')
a<-table.start()
a<-table.row.start(a)
a<-table.element(a,'Autocorrelation Function',4,TRUE)
a<-table.row.end(a)
a<-table.row.start(a)
a<-table.element(a,'Time lag k',header=TRUE)
a<-table.element(a,hyperlink('basics.htm','ACF(k)','click here for more information about the Autocorrelation Function'),header=TRUE)
a<-table.element(a,'T-STAT',header=TRUE)
a<-table.element(a,'P-value',header=TRUE)
a<-table.row.end(a)
for (i in 2:(par1+1)) {
a<-table.row.start(a)
a<-table.element(a,i-1,header=TRUE)
a<-table.element(a,round(myacf[i],6))
mytstat <- myacf[i]*sqrtn
a<-table.element(a,round(mytstat,4))
a<-table.element(a,round(1-pt(abs(mytstat),lengthx),6))
a<-table.row.end(a)
}
a<-table.end(a)
table.save(a,file='mytable.tab')
a<-table.start()
a<-table.row.start(a)
a<-table.element(a,'Partial Autocorrelation Function',4,TRUE)
a<-table.row.end(a)
a<-table.row.start(a)
a<-table.element(a,'Time lag k',header=TRUE)
a<-table.element(a,hyperlink('basics.htm','PACF(k)','click here for more information about the Partial Autocorrelation Function'),header=TRUE)
a<-table.element(a,'T-STAT',header=TRUE)
a<-table.element(a,'P-value',header=TRUE)
a<-table.row.end(a)
for (i in 1:par1) {
a<-table.row.start(a)
a<-table.element(a,i,header=TRUE)
a<-table.element(a,round(mypacf[i],6))
mytstat <- mypacf[i]*sqrtn
a<-table.element(a,round(mytstat,4))
a<-table.element(a,round(1-pt(abs(mytstat),lengthx),6))
a<-table.row.end(a)
}
a<-table.end(a)
table.save(a,file='mytable1.tab')