Free Statistics

of Irreproducible Research!

Author's title

Author*Unverified author*
R Software Modulerwasp_autocorrelation.wasp
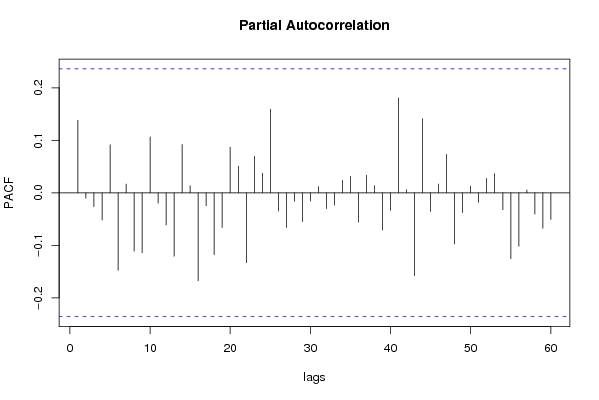
Title produced by software(Partial) Autocorrelation Function
Date of computationTue, 09 Dec 2008 03:18:02 -0700
Cite this page as followsStatistical Computations at FreeStatistics.org, Office for Research Development and Education, URL https://freestatistics.org/blog/index.php?v=date/2008/Dec/09/t1228818016bvqfcxezvvg7cnk.htm/, Retrieved Sun, 19 May 2024 11:39:44 +0000
Statistical Computations at FreeStatistics.org, Office for Research Development and Education, URL https://freestatistics.org/blog/index.php?pk=31255, Retrieved Sun, 19 May 2024 11:39:44 +0000
QR Codes:

Original text written by user:
IsPrivate?No (this computation is public)
User-defined keywords
Estimated Impact186
Family? (F = Feedback message, R = changed R code, M = changed R Module, P = changed Parameters, D = changed Data)
-     [Univariate Data Series] [data set] [2008-12-01 19:54:57] [b98453cac15ba1066b407e146608df68]
F RMPD  [Standard Deviation-Mean Plot] [W8Q1(2)] [2008-12-08 20:04:32] [74be16979710d4c4e7c6647856088456]
- RMPD      [(Partial) Autocorrelation Function] [W8Q2(2)] [2008-12-09 10:18:02] [434228f9e3c7eaa307f0fb12855e2147] [Current]
-   P         [(Partial) Autocorrelation Function] [W8Q2(2)] [2008-12-09 16:24:23] [74be16979710d4c4e7c6647856088456]
- RMP         [ARIMA Backward Selection] [W8Q5(2)] [2008-12-09 16:30:04] [74be16979710d4c4e7c6647856088456]
Feedback Forum

Post a new message
Dataseries X:
104.9
110.9
104.8
94.1
95.8
99.3
101.1
104
99
105.4
107.1
110.7
117.1
118.7
126.5
127.5
134.6
131.8
135.9
142.7
141.7
153.4
145
137.7
148.3
152.2
169.4
168.6
161.1
174.1
179
190.6
190
181.6
174.8
180.5
196.8
193.8
197
216.3
221.4
217.9
229.7
227.4
204.2
196.6
198.8
207.5
190.7
201.6
210.5
223.5
223.8
231.2
244
234.7
250.2
265.7
287.6
283.3
295.4
312.3
333.8
347.7
383.2
407.1
413.6
362.7
321.9
239.4


Summary of computational transaction
Raw Inputview raw input (R code)
Raw Outputview raw output of R engine
Computing time1 seconds
R Server'George Udny Yule' @ 72.249.76.132

\begin{tabular}{lllllllll}
\hline
Summary of computational transaction \tabularnewline
Raw Input & view raw input (R code)  \tabularnewline
Raw Output & view raw output of R engine  \tabularnewline
Computing time & 1 seconds \tabularnewline
R Server & 'George Udny Yule' @ 72.249.76.132 \tabularnewline
\hline
\end{tabular}
%Source: https://freestatistics.org/blog/index.php?pk=31255&T=0

[TABLE]
[ROW][C]Summary of computational transaction[/C][/ROW]
[ROW][C]Raw Input[/C][C]view raw input (R code) [/C][/ROW]
[ROW][C]Raw Output[/C][C]view raw output of R engine [/C][/ROW]
[ROW][C]Computing time[/C][C]1 seconds[/C][/ROW]
[ROW][C]R Server[/C][C]'George Udny Yule' @ 72.249.76.132[/C][/ROW]
[/TABLE]
Source: https://freestatistics.org/blog/index.php?pk=31255&T=0

Globally Unique Identifier (entire table): ba.freestatistics.org/blog/index.php?pk=31255&T=0

As an alternative you can also use a QR Code:  

The GUIDs for individual cells are displayed in the table below:

Summary of computational transaction
Raw Inputview raw input (R code)
Raw Outputview raw output of R engine
Computing time1 seconds
R Server'George Udny Yule' @ 72.249.76.132


Autocorrelation Function
Time lag kACF(k)T-STATP-value
10.13821.1480.127472
20.0089080.0740.470613
3-0.025862-0.21480.415267
4-0.058237-0.48370.315048
50.074260.61690.269681
6-0.119604-0.99350.161968
7-0.020526-0.17050.432558
8-0.106375-0.88360.189985
9-0.145235-1.20640.115889
100.0868580.72150.236521
11-0.005277-0.04380.482582
12-0.025076-0.20830.417806
13-0.131666-1.09370.138945
140.0377830.31390.37729
150.0874680.72660.234975
16-0.140299-1.16540.123933
17-0.034252-0.28450.388434
18-0.134317-1.11570.134206
19-0.074731-0.62080.2684
200.0891190.74030.230821
210.0770570.64010.262118
22-0.015926-0.13230.447569
23-0.017056-0.14170.443874
240.0586570.48720.313817
250.2461582.04470.022349
260.0468330.3890.349227
27-0.057704-0.47930.316613
28-0.045387-0.3770.35366
29-0.075892-0.63040.265257
30-0.017293-0.14360.443101
310.0080860.06720.473323
32-0.019368-0.16090.436329
33-0.08376-0.69580.244457
34-0.035327-0.29340.38503
350.1220391.01370.157126
360.0003030.00250.499001
37-0.001747-0.01450.494231
38-0.017882-0.14850.441175
39-0.058326-0.48450.314785
400.0134510.11170.455681
410.0831610.69080.246009
420.0574580.47730.317336
43-0.152481-1.26660.104778
440.0019640.01630.493515
450.0613770.50980.305896
460.1025850.85210.198543
470.0368770.30630.380139
48-0.092573-0.7690.222269
490.0225940.18770.425838
50-0.028386-0.23580.407145
51-0.016751-0.13910.444871
520.0637830.52980.298969
53-0.052774-0.43840.331243
54-0.070634-0.58670.279649
55-0.104776-0.87030.193567
56-0.032395-0.26910.39433
57-0.060393-0.50170.30875
58-0.081348-0.67570.250735
59-0.022371-0.18580.426563
60-0.057834-0.48040.31623

\begin{tabular}{lllllllll}
\hline
Autocorrelation Function \tabularnewline
Time lag k & ACF(k) & T-STAT & P-value \tabularnewline
1 & 0.1382 & 1.148 & 0.127472 \tabularnewline
2 & 0.008908 & 0.074 & 0.470613 \tabularnewline
3 & -0.025862 & -0.2148 & 0.415267 \tabularnewline
4 & -0.058237 & -0.4837 & 0.315048 \tabularnewline
5 & 0.07426 & 0.6169 & 0.269681 \tabularnewline
6 & -0.119604 & -0.9935 & 0.161968 \tabularnewline
7 & -0.020526 & -0.1705 & 0.432558 \tabularnewline
8 & -0.106375 & -0.8836 & 0.189985 \tabularnewline
9 & -0.145235 & -1.2064 & 0.115889 \tabularnewline
10 & 0.086858 & 0.7215 & 0.236521 \tabularnewline
11 & -0.005277 & -0.0438 & 0.482582 \tabularnewline
12 & -0.025076 & -0.2083 & 0.417806 \tabularnewline
13 & -0.131666 & -1.0937 & 0.138945 \tabularnewline
14 & 0.037783 & 0.3139 & 0.37729 \tabularnewline
15 & 0.087468 & 0.7266 & 0.234975 \tabularnewline
16 & -0.140299 & -1.1654 & 0.123933 \tabularnewline
17 & -0.034252 & -0.2845 & 0.388434 \tabularnewline
18 & -0.134317 & -1.1157 & 0.134206 \tabularnewline
19 & -0.074731 & -0.6208 & 0.2684 \tabularnewline
20 & 0.089119 & 0.7403 & 0.230821 \tabularnewline
21 & 0.077057 & 0.6401 & 0.262118 \tabularnewline
22 & -0.015926 & -0.1323 & 0.447569 \tabularnewline
23 & -0.017056 & -0.1417 & 0.443874 \tabularnewline
24 & 0.058657 & 0.4872 & 0.313817 \tabularnewline
25 & 0.246158 & 2.0447 & 0.022349 \tabularnewline
26 & 0.046833 & 0.389 & 0.349227 \tabularnewline
27 & -0.057704 & -0.4793 & 0.316613 \tabularnewline
28 & -0.045387 & -0.377 & 0.35366 \tabularnewline
29 & -0.075892 & -0.6304 & 0.265257 \tabularnewline
30 & -0.017293 & -0.1436 & 0.443101 \tabularnewline
31 & 0.008086 & 0.0672 & 0.473323 \tabularnewline
32 & -0.019368 & -0.1609 & 0.436329 \tabularnewline
33 & -0.08376 & -0.6958 & 0.244457 \tabularnewline
34 & -0.035327 & -0.2934 & 0.38503 \tabularnewline
35 & 0.122039 & 1.0137 & 0.157126 \tabularnewline
36 & 0.000303 & 0.0025 & 0.499001 \tabularnewline
37 & -0.001747 & -0.0145 & 0.494231 \tabularnewline
38 & -0.017882 & -0.1485 & 0.441175 \tabularnewline
39 & -0.058326 & -0.4845 & 0.314785 \tabularnewline
40 & 0.013451 & 0.1117 & 0.455681 \tabularnewline
41 & 0.083161 & 0.6908 & 0.246009 \tabularnewline
42 & 0.057458 & 0.4773 & 0.317336 \tabularnewline
43 & -0.152481 & -1.2666 & 0.104778 \tabularnewline
44 & 0.001964 & 0.0163 & 0.493515 \tabularnewline
45 & 0.061377 & 0.5098 & 0.305896 \tabularnewline
46 & 0.102585 & 0.8521 & 0.198543 \tabularnewline
47 & 0.036877 & 0.3063 & 0.380139 \tabularnewline
48 & -0.092573 & -0.769 & 0.222269 \tabularnewline
49 & 0.022594 & 0.1877 & 0.425838 \tabularnewline
50 & -0.028386 & -0.2358 & 0.407145 \tabularnewline
51 & -0.016751 & -0.1391 & 0.444871 \tabularnewline
52 & 0.063783 & 0.5298 & 0.298969 \tabularnewline
53 & -0.052774 & -0.4384 & 0.331243 \tabularnewline
54 & -0.070634 & -0.5867 & 0.279649 \tabularnewline
55 & -0.104776 & -0.8703 & 0.193567 \tabularnewline
56 & -0.032395 & -0.2691 & 0.39433 \tabularnewline
57 & -0.060393 & -0.5017 & 0.30875 \tabularnewline
58 & -0.081348 & -0.6757 & 0.250735 \tabularnewline
59 & -0.022371 & -0.1858 & 0.426563 \tabularnewline
60 & -0.057834 & -0.4804 & 0.31623 \tabularnewline
\hline
\end{tabular}
%Source: https://freestatistics.org/blog/index.php?pk=31255&T=1

[TABLE]
[ROW][C]Autocorrelation Function[/C][/ROW]
[ROW][C]Time lag k[/C][C]ACF(k)[/C][C]T-STAT[/C][C]P-value[/C][/ROW]
[ROW][C]1[/C][C]0.1382[/C][C]1.148[/C][C]0.127472[/C][/ROW]
[ROW][C]2[/C][C]0.008908[/C][C]0.074[/C][C]0.470613[/C][/ROW]
[ROW][C]3[/C][C]-0.025862[/C][C]-0.2148[/C][C]0.415267[/C][/ROW]
[ROW][C]4[/C][C]-0.058237[/C][C]-0.4837[/C][C]0.315048[/C][/ROW]
[ROW][C]5[/C][C]0.07426[/C][C]0.6169[/C][C]0.269681[/C][/ROW]
[ROW][C]6[/C][C]-0.119604[/C][C]-0.9935[/C][C]0.161968[/C][/ROW]
[ROW][C]7[/C][C]-0.020526[/C][C]-0.1705[/C][C]0.432558[/C][/ROW]
[ROW][C]8[/C][C]-0.106375[/C][C]-0.8836[/C][C]0.189985[/C][/ROW]
[ROW][C]9[/C][C]-0.145235[/C][C]-1.2064[/C][C]0.115889[/C][/ROW]
[ROW][C]10[/C][C]0.086858[/C][C]0.7215[/C][C]0.236521[/C][/ROW]
[ROW][C]11[/C][C]-0.005277[/C][C]-0.0438[/C][C]0.482582[/C][/ROW]
[ROW][C]12[/C][C]-0.025076[/C][C]-0.2083[/C][C]0.417806[/C][/ROW]
[ROW][C]13[/C][C]-0.131666[/C][C]-1.0937[/C][C]0.138945[/C][/ROW]
[ROW][C]14[/C][C]0.037783[/C][C]0.3139[/C][C]0.37729[/C][/ROW]
[ROW][C]15[/C][C]0.087468[/C][C]0.7266[/C][C]0.234975[/C][/ROW]
[ROW][C]16[/C][C]-0.140299[/C][C]-1.1654[/C][C]0.123933[/C][/ROW]
[ROW][C]17[/C][C]-0.034252[/C][C]-0.2845[/C][C]0.388434[/C][/ROW]
[ROW][C]18[/C][C]-0.134317[/C][C]-1.1157[/C][C]0.134206[/C][/ROW]
[ROW][C]19[/C][C]-0.074731[/C][C]-0.6208[/C][C]0.2684[/C][/ROW]
[ROW][C]20[/C][C]0.089119[/C][C]0.7403[/C][C]0.230821[/C][/ROW]
[ROW][C]21[/C][C]0.077057[/C][C]0.6401[/C][C]0.262118[/C][/ROW]
[ROW][C]22[/C][C]-0.015926[/C][C]-0.1323[/C][C]0.447569[/C][/ROW]
[ROW][C]23[/C][C]-0.017056[/C][C]-0.1417[/C][C]0.443874[/C][/ROW]
[ROW][C]24[/C][C]0.058657[/C][C]0.4872[/C][C]0.313817[/C][/ROW]
[ROW][C]25[/C][C]0.246158[/C][C]2.0447[/C][C]0.022349[/C][/ROW]
[ROW][C]26[/C][C]0.046833[/C][C]0.389[/C][C]0.349227[/C][/ROW]
[ROW][C]27[/C][C]-0.057704[/C][C]-0.4793[/C][C]0.316613[/C][/ROW]
[ROW][C]28[/C][C]-0.045387[/C][C]-0.377[/C][C]0.35366[/C][/ROW]
[ROW][C]29[/C][C]-0.075892[/C][C]-0.6304[/C][C]0.265257[/C][/ROW]
[ROW][C]30[/C][C]-0.017293[/C][C]-0.1436[/C][C]0.443101[/C][/ROW]
[ROW][C]31[/C][C]0.008086[/C][C]0.0672[/C][C]0.473323[/C][/ROW]
[ROW][C]32[/C][C]-0.019368[/C][C]-0.1609[/C][C]0.436329[/C][/ROW]
[ROW][C]33[/C][C]-0.08376[/C][C]-0.6958[/C][C]0.244457[/C][/ROW]
[ROW][C]34[/C][C]-0.035327[/C][C]-0.2934[/C][C]0.38503[/C][/ROW]
[ROW][C]35[/C][C]0.122039[/C][C]1.0137[/C][C]0.157126[/C][/ROW]
[ROW][C]36[/C][C]0.000303[/C][C]0.0025[/C][C]0.499001[/C][/ROW]
[ROW][C]37[/C][C]-0.001747[/C][C]-0.0145[/C][C]0.494231[/C][/ROW]
[ROW][C]38[/C][C]-0.017882[/C][C]-0.1485[/C][C]0.441175[/C][/ROW]
[ROW][C]39[/C][C]-0.058326[/C][C]-0.4845[/C][C]0.314785[/C][/ROW]
[ROW][C]40[/C][C]0.013451[/C][C]0.1117[/C][C]0.455681[/C][/ROW]
[ROW][C]41[/C][C]0.083161[/C][C]0.6908[/C][C]0.246009[/C][/ROW]
[ROW][C]42[/C][C]0.057458[/C][C]0.4773[/C][C]0.317336[/C][/ROW]
[ROW][C]43[/C][C]-0.152481[/C][C]-1.2666[/C][C]0.104778[/C][/ROW]
[ROW][C]44[/C][C]0.001964[/C][C]0.0163[/C][C]0.493515[/C][/ROW]
[ROW][C]45[/C][C]0.061377[/C][C]0.5098[/C][C]0.305896[/C][/ROW]
[ROW][C]46[/C][C]0.102585[/C][C]0.8521[/C][C]0.198543[/C][/ROW]
[ROW][C]47[/C][C]0.036877[/C][C]0.3063[/C][C]0.380139[/C][/ROW]
[ROW][C]48[/C][C]-0.092573[/C][C]-0.769[/C][C]0.222269[/C][/ROW]
[ROW][C]49[/C][C]0.022594[/C][C]0.1877[/C][C]0.425838[/C][/ROW]
[ROW][C]50[/C][C]-0.028386[/C][C]-0.2358[/C][C]0.407145[/C][/ROW]
[ROW][C]51[/C][C]-0.016751[/C][C]-0.1391[/C][C]0.444871[/C][/ROW]
[ROW][C]52[/C][C]0.063783[/C][C]0.5298[/C][C]0.298969[/C][/ROW]
[ROW][C]53[/C][C]-0.052774[/C][C]-0.4384[/C][C]0.331243[/C][/ROW]
[ROW][C]54[/C][C]-0.070634[/C][C]-0.5867[/C][C]0.279649[/C][/ROW]
[ROW][C]55[/C][C]-0.104776[/C][C]-0.8703[/C][C]0.193567[/C][/ROW]
[ROW][C]56[/C][C]-0.032395[/C][C]-0.2691[/C][C]0.39433[/C][/ROW]
[ROW][C]57[/C][C]-0.060393[/C][C]-0.5017[/C][C]0.30875[/C][/ROW]
[ROW][C]58[/C][C]-0.081348[/C][C]-0.6757[/C][C]0.250735[/C][/ROW]
[ROW][C]59[/C][C]-0.022371[/C][C]-0.1858[/C][C]0.426563[/C][/ROW]
[ROW][C]60[/C][C]-0.057834[/C][C]-0.4804[/C][C]0.31623[/C][/ROW]
[/TABLE]
Source: https://freestatistics.org/blog/index.php?pk=31255&T=1

Globally Unique Identifier (entire table): ba.freestatistics.org/blog/index.php?pk=31255&T=1

As an alternative you can also use a QR Code:  

The GUIDs for individual cells are displayed in the table below:

Autocorrelation Function
Time lag kACF(k)T-STATP-value
10.13821.1480.127472
20.0089080.0740.470613
3-0.025862-0.21480.415267
4-0.058237-0.48370.315048
50.074260.61690.269681
6-0.119604-0.99350.161968
7-0.020526-0.17050.432558
8-0.106375-0.88360.189985
9-0.145235-1.20640.115889
100.0868580.72150.236521
11-0.005277-0.04380.482582
12-0.025076-0.20830.417806
13-0.131666-1.09370.138945
140.0377830.31390.37729
150.0874680.72660.234975
16-0.140299-1.16540.123933
17-0.034252-0.28450.388434
18-0.134317-1.11570.134206
19-0.074731-0.62080.2684
200.0891190.74030.230821
210.0770570.64010.262118
22-0.015926-0.13230.447569
23-0.017056-0.14170.443874
240.0586570.48720.313817
250.2461582.04470.022349
260.0468330.3890.349227
27-0.057704-0.47930.316613
28-0.045387-0.3770.35366
29-0.075892-0.63040.265257
30-0.017293-0.14360.443101
310.0080860.06720.473323
32-0.019368-0.16090.436329
33-0.08376-0.69580.244457
34-0.035327-0.29340.38503
350.1220391.01370.157126
360.0003030.00250.499001
37-0.001747-0.01450.494231
38-0.017882-0.14850.441175
39-0.058326-0.48450.314785
400.0134510.11170.455681
410.0831610.69080.246009
420.0574580.47730.317336
43-0.152481-1.26660.104778
440.0019640.01630.493515
450.0613770.50980.305896
460.1025850.85210.198543
470.0368770.30630.380139
48-0.092573-0.7690.222269
490.0225940.18770.425838
50-0.028386-0.23580.407145
51-0.016751-0.13910.444871
520.0637830.52980.298969
53-0.052774-0.43840.331243
54-0.070634-0.58670.279649
55-0.104776-0.87030.193567
56-0.032395-0.26910.39433
57-0.060393-0.50170.30875
58-0.081348-0.67570.250735
59-0.022371-0.18580.426563
60-0.057834-0.48040.31623


Partial Autocorrelation Function
Time lag kPACF(k)T-STATP-value
10.13821.1480.127472
2-0.010389-0.08630.465739
3-0.026173-0.21740.414265
4-0.051989-0.43180.333599
50.0915290.76030.224834
6-0.147597-1.2260.112177
70.0166130.1380.445322
8-0.11127-0.92430.179282
9-0.114047-0.94730.173385
100.1065110.88470.189684
11-0.019736-0.16390.43513
12-0.061231-0.50860.306321
13-0.120805-1.00350.159566
140.0918270.76280.2241
150.0133850.11120.455897
16-0.16753-1.39160.084256
17-0.02459-0.20430.419374
18-0.117579-0.97670.166068
19-0.065981-0.54810.292704
200.0870060.72270.236147
210.0507660.42170.337278
22-0.133216-1.10660.13616
230.0697780.57960.282029
240.0370850.30810.379485
250.1592671.3230.095106
26-0.03485-0.28950.38654
27-0.066111-0.54920.292334
28-0.015978-0.13270.4474
29-0.054689-0.45430.325527
30-0.015675-0.13020.448392
310.0119520.09930.4606
32-0.030001-0.24920.401971
33-0.023256-0.19320.423693
340.0235820.19590.422638
350.0313940.26080.39752
36-0.055703-0.46270.322515
370.0333840.27730.391188
380.0136740.11360.454948
39-0.070837-0.58840.279086
40-0.033501-0.27830.390815
410.1805991.50020.069066
420.006010.04990.480164
43-0.157733-1.31020.097232
440.1410481.17160.122687
45-0.035434-0.29430.384692
460.0167420.13910.444901
470.0731260.60740.272781
48-0.097517-0.810.210351
49-0.037724-0.31340.377478
500.012660.10520.458275
51-0.018379-0.15270.439552
520.0274410.22790.410184
530.03660.3040.381014
54-0.032412-0.26920.394278
55-0.125623-1.04350.150178
56-0.101635-0.84420.200726
570.0055430.0460.481704
58-0.040599-0.33720.36848
59-0.067646-0.56190.287998
60-0.05066-0.42080.337601

\begin{tabular}{lllllllll}
\hline
Partial Autocorrelation Function \tabularnewline
Time lag k & PACF(k) & T-STAT & P-value \tabularnewline
1 & 0.1382 & 1.148 & 0.127472 \tabularnewline
2 & -0.010389 & -0.0863 & 0.465739 \tabularnewline
3 & -0.026173 & -0.2174 & 0.414265 \tabularnewline
4 & -0.051989 & -0.4318 & 0.333599 \tabularnewline
5 & 0.091529 & 0.7603 & 0.224834 \tabularnewline
6 & -0.147597 & -1.226 & 0.112177 \tabularnewline
7 & 0.016613 & 0.138 & 0.445322 \tabularnewline
8 & -0.11127 & -0.9243 & 0.179282 \tabularnewline
9 & -0.114047 & -0.9473 & 0.173385 \tabularnewline
10 & 0.106511 & 0.8847 & 0.189684 \tabularnewline
11 & -0.019736 & -0.1639 & 0.43513 \tabularnewline
12 & -0.061231 & -0.5086 & 0.306321 \tabularnewline
13 & -0.120805 & -1.0035 & 0.159566 \tabularnewline
14 & 0.091827 & 0.7628 & 0.2241 \tabularnewline
15 & 0.013385 & 0.1112 & 0.455897 \tabularnewline
16 & -0.16753 & -1.3916 & 0.084256 \tabularnewline
17 & -0.02459 & -0.2043 & 0.419374 \tabularnewline
18 & -0.117579 & -0.9767 & 0.166068 \tabularnewline
19 & -0.065981 & -0.5481 & 0.292704 \tabularnewline
20 & 0.087006 & 0.7227 & 0.236147 \tabularnewline
21 & 0.050766 & 0.4217 & 0.337278 \tabularnewline
22 & -0.133216 & -1.1066 & 0.13616 \tabularnewline
23 & 0.069778 & 0.5796 & 0.282029 \tabularnewline
24 & 0.037085 & 0.3081 & 0.379485 \tabularnewline
25 & 0.159267 & 1.323 & 0.095106 \tabularnewline
26 & -0.03485 & -0.2895 & 0.38654 \tabularnewline
27 & -0.066111 & -0.5492 & 0.292334 \tabularnewline
28 & -0.015978 & -0.1327 & 0.4474 \tabularnewline
29 & -0.054689 & -0.4543 & 0.325527 \tabularnewline
30 & -0.015675 & -0.1302 & 0.448392 \tabularnewline
31 & 0.011952 & 0.0993 & 0.4606 \tabularnewline
32 & -0.030001 & -0.2492 & 0.401971 \tabularnewline
33 & -0.023256 & -0.1932 & 0.423693 \tabularnewline
34 & 0.023582 & 0.1959 & 0.422638 \tabularnewline
35 & 0.031394 & 0.2608 & 0.39752 \tabularnewline
36 & -0.055703 & -0.4627 & 0.322515 \tabularnewline
37 & 0.033384 & 0.2773 & 0.391188 \tabularnewline
38 & 0.013674 & 0.1136 & 0.454948 \tabularnewline
39 & -0.070837 & -0.5884 & 0.279086 \tabularnewline
40 & -0.033501 & -0.2783 & 0.390815 \tabularnewline
41 & 0.180599 & 1.5002 & 0.069066 \tabularnewline
42 & 0.00601 & 0.0499 & 0.480164 \tabularnewline
43 & -0.157733 & -1.3102 & 0.097232 \tabularnewline
44 & 0.141048 & 1.1716 & 0.122687 \tabularnewline
45 & -0.035434 & -0.2943 & 0.384692 \tabularnewline
46 & 0.016742 & 0.1391 & 0.444901 \tabularnewline
47 & 0.073126 & 0.6074 & 0.272781 \tabularnewline
48 & -0.097517 & -0.81 & 0.210351 \tabularnewline
49 & -0.037724 & -0.3134 & 0.377478 \tabularnewline
50 & 0.01266 & 0.1052 & 0.458275 \tabularnewline
51 & -0.018379 & -0.1527 & 0.439552 \tabularnewline
52 & 0.027441 & 0.2279 & 0.410184 \tabularnewline
53 & 0.0366 & 0.304 & 0.381014 \tabularnewline
54 & -0.032412 & -0.2692 & 0.394278 \tabularnewline
55 & -0.125623 & -1.0435 & 0.150178 \tabularnewline
56 & -0.101635 & -0.8442 & 0.200726 \tabularnewline
57 & 0.005543 & 0.046 & 0.481704 \tabularnewline
58 & -0.040599 & -0.3372 & 0.36848 \tabularnewline
59 & -0.067646 & -0.5619 & 0.287998 \tabularnewline
60 & -0.05066 & -0.4208 & 0.337601 \tabularnewline
\hline
\end{tabular}
%Source: https://freestatistics.org/blog/index.php?pk=31255&T=2

[TABLE]
[ROW][C]Partial Autocorrelation Function[/C][/ROW]
[ROW][C]Time lag k[/C][C]PACF(k)[/C][C]T-STAT[/C][C]P-value[/C][/ROW]
[ROW][C]1[/C][C]0.1382[/C][C]1.148[/C][C]0.127472[/C][/ROW]
[ROW][C]2[/C][C]-0.010389[/C][C]-0.0863[/C][C]0.465739[/C][/ROW]
[ROW][C]3[/C][C]-0.026173[/C][C]-0.2174[/C][C]0.414265[/C][/ROW]
[ROW][C]4[/C][C]-0.051989[/C][C]-0.4318[/C][C]0.333599[/C][/ROW]
[ROW][C]5[/C][C]0.091529[/C][C]0.7603[/C][C]0.224834[/C][/ROW]
[ROW][C]6[/C][C]-0.147597[/C][C]-1.226[/C][C]0.112177[/C][/ROW]
[ROW][C]7[/C][C]0.016613[/C][C]0.138[/C][C]0.445322[/C][/ROW]
[ROW][C]8[/C][C]-0.11127[/C][C]-0.9243[/C][C]0.179282[/C][/ROW]
[ROW][C]9[/C][C]-0.114047[/C][C]-0.9473[/C][C]0.173385[/C][/ROW]
[ROW][C]10[/C][C]0.106511[/C][C]0.8847[/C][C]0.189684[/C][/ROW]
[ROW][C]11[/C][C]-0.019736[/C][C]-0.1639[/C][C]0.43513[/C][/ROW]
[ROW][C]12[/C][C]-0.061231[/C][C]-0.5086[/C][C]0.306321[/C][/ROW]
[ROW][C]13[/C][C]-0.120805[/C][C]-1.0035[/C][C]0.159566[/C][/ROW]
[ROW][C]14[/C][C]0.091827[/C][C]0.7628[/C][C]0.2241[/C][/ROW]
[ROW][C]15[/C][C]0.013385[/C][C]0.1112[/C][C]0.455897[/C][/ROW]
[ROW][C]16[/C][C]-0.16753[/C][C]-1.3916[/C][C]0.084256[/C][/ROW]
[ROW][C]17[/C][C]-0.02459[/C][C]-0.2043[/C][C]0.419374[/C][/ROW]
[ROW][C]18[/C][C]-0.117579[/C][C]-0.9767[/C][C]0.166068[/C][/ROW]
[ROW][C]19[/C][C]-0.065981[/C][C]-0.5481[/C][C]0.292704[/C][/ROW]
[ROW][C]20[/C][C]0.087006[/C][C]0.7227[/C][C]0.236147[/C][/ROW]
[ROW][C]21[/C][C]0.050766[/C][C]0.4217[/C][C]0.337278[/C][/ROW]
[ROW][C]22[/C][C]-0.133216[/C][C]-1.1066[/C][C]0.13616[/C][/ROW]
[ROW][C]23[/C][C]0.069778[/C][C]0.5796[/C][C]0.282029[/C][/ROW]
[ROW][C]24[/C][C]0.037085[/C][C]0.3081[/C][C]0.379485[/C][/ROW]
[ROW][C]25[/C][C]0.159267[/C][C]1.323[/C][C]0.095106[/C][/ROW]
[ROW][C]26[/C][C]-0.03485[/C][C]-0.2895[/C][C]0.38654[/C][/ROW]
[ROW][C]27[/C][C]-0.066111[/C][C]-0.5492[/C][C]0.292334[/C][/ROW]
[ROW][C]28[/C][C]-0.015978[/C][C]-0.1327[/C][C]0.4474[/C][/ROW]
[ROW][C]29[/C][C]-0.054689[/C][C]-0.4543[/C][C]0.325527[/C][/ROW]
[ROW][C]30[/C][C]-0.015675[/C][C]-0.1302[/C][C]0.448392[/C][/ROW]
[ROW][C]31[/C][C]0.011952[/C][C]0.0993[/C][C]0.4606[/C][/ROW]
[ROW][C]32[/C][C]-0.030001[/C][C]-0.2492[/C][C]0.401971[/C][/ROW]
[ROW][C]33[/C][C]-0.023256[/C][C]-0.1932[/C][C]0.423693[/C][/ROW]
[ROW][C]34[/C][C]0.023582[/C][C]0.1959[/C][C]0.422638[/C][/ROW]
[ROW][C]35[/C][C]0.031394[/C][C]0.2608[/C][C]0.39752[/C][/ROW]
[ROW][C]36[/C][C]-0.055703[/C][C]-0.4627[/C][C]0.322515[/C][/ROW]
[ROW][C]37[/C][C]0.033384[/C][C]0.2773[/C][C]0.391188[/C][/ROW]
[ROW][C]38[/C][C]0.013674[/C][C]0.1136[/C][C]0.454948[/C][/ROW]
[ROW][C]39[/C][C]-0.070837[/C][C]-0.5884[/C][C]0.279086[/C][/ROW]
[ROW][C]40[/C][C]-0.033501[/C][C]-0.2783[/C][C]0.390815[/C][/ROW]
[ROW][C]41[/C][C]0.180599[/C][C]1.5002[/C][C]0.069066[/C][/ROW]
[ROW][C]42[/C][C]0.00601[/C][C]0.0499[/C][C]0.480164[/C][/ROW]
[ROW][C]43[/C][C]-0.157733[/C][C]-1.3102[/C][C]0.097232[/C][/ROW]
[ROW][C]44[/C][C]0.141048[/C][C]1.1716[/C][C]0.122687[/C][/ROW]
[ROW][C]45[/C][C]-0.035434[/C][C]-0.2943[/C][C]0.384692[/C][/ROW]
[ROW][C]46[/C][C]0.016742[/C][C]0.1391[/C][C]0.444901[/C][/ROW]
[ROW][C]47[/C][C]0.073126[/C][C]0.6074[/C][C]0.272781[/C][/ROW]
[ROW][C]48[/C][C]-0.097517[/C][C]-0.81[/C][C]0.210351[/C][/ROW]
[ROW][C]49[/C][C]-0.037724[/C][C]-0.3134[/C][C]0.377478[/C][/ROW]
[ROW][C]50[/C][C]0.01266[/C][C]0.1052[/C][C]0.458275[/C][/ROW]
[ROW][C]51[/C][C]-0.018379[/C][C]-0.1527[/C][C]0.439552[/C][/ROW]
[ROW][C]52[/C][C]0.027441[/C][C]0.2279[/C][C]0.410184[/C][/ROW]
[ROW][C]53[/C][C]0.0366[/C][C]0.304[/C][C]0.381014[/C][/ROW]
[ROW][C]54[/C][C]-0.032412[/C][C]-0.2692[/C][C]0.394278[/C][/ROW]
[ROW][C]55[/C][C]-0.125623[/C][C]-1.0435[/C][C]0.150178[/C][/ROW]
[ROW][C]56[/C][C]-0.101635[/C][C]-0.8442[/C][C]0.200726[/C][/ROW]
[ROW][C]57[/C][C]0.005543[/C][C]0.046[/C][C]0.481704[/C][/ROW]
[ROW][C]58[/C][C]-0.040599[/C][C]-0.3372[/C][C]0.36848[/C][/ROW]
[ROW][C]59[/C][C]-0.067646[/C][C]-0.5619[/C][C]0.287998[/C][/ROW]
[ROW][C]60[/C][C]-0.05066[/C][C]-0.4208[/C][C]0.337601[/C][/ROW]
[/TABLE]
Source: https://freestatistics.org/blog/index.php?pk=31255&T=2

Globally Unique Identifier (entire table): ba.freestatistics.org/blog/index.php?pk=31255&T=2

As an alternative you can also use a QR Code:  

The GUIDs for individual cells are displayed in the table below:

Partial Autocorrelation Function
Time lag kPACF(k)T-STATP-value
10.13821.1480.127472
2-0.010389-0.08630.465739
3-0.026173-0.21740.414265
4-0.051989-0.43180.333599
50.0915290.76030.224834
6-0.147597-1.2260.112177
70.0166130.1380.445322
8-0.11127-0.92430.179282
9-0.114047-0.94730.173385
100.1065110.88470.189684
11-0.019736-0.16390.43513
12-0.061231-0.50860.306321
13-0.120805-1.00350.159566
140.0918270.76280.2241
150.0133850.11120.455897
16-0.16753-1.39160.084256
17-0.02459-0.20430.419374
18-0.117579-0.97670.166068
19-0.065981-0.54810.292704
200.0870060.72270.236147
210.0507660.42170.337278
22-0.133216-1.10660.13616
230.0697780.57960.282029
240.0370850.30810.379485
250.1592671.3230.095106
26-0.03485-0.28950.38654
27-0.066111-0.54920.292334
28-0.015978-0.13270.4474
29-0.054689-0.45430.325527
30-0.015675-0.13020.448392
310.0119520.09930.4606
32-0.030001-0.24920.401971
33-0.023256-0.19320.423693
340.0235820.19590.422638
350.0313940.26080.39752
36-0.055703-0.46270.322515
370.0333840.27730.391188
380.0136740.11360.454948
39-0.070837-0.58840.279086
40-0.033501-0.27830.390815
410.1805991.50020.069066
420.006010.04990.480164
43-0.157733-1.31020.097232
440.1410481.17160.122687
45-0.035434-0.29430.384692
460.0167420.13910.444901
470.0731260.60740.272781
48-0.097517-0.810.210351
49-0.037724-0.31340.377478
500.012660.10520.458275
51-0.018379-0.15270.439552
520.0274410.22790.410184
530.03660.3040.381014
54-0.032412-0.26920.394278
55-0.125623-1.04350.150178
56-0.101635-0.84420.200726
570.0055430.0460.481704
58-0.040599-0.33720.36848
59-0.067646-0.56190.287998
60-0.05066-0.42080.337601


Parameters (Session):
par1 = 60 ; par2 = -0.5 ; par3 = 1 ; par4 = 0 ; par5 = 12 ;
Parameters (R input):
par1 = 60 ; par2 = -0.5 ; par3 = 1 ; par4 = 0 ; par5 = 12 ;
R code (references can be found in the software module):
if (par1 == 'Default') {
par1 = 10*log10(length(x))
} else {
par1 <- as.numeric(par1)
}
par2 <- as.numeric(par2)
par3 <- as.numeric(par3)
par4 <- as.numeric(par4)
par5 <- as.numeric(par5)
if (par2 == 0) {
x <- log(x)
} else {
x <- (x ^ par2 - 1) / par2
}
if (par3 > 0) x <- diff(x,lag=1,difference=par3)
if (par4 > 0) x <- diff(x,lag=par5,difference=par4)
bitmap(file='pic1.png')
racf <- acf(x,par1,main='Autocorrelation',xlab='lags',ylab='ACF')
dev.off()
bitmap(file='pic2.png')
rpacf <- pacf(x,par1,main='Partial Autocorrelation',xlab='lags',ylab='PACF')
dev.off()
(myacf <- c(racf$acf))
(mypacf <- c(rpacf$acf))
lengthx <- length(x)
sqrtn <- sqrt(lengthx)
load(file='createtable')
a<-table.start()
a<-table.row.start(a)
a<-table.element(a,'Autocorrelation Function',4,TRUE)
a<-table.row.end(a)
a<-table.row.start(a)
a<-table.element(a,'Time lag k',header=TRUE)
a<-table.element(a,hyperlink('basics.htm','ACF(k)','click here for more information about the Autocorrelation Function'),header=TRUE)
a<-table.element(a,'T-STAT',header=TRUE)
a<-table.element(a,'P-value',header=TRUE)
a<-table.row.end(a)
for (i in 2:(par1+1)) {
a<-table.row.start(a)
a<-table.element(a,i-1,header=TRUE)
a<-table.element(a,round(myacf[i],6))
mytstat <- myacf[i]*sqrtn
a<-table.element(a,round(mytstat,4))
a<-table.element(a,round(1-pt(abs(mytstat),lengthx),6))
a<-table.row.end(a)
}
a<-table.end(a)
table.save(a,file='mytable.tab')
a<-table.start()
a<-table.row.start(a)
a<-table.element(a,'Partial Autocorrelation Function',4,TRUE)
a<-table.row.end(a)
a<-table.row.start(a)
a<-table.element(a,'Time lag k',header=TRUE)
a<-table.element(a,hyperlink('basics.htm','PACF(k)','click here for more information about the Partial Autocorrelation Function'),header=TRUE)
a<-table.element(a,'T-STAT',header=TRUE)
a<-table.element(a,'P-value',header=TRUE)
a<-table.row.end(a)
for (i in 1:par1) {
a<-table.row.start(a)
a<-table.element(a,i,header=TRUE)
a<-table.element(a,round(mypacf[i],6))
mytstat <- mypacf[i]*sqrtn
a<-table.element(a,round(mytstat,4))
a<-table.element(a,round(1-pt(abs(mytstat),lengthx),6))
a<-table.row.end(a)
}
a<-table.end(a)
table.save(a,file='mytable1.tab')