Free Statistics

of Irreproducible Research!

Author's title

Author*Unverified author*
R Software Modulerwasp_autocorrelation.wasp
Title produced by software(Partial) Autocorrelation Function
Date of computationTue, 09 Dec 2008 02:49:41 -0700
Cite this page as followsStatistical Computations at FreeStatistics.org, Office for Research Development and Education, URL https://freestatistics.org/blog/index.php?v=date/2008/Dec/09/t1228816232dlniui01j7dzyv8.htm/, Retrieved Sun, 19 May 2024 12:03:34 +0000
Statistical Computations at FreeStatistics.org, Office for Research Development and Education, URL https://freestatistics.org/blog/index.php?pk=31236, Retrieved Sun, 19 May 2024 12:03:34 +0000
QR Codes:

Original text written by user:
IsPrivate?No (this computation is public)
User-defined keywords
Estimated Impact160
Family? (F = Feedback message, R = changed R code, M = changed R Module, P = changed Parameters, D = changed Data)
-     [(Partial) Autocorrelation Function] [6bis oef 2 stap 1...] [2008-12-09 09:46:40] [c856c407fba4e5cac6611e01b62a9c0b]
-   P     [(Partial) Autocorrelation Function] [6bis oef 2 stap 2...] [2008-12-09 09:49:41] [aa953cee67007b6ac752bcbbd195d3a5] [Current]
Feedback Forum

Post a new message
Dataseries X:
9.026
9.787
9.536
9.490
9.736
9.694
9.647
9.753
10.070
10.137
9.984
9.732
9.103
9.155
9.308
9.394
9.948
10.177
10.002
9.728
10.002
10.063
10.018
9.960
10.236
10.893
10.756
10.940
10.997
10.827
10.166
10.186
10.457
10.368
10.244
10.511
10.812
10.738
10.171
9.721
9.897
9.828
9.924
10.371
10.846
10.413
10.709
10.662
10.570
10.297
10.635
10.872
10.296
10.383
10.431
10.574
10.653
10.805
10.872
10.625
10.407
10.463
10.556
10.646
10.702
11.353
11.346
11.451
11.964
12.574
13.031
13.812
14.544
14.931
14.886
16.005
17.064
15.168
16.050
15.839
15.137
14.954
15.648
15.305


Summary of computational transaction
Raw Inputview raw input (R code)
Raw Outputview raw output of R engine
Computing time2 seconds
R Server'Sir Ronald Aylmer Fisher' @ 193.190.124.24

\begin{tabular}{lllllllll}
\hline
Summary of computational transaction \tabularnewline
Raw Input & view raw input (R code)  \tabularnewline
Raw Output & view raw output of R engine  \tabularnewline
Computing time & 2 seconds \tabularnewline
R Server & 'Sir Ronald Aylmer Fisher' @ 193.190.124.24 \tabularnewline
\hline
\end{tabular}
%Source: https://freestatistics.org/blog/index.php?pk=31236&T=0

[TABLE]
[ROW][C]Summary of computational transaction[/C][/ROW]
[ROW][C]Raw Input[/C][C]view raw input (R code) [/C][/ROW]
[ROW][C]Raw Output[/C][C]view raw output of R engine [/C][/ROW]
[ROW][C]Computing time[/C][C]2 seconds[/C][/ROW]
[ROW][C]R Server[/C][C]'Sir Ronald Aylmer Fisher' @ 193.190.124.24[/C][/ROW]
[/TABLE]
Source: https://freestatistics.org/blog/index.php?pk=31236&T=0

Globally Unique Identifier (entire table): ba.freestatistics.org/blog/index.php?pk=31236&T=0

As an alternative you can also use a QR Code:  

The GUIDs for individual cells are displayed in the table below:

Summary of computational transaction
Raw Inputview raw input (R code)
Raw Outputview raw output of R engine
Computing time2 seconds
R Server'Sir Ronald Aylmer Fisher' @ 193.190.124.24


Autocorrelation Function
Time lag kACF(k)T-STATP-value
1-0.069173-0.63020.26515
2-0.101596-0.92560.178672
30.2674512.43660.008482
40.0987690.89980.185407
5-0.258657-2.35650.010403
60.0237230.21610.414709
70.1713551.56110.06115
8-0.027287-0.24860.402143
9-0.079767-0.72670.234725
100.014490.1320.447648
110.0386880.35250.362693
12-0.132334-1.20560.115694
13-0.087283-0.79520.214387
14-0.060347-0.54980.291971
150.006370.0580.476932
16-0.073964-0.67380.251142
17-0.004257-0.03880.484577
180.0357870.3260.372608
190.0779860.71050.239698
20-0.027616-0.25160.400989
210.0411110.37450.35448
22-0.003746-0.03410.486429
23-0.079229-0.72180.23622
24-0.058984-0.53740.296226
250.0944230.86020.19607
26-0.009405-0.08570.465962
27-0.015354-0.13990.444548
280.1057480.96340.169069
290.0149610.13630.445957
30-0.051963-0.47340.318582
31-0.060994-0.55570.289962
320.063390.57750.282579
33-0.096542-0.87950.190824
34-0.069104-0.62960.265352
350.0002990.00270.498917
360.0003460.00320.498746
37-0.150032-1.36690.087681
38-0.01327-0.12090.452032
390.0247560.22550.411056
400.0313130.28530.38807
41-0.035512-0.32350.373555
42-0.004736-0.04310.482844
430.0293520.26740.394909
44-0.028724-0.26170.397107
45-0.065845-0.59990.27511
46-0.014782-0.13470.446599
470.1189041.08330.140914
48-0.005262-0.04790.48094

\begin{tabular}{lllllllll}
\hline
Autocorrelation Function \tabularnewline
Time lag k & ACF(k) & T-STAT & P-value \tabularnewline
1 & -0.069173 & -0.6302 & 0.26515 \tabularnewline
2 & -0.101596 & -0.9256 & 0.178672 \tabularnewline
3 & 0.267451 & 2.4366 & 0.008482 \tabularnewline
4 & 0.098769 & 0.8998 & 0.185407 \tabularnewline
5 & -0.258657 & -2.3565 & 0.010403 \tabularnewline
6 & 0.023723 & 0.2161 & 0.414709 \tabularnewline
7 & 0.171355 & 1.5611 & 0.06115 \tabularnewline
8 & -0.027287 & -0.2486 & 0.402143 \tabularnewline
9 & -0.079767 & -0.7267 & 0.234725 \tabularnewline
10 & 0.01449 & 0.132 & 0.447648 \tabularnewline
11 & 0.038688 & 0.3525 & 0.362693 \tabularnewline
12 & -0.132334 & -1.2056 & 0.115694 \tabularnewline
13 & -0.087283 & -0.7952 & 0.214387 \tabularnewline
14 & -0.060347 & -0.5498 & 0.291971 \tabularnewline
15 & 0.00637 & 0.058 & 0.476932 \tabularnewline
16 & -0.073964 & -0.6738 & 0.251142 \tabularnewline
17 & -0.004257 & -0.0388 & 0.484577 \tabularnewline
18 & 0.035787 & 0.326 & 0.372608 \tabularnewline
19 & 0.077986 & 0.7105 & 0.239698 \tabularnewline
20 & -0.027616 & -0.2516 & 0.400989 \tabularnewline
21 & 0.041111 & 0.3745 & 0.35448 \tabularnewline
22 & -0.003746 & -0.0341 & 0.486429 \tabularnewline
23 & -0.079229 & -0.7218 & 0.23622 \tabularnewline
24 & -0.058984 & -0.5374 & 0.296226 \tabularnewline
25 & 0.094423 & 0.8602 & 0.19607 \tabularnewline
26 & -0.009405 & -0.0857 & 0.465962 \tabularnewline
27 & -0.015354 & -0.1399 & 0.444548 \tabularnewline
28 & 0.105748 & 0.9634 & 0.169069 \tabularnewline
29 & 0.014961 & 0.1363 & 0.445957 \tabularnewline
30 & -0.051963 & -0.4734 & 0.318582 \tabularnewline
31 & -0.060994 & -0.5557 & 0.289962 \tabularnewline
32 & 0.06339 & 0.5775 & 0.282579 \tabularnewline
33 & -0.096542 & -0.8795 & 0.190824 \tabularnewline
34 & -0.069104 & -0.6296 & 0.265352 \tabularnewline
35 & 0.000299 & 0.0027 & 0.498917 \tabularnewline
36 & 0.000346 & 0.0032 & 0.498746 \tabularnewline
37 & -0.150032 & -1.3669 & 0.087681 \tabularnewline
38 & -0.01327 & -0.1209 & 0.452032 \tabularnewline
39 & 0.024756 & 0.2255 & 0.411056 \tabularnewline
40 & 0.031313 & 0.2853 & 0.38807 \tabularnewline
41 & -0.035512 & -0.3235 & 0.373555 \tabularnewline
42 & -0.004736 & -0.0431 & 0.482844 \tabularnewline
43 & 0.029352 & 0.2674 & 0.394909 \tabularnewline
44 & -0.028724 & -0.2617 & 0.397107 \tabularnewline
45 & -0.065845 & -0.5999 & 0.27511 \tabularnewline
46 & -0.014782 & -0.1347 & 0.446599 \tabularnewline
47 & 0.118904 & 1.0833 & 0.140914 \tabularnewline
48 & -0.005262 & -0.0479 & 0.48094 \tabularnewline
\hline
\end{tabular}
%Source: https://freestatistics.org/blog/index.php?pk=31236&T=1

[TABLE]
[ROW][C]Autocorrelation Function[/C][/ROW]
[ROW][C]Time lag k[/C][C]ACF(k)[/C][C]T-STAT[/C][C]P-value[/C][/ROW]
[ROW][C]1[/C][C]-0.069173[/C][C]-0.6302[/C][C]0.26515[/C][/ROW]
[ROW][C]2[/C][C]-0.101596[/C][C]-0.9256[/C][C]0.178672[/C][/ROW]
[ROW][C]3[/C][C]0.267451[/C][C]2.4366[/C][C]0.008482[/C][/ROW]
[ROW][C]4[/C][C]0.098769[/C][C]0.8998[/C][C]0.185407[/C][/ROW]
[ROW][C]5[/C][C]-0.258657[/C][C]-2.3565[/C][C]0.010403[/C][/ROW]
[ROW][C]6[/C][C]0.023723[/C][C]0.2161[/C][C]0.414709[/C][/ROW]
[ROW][C]7[/C][C]0.171355[/C][C]1.5611[/C][C]0.06115[/C][/ROW]
[ROW][C]8[/C][C]-0.027287[/C][C]-0.2486[/C][C]0.402143[/C][/ROW]
[ROW][C]9[/C][C]-0.079767[/C][C]-0.7267[/C][C]0.234725[/C][/ROW]
[ROW][C]10[/C][C]0.01449[/C][C]0.132[/C][C]0.447648[/C][/ROW]
[ROW][C]11[/C][C]0.038688[/C][C]0.3525[/C][C]0.362693[/C][/ROW]
[ROW][C]12[/C][C]-0.132334[/C][C]-1.2056[/C][C]0.115694[/C][/ROW]
[ROW][C]13[/C][C]-0.087283[/C][C]-0.7952[/C][C]0.214387[/C][/ROW]
[ROW][C]14[/C][C]-0.060347[/C][C]-0.5498[/C][C]0.291971[/C][/ROW]
[ROW][C]15[/C][C]0.00637[/C][C]0.058[/C][C]0.476932[/C][/ROW]
[ROW][C]16[/C][C]-0.073964[/C][C]-0.6738[/C][C]0.251142[/C][/ROW]
[ROW][C]17[/C][C]-0.004257[/C][C]-0.0388[/C][C]0.484577[/C][/ROW]
[ROW][C]18[/C][C]0.035787[/C][C]0.326[/C][C]0.372608[/C][/ROW]
[ROW][C]19[/C][C]0.077986[/C][C]0.7105[/C][C]0.239698[/C][/ROW]
[ROW][C]20[/C][C]-0.027616[/C][C]-0.2516[/C][C]0.400989[/C][/ROW]
[ROW][C]21[/C][C]0.041111[/C][C]0.3745[/C][C]0.35448[/C][/ROW]
[ROW][C]22[/C][C]-0.003746[/C][C]-0.0341[/C][C]0.486429[/C][/ROW]
[ROW][C]23[/C][C]-0.079229[/C][C]-0.7218[/C][C]0.23622[/C][/ROW]
[ROW][C]24[/C][C]-0.058984[/C][C]-0.5374[/C][C]0.296226[/C][/ROW]
[ROW][C]25[/C][C]0.094423[/C][C]0.8602[/C][C]0.19607[/C][/ROW]
[ROW][C]26[/C][C]-0.009405[/C][C]-0.0857[/C][C]0.465962[/C][/ROW]
[ROW][C]27[/C][C]-0.015354[/C][C]-0.1399[/C][C]0.444548[/C][/ROW]
[ROW][C]28[/C][C]0.105748[/C][C]0.9634[/C][C]0.169069[/C][/ROW]
[ROW][C]29[/C][C]0.014961[/C][C]0.1363[/C][C]0.445957[/C][/ROW]
[ROW][C]30[/C][C]-0.051963[/C][C]-0.4734[/C][C]0.318582[/C][/ROW]
[ROW][C]31[/C][C]-0.060994[/C][C]-0.5557[/C][C]0.289962[/C][/ROW]
[ROW][C]32[/C][C]0.06339[/C][C]0.5775[/C][C]0.282579[/C][/ROW]
[ROW][C]33[/C][C]-0.096542[/C][C]-0.8795[/C][C]0.190824[/C][/ROW]
[ROW][C]34[/C][C]-0.069104[/C][C]-0.6296[/C][C]0.265352[/C][/ROW]
[ROW][C]35[/C][C]0.000299[/C][C]0.0027[/C][C]0.498917[/C][/ROW]
[ROW][C]36[/C][C]0.000346[/C][C]0.0032[/C][C]0.498746[/C][/ROW]
[ROW][C]37[/C][C]-0.150032[/C][C]-1.3669[/C][C]0.087681[/C][/ROW]
[ROW][C]38[/C][C]-0.01327[/C][C]-0.1209[/C][C]0.452032[/C][/ROW]
[ROW][C]39[/C][C]0.024756[/C][C]0.2255[/C][C]0.411056[/C][/ROW]
[ROW][C]40[/C][C]0.031313[/C][C]0.2853[/C][C]0.38807[/C][/ROW]
[ROW][C]41[/C][C]-0.035512[/C][C]-0.3235[/C][C]0.373555[/C][/ROW]
[ROW][C]42[/C][C]-0.004736[/C][C]-0.0431[/C][C]0.482844[/C][/ROW]
[ROW][C]43[/C][C]0.029352[/C][C]0.2674[/C][C]0.394909[/C][/ROW]
[ROW][C]44[/C][C]-0.028724[/C][C]-0.2617[/C][C]0.397107[/C][/ROW]
[ROW][C]45[/C][C]-0.065845[/C][C]-0.5999[/C][C]0.27511[/C][/ROW]
[ROW][C]46[/C][C]-0.014782[/C][C]-0.1347[/C][C]0.446599[/C][/ROW]
[ROW][C]47[/C][C]0.118904[/C][C]1.0833[/C][C]0.140914[/C][/ROW]
[ROW][C]48[/C][C]-0.005262[/C][C]-0.0479[/C][C]0.48094[/C][/ROW]
[/TABLE]
Source: https://freestatistics.org/blog/index.php?pk=31236&T=1

Globally Unique Identifier (entire table): ba.freestatistics.org/blog/index.php?pk=31236&T=1

As an alternative you can also use a QR Code:  

The GUIDs for individual cells are displayed in the table below:

Autocorrelation Function
Time lag kACF(k)T-STATP-value
1-0.069173-0.63020.26515
2-0.101596-0.92560.178672
30.2674512.43660.008482
40.0987690.89980.185407
5-0.258657-2.35650.010403
60.0237230.21610.414709
70.1713551.56110.06115
8-0.027287-0.24860.402143
9-0.079767-0.72670.234725
100.014490.1320.447648
110.0386880.35250.362693
12-0.132334-1.20560.115694
13-0.087283-0.79520.214387
14-0.060347-0.54980.291971
150.006370.0580.476932
16-0.073964-0.67380.251142
17-0.004257-0.03880.484577
180.0357870.3260.372608
190.0779860.71050.239698
20-0.027616-0.25160.400989
210.0411110.37450.35448
22-0.003746-0.03410.486429
23-0.079229-0.72180.23622
24-0.058984-0.53740.296226
250.0944230.86020.19607
26-0.009405-0.08570.465962
27-0.015354-0.13990.444548
280.1057480.96340.169069
290.0149610.13630.445957
30-0.051963-0.47340.318582
31-0.060994-0.55570.289962
320.063390.57750.282579
33-0.096542-0.87950.190824
34-0.069104-0.62960.265352
350.0002990.00270.498917
360.0003460.00320.498746
37-0.150032-1.36690.087681
38-0.01327-0.12090.452032
390.0247560.22550.411056
400.0313130.28530.38807
41-0.035512-0.32350.373555
42-0.004736-0.04310.482844
430.0293520.26740.394909
44-0.028724-0.26170.397107
45-0.065845-0.59990.27511
46-0.014782-0.13470.446599
470.1189041.08330.140914
48-0.005262-0.04790.48094


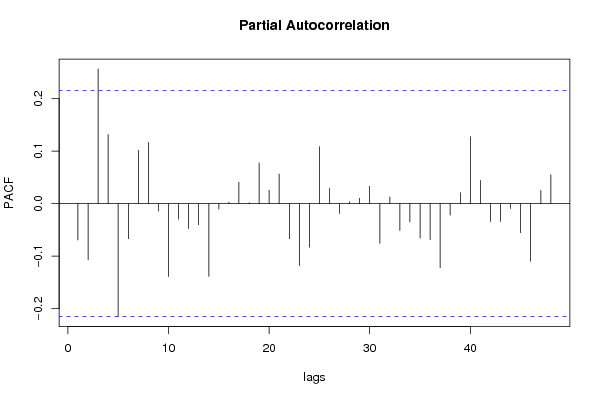
Partial Autocorrelation Function
Time lag kPACF(k)T-STATP-value
1-0.069173-0.63020.26515
2-0.106893-0.97380.166483
30.256422.33610.010949
40.1314131.19720.117313
5-0.215221-1.96080.026631
6-0.067082-0.61110.271387
70.1015610.92530.178754
80.116551.06180.145698
9-0.01423-0.12960.448582
10-0.138792-1.26450.104803
11-0.029598-0.26960.39405
12-0.047451-0.43230.333321
13-0.0401-0.36530.357899
14-0.138502-1.26180.105274
15-0.010148-0.09250.46328
160.0024870.02270.490987
170.0407830.37160.355586
180.0015370.0140.49443
190.0772480.70380.241775
200.0256360.23360.407952
210.0562660.51260.304794
22-0.067007-0.61050.271611
23-0.118063-1.07560.14261
24-0.082927-0.75550.226045
250.1082910.98660.163359
260.0286950.26140.397205
27-0.018409-0.16770.43361
280.0034450.03140.487518
290.0099940.09110.463835
300.0328930.29970.38259
31-0.075405-0.6870.247007
320.0128130.11670.453678
33-0.050953-0.46420.32186
34-0.034816-0.31720.375949
35-0.065368-0.59550.276555
36-0.068409-0.62320.267419
37-0.121941-1.11090.134902
38-0.021827-0.19890.421433
390.0208610.19010.424867
400.1273471.16020.12465
410.0440220.40110.344703
42-0.03395-0.30930.378935
43-0.033556-0.30570.380294
44-0.009205-0.08390.466686
45-0.055297-0.50380.307875
46-0.109703-0.99940.160242
470.0251210.22890.409771
480.0548870.50.309185

\begin{tabular}{lllllllll}
\hline
Partial Autocorrelation Function \tabularnewline
Time lag k & PACF(k) & T-STAT & P-value \tabularnewline
1 & -0.069173 & -0.6302 & 0.26515 \tabularnewline
2 & -0.106893 & -0.9738 & 0.166483 \tabularnewline
3 & 0.25642 & 2.3361 & 0.010949 \tabularnewline
4 & 0.131413 & 1.1972 & 0.117313 \tabularnewline
5 & -0.215221 & -1.9608 & 0.026631 \tabularnewline
6 & -0.067082 & -0.6111 & 0.271387 \tabularnewline
7 & 0.101561 & 0.9253 & 0.178754 \tabularnewline
8 & 0.11655 & 1.0618 & 0.145698 \tabularnewline
9 & -0.01423 & -0.1296 & 0.448582 \tabularnewline
10 & -0.138792 & -1.2645 & 0.104803 \tabularnewline
11 & -0.029598 & -0.2696 & 0.39405 \tabularnewline
12 & -0.047451 & -0.4323 & 0.333321 \tabularnewline
13 & -0.0401 & -0.3653 & 0.357899 \tabularnewline
14 & -0.138502 & -1.2618 & 0.105274 \tabularnewline
15 & -0.010148 & -0.0925 & 0.46328 \tabularnewline
16 & 0.002487 & 0.0227 & 0.490987 \tabularnewline
17 & 0.040783 & 0.3716 & 0.355586 \tabularnewline
18 & 0.001537 & 0.014 & 0.49443 \tabularnewline
19 & 0.077248 & 0.7038 & 0.241775 \tabularnewline
20 & 0.025636 & 0.2336 & 0.407952 \tabularnewline
21 & 0.056266 & 0.5126 & 0.304794 \tabularnewline
22 & -0.067007 & -0.6105 & 0.271611 \tabularnewline
23 & -0.118063 & -1.0756 & 0.14261 \tabularnewline
24 & -0.082927 & -0.7555 & 0.226045 \tabularnewline
25 & 0.108291 & 0.9866 & 0.163359 \tabularnewline
26 & 0.028695 & 0.2614 & 0.397205 \tabularnewline
27 & -0.018409 & -0.1677 & 0.43361 \tabularnewline
28 & 0.003445 & 0.0314 & 0.487518 \tabularnewline
29 & 0.009994 & 0.0911 & 0.463835 \tabularnewline
30 & 0.032893 & 0.2997 & 0.38259 \tabularnewline
31 & -0.075405 & -0.687 & 0.247007 \tabularnewline
32 & 0.012813 & 0.1167 & 0.453678 \tabularnewline
33 & -0.050953 & -0.4642 & 0.32186 \tabularnewline
34 & -0.034816 & -0.3172 & 0.375949 \tabularnewline
35 & -0.065368 & -0.5955 & 0.276555 \tabularnewline
36 & -0.068409 & -0.6232 & 0.267419 \tabularnewline
37 & -0.121941 & -1.1109 & 0.134902 \tabularnewline
38 & -0.021827 & -0.1989 & 0.421433 \tabularnewline
39 & 0.020861 & 0.1901 & 0.424867 \tabularnewline
40 & 0.127347 & 1.1602 & 0.12465 \tabularnewline
41 & 0.044022 & 0.4011 & 0.344703 \tabularnewline
42 & -0.03395 & -0.3093 & 0.378935 \tabularnewline
43 & -0.033556 & -0.3057 & 0.380294 \tabularnewline
44 & -0.009205 & -0.0839 & 0.466686 \tabularnewline
45 & -0.055297 & -0.5038 & 0.307875 \tabularnewline
46 & -0.109703 & -0.9994 & 0.160242 \tabularnewline
47 & 0.025121 & 0.2289 & 0.409771 \tabularnewline
48 & 0.054887 & 0.5 & 0.309185 \tabularnewline
\hline
\end{tabular}
%Source: https://freestatistics.org/blog/index.php?pk=31236&T=2

[TABLE]
[ROW][C]Partial Autocorrelation Function[/C][/ROW]
[ROW][C]Time lag k[/C][C]PACF(k)[/C][C]T-STAT[/C][C]P-value[/C][/ROW]
[ROW][C]1[/C][C]-0.069173[/C][C]-0.6302[/C][C]0.26515[/C][/ROW]
[ROW][C]2[/C][C]-0.106893[/C][C]-0.9738[/C][C]0.166483[/C][/ROW]
[ROW][C]3[/C][C]0.25642[/C][C]2.3361[/C][C]0.010949[/C][/ROW]
[ROW][C]4[/C][C]0.131413[/C][C]1.1972[/C][C]0.117313[/C][/ROW]
[ROW][C]5[/C][C]-0.215221[/C][C]-1.9608[/C][C]0.026631[/C][/ROW]
[ROW][C]6[/C][C]-0.067082[/C][C]-0.6111[/C][C]0.271387[/C][/ROW]
[ROW][C]7[/C][C]0.101561[/C][C]0.9253[/C][C]0.178754[/C][/ROW]
[ROW][C]8[/C][C]0.11655[/C][C]1.0618[/C][C]0.145698[/C][/ROW]
[ROW][C]9[/C][C]-0.01423[/C][C]-0.1296[/C][C]0.448582[/C][/ROW]
[ROW][C]10[/C][C]-0.138792[/C][C]-1.2645[/C][C]0.104803[/C][/ROW]
[ROW][C]11[/C][C]-0.029598[/C][C]-0.2696[/C][C]0.39405[/C][/ROW]
[ROW][C]12[/C][C]-0.047451[/C][C]-0.4323[/C][C]0.333321[/C][/ROW]
[ROW][C]13[/C][C]-0.0401[/C][C]-0.3653[/C][C]0.357899[/C][/ROW]
[ROW][C]14[/C][C]-0.138502[/C][C]-1.2618[/C][C]0.105274[/C][/ROW]
[ROW][C]15[/C][C]-0.010148[/C][C]-0.0925[/C][C]0.46328[/C][/ROW]
[ROW][C]16[/C][C]0.002487[/C][C]0.0227[/C][C]0.490987[/C][/ROW]
[ROW][C]17[/C][C]0.040783[/C][C]0.3716[/C][C]0.355586[/C][/ROW]
[ROW][C]18[/C][C]0.001537[/C][C]0.014[/C][C]0.49443[/C][/ROW]
[ROW][C]19[/C][C]0.077248[/C][C]0.7038[/C][C]0.241775[/C][/ROW]
[ROW][C]20[/C][C]0.025636[/C][C]0.2336[/C][C]0.407952[/C][/ROW]
[ROW][C]21[/C][C]0.056266[/C][C]0.5126[/C][C]0.304794[/C][/ROW]
[ROW][C]22[/C][C]-0.067007[/C][C]-0.6105[/C][C]0.271611[/C][/ROW]
[ROW][C]23[/C][C]-0.118063[/C][C]-1.0756[/C][C]0.14261[/C][/ROW]
[ROW][C]24[/C][C]-0.082927[/C][C]-0.7555[/C][C]0.226045[/C][/ROW]
[ROW][C]25[/C][C]0.108291[/C][C]0.9866[/C][C]0.163359[/C][/ROW]
[ROW][C]26[/C][C]0.028695[/C][C]0.2614[/C][C]0.397205[/C][/ROW]
[ROW][C]27[/C][C]-0.018409[/C][C]-0.1677[/C][C]0.43361[/C][/ROW]
[ROW][C]28[/C][C]0.003445[/C][C]0.0314[/C][C]0.487518[/C][/ROW]
[ROW][C]29[/C][C]0.009994[/C][C]0.0911[/C][C]0.463835[/C][/ROW]
[ROW][C]30[/C][C]0.032893[/C][C]0.2997[/C][C]0.38259[/C][/ROW]
[ROW][C]31[/C][C]-0.075405[/C][C]-0.687[/C][C]0.247007[/C][/ROW]
[ROW][C]32[/C][C]0.012813[/C][C]0.1167[/C][C]0.453678[/C][/ROW]
[ROW][C]33[/C][C]-0.050953[/C][C]-0.4642[/C][C]0.32186[/C][/ROW]
[ROW][C]34[/C][C]-0.034816[/C][C]-0.3172[/C][C]0.375949[/C][/ROW]
[ROW][C]35[/C][C]-0.065368[/C][C]-0.5955[/C][C]0.276555[/C][/ROW]
[ROW][C]36[/C][C]-0.068409[/C][C]-0.6232[/C][C]0.267419[/C][/ROW]
[ROW][C]37[/C][C]-0.121941[/C][C]-1.1109[/C][C]0.134902[/C][/ROW]
[ROW][C]38[/C][C]-0.021827[/C][C]-0.1989[/C][C]0.421433[/C][/ROW]
[ROW][C]39[/C][C]0.020861[/C][C]0.1901[/C][C]0.424867[/C][/ROW]
[ROW][C]40[/C][C]0.127347[/C][C]1.1602[/C][C]0.12465[/C][/ROW]
[ROW][C]41[/C][C]0.044022[/C][C]0.4011[/C][C]0.344703[/C][/ROW]
[ROW][C]42[/C][C]-0.03395[/C][C]-0.3093[/C][C]0.378935[/C][/ROW]
[ROW][C]43[/C][C]-0.033556[/C][C]-0.3057[/C][C]0.380294[/C][/ROW]
[ROW][C]44[/C][C]-0.009205[/C][C]-0.0839[/C][C]0.466686[/C][/ROW]
[ROW][C]45[/C][C]-0.055297[/C][C]-0.5038[/C][C]0.307875[/C][/ROW]
[ROW][C]46[/C][C]-0.109703[/C][C]-0.9994[/C][C]0.160242[/C][/ROW]
[ROW][C]47[/C][C]0.025121[/C][C]0.2289[/C][C]0.409771[/C][/ROW]
[ROW][C]48[/C][C]0.054887[/C][C]0.5[/C][C]0.309185[/C][/ROW]
[/TABLE]
Source: https://freestatistics.org/blog/index.php?pk=31236&T=2

Globally Unique Identifier (entire table): ba.freestatistics.org/blog/index.php?pk=31236&T=2

As an alternative you can also use a QR Code:  

The GUIDs for individual cells are displayed in the table below:

Partial Autocorrelation Function
Time lag kPACF(k)T-STATP-value
1-0.069173-0.63020.26515
2-0.106893-0.97380.166483
30.256422.33610.010949
40.1314131.19720.117313
5-0.215221-1.96080.026631
6-0.067082-0.61110.271387
70.1015610.92530.178754
80.116551.06180.145698
9-0.01423-0.12960.448582
10-0.138792-1.26450.104803
11-0.029598-0.26960.39405
12-0.047451-0.43230.333321
13-0.0401-0.36530.357899
14-0.138502-1.26180.105274
15-0.010148-0.09250.46328
160.0024870.02270.490987
170.0407830.37160.355586
180.0015370.0140.49443
190.0772480.70380.241775
200.0256360.23360.407952
210.0562660.51260.304794
22-0.067007-0.61050.271611
23-0.118063-1.07560.14261
24-0.082927-0.75550.226045
250.1082910.98660.163359
260.0286950.26140.397205
27-0.018409-0.16770.43361
280.0034450.03140.487518
290.0099940.09110.463835
300.0328930.29970.38259
31-0.075405-0.6870.247007
320.0128130.11670.453678
33-0.050953-0.46420.32186
34-0.034816-0.31720.375949
35-0.065368-0.59550.276555
36-0.068409-0.62320.267419
37-0.121941-1.11090.134902
38-0.021827-0.19890.421433
390.0208610.19010.424867
400.1273471.16020.12465
410.0440220.40110.344703
42-0.03395-0.30930.378935
43-0.033556-0.30570.380294
44-0.009205-0.08390.466686
45-0.055297-0.50380.307875
46-0.109703-0.99940.160242
470.0251210.22890.409771
480.0548870.50.309185


Parameters (Session):
par1 = 48 ; par2 = 1 ; par3 = 1 ; par4 = 0 ; par5 = 12 ;
Parameters (R input):
par1 = 48 ; par2 = 1 ; par3 = 1 ; par4 = 0 ; par5 = 12 ;
R code (references can be found in the software module):
if (par1 == 'Default') {
par1 = 10*log10(length(x))
} else {
par1 <- as.numeric(par1)
}
par2 <- as.numeric(par2)
par3 <- as.numeric(par3)
par4 <- as.numeric(par4)
par5 <- as.numeric(par5)
if (par2 == 0) {
x <- log(x)
} else {
x <- (x ^ par2 - 1) / par2
}
if (par3 > 0) x <- diff(x,lag=1,difference=par3)
if (par4 > 0) x <- diff(x,lag=par5,difference=par4)
bitmap(file='pic1.png')
racf <- acf(x,par1,main='Autocorrelation',xlab='lags',ylab='ACF')
dev.off()
bitmap(file='pic2.png')
rpacf <- pacf(x,par1,main='Partial Autocorrelation',xlab='lags',ylab='PACF')
dev.off()
(myacf <- c(racf$acf))
(mypacf <- c(rpacf$acf))
lengthx <- length(x)
sqrtn <- sqrt(lengthx)
load(file='createtable')
a<-table.start()
a<-table.row.start(a)
a<-table.element(a,'Autocorrelation Function',4,TRUE)
a<-table.row.end(a)
a<-table.row.start(a)
a<-table.element(a,'Time lag k',header=TRUE)
a<-table.element(a,hyperlink('basics.htm','ACF(k)','click here for more information about the Autocorrelation Function'),header=TRUE)
a<-table.element(a,'T-STAT',header=TRUE)
a<-table.element(a,'P-value',header=TRUE)
a<-table.row.end(a)
for (i in 2:(par1+1)) {
a<-table.row.start(a)
a<-table.element(a,i-1,header=TRUE)
a<-table.element(a,round(myacf[i],6))
mytstat <- myacf[i]*sqrtn
a<-table.element(a,round(mytstat,4))
a<-table.element(a,round(1-pt(abs(mytstat),lengthx),6))
a<-table.row.end(a)
}
a<-table.end(a)
table.save(a,file='mytable.tab')
a<-table.start()
a<-table.row.start(a)
a<-table.element(a,'Partial Autocorrelation Function',4,TRUE)
a<-table.row.end(a)
a<-table.row.start(a)
a<-table.element(a,'Time lag k',header=TRUE)
a<-table.element(a,hyperlink('basics.htm','PACF(k)','click here for more information about the Partial Autocorrelation Function'),header=TRUE)
a<-table.element(a,'T-STAT',header=TRUE)
a<-table.element(a,'P-value',header=TRUE)
a<-table.row.end(a)
for (i in 1:par1) {
a<-table.row.start(a)
a<-table.element(a,i,header=TRUE)
a<-table.element(a,round(mypacf[i],6))
mytstat <- mypacf[i]*sqrtn
a<-table.element(a,round(mytstat,4))
a<-table.element(a,round(1-pt(abs(mytstat),lengthx),6))
a<-table.row.end(a)
}
a<-table.end(a)
table.save(a,file='mytable1.tab')