Free Statistics

of Irreproducible Research!

Author's title

Author*The author of this computation has been verified*
R Software Modulerwasp_arimabackwardselection.wasp
Title produced by softwareARIMA Backward Selection
Date of computationTue, 09 Dec 2008 02:08:43 -0700
Cite this page as followsStatistical Computations at FreeStatistics.org, Office for Research Development and Education, URL https://freestatistics.org/blog/index.php?v=date/2008/Dec/09/t122881377555la004vk5bf541.htm/, Retrieved Sun, 19 May 2024 12:38:41 +0000
Statistical Computations at FreeStatistics.org, Office for Research Development and Education, URL https://freestatistics.org/blog/index.php?pk=31206, Retrieved Sun, 19 May 2024 12:38:41 +0000
QR Codes:

Original text written by user:
IsPrivate?No (this computation is public)
User-defined keywordsstep5
Estimated Impact180
Family? (F = Feedback message, R = changed R code, M = changed R Module, P = changed Parameters, D = changed Data)
-     [Univariate Data Series] [data set] [2008-12-01 19:54:57] [b98453cac15ba1066b407e146608df68]
F RMP   [Standard Deviation-Mean Plot] [q1] [2008-12-08 12:37:39] [3ffd109c9e040b1ae7e5dbe576d4698c]
F RM      [Variance Reduction Matrix] [VRM] [2008-12-08 12:46:37] [3ffd109c9e040b1ae7e5dbe576d4698c]
F RMP       [Spectral Analysis] [spectraal] [2008-12-08 12:59:51] [3ffd109c9e040b1ae7e5dbe576d4698c]
-   P         [Spectral Analysis] [spectraal] [2008-12-08 13:04:01] [3ffd109c9e040b1ae7e5dbe576d4698c]
F RMP           [(Partial) Autocorrelation Function] [ACF] [2008-12-08 13:28:31] [3ffd109c9e040b1ae7e5dbe576d4698c]
- RM              [ARIMA Backward Selection] [arima] [2008-12-08 13:33:32] [3ffd109c9e040b1ae7e5dbe576d4698c]
F                   [ARIMA Backward Selection] [arima backward] [2008-12-08 13:36:06] [3ffd109c9e040b1ae7e5dbe576d4698c]
F   PD                  [ARIMA Backward Selection] [step5] [2008-12-09 09:08:43] [962e6c9020896982bc8283b8971710a9] [Current]
- R P                     [ARIMA Backward Selection] [arma] [2008-12-18 17:17:40] [3ffd109c9e040b1ae7e5dbe576d4698c]
Feedback Forum
2008-12-15 14:39:57 [Charis Berrevoets] [reply
Je model ziet er inderdaad al vrij goed uit. Je vermeld zelf al wel dat het nog voor verbetering vatbaar is. Ik vermoed dat een deel van de 'fout' ligt bij de parameters die je hebt ingegeven. Het was de bedoeling om voor p, P, q en Q de werkelijke waarden in te geven en niet de maximumwaarden zoals je hebt gedaan. Wanneer ik dit wil proberen voor de waarden die je gevonden hebt krijg ik echter een foutmelding. Ik kan dus niet met zekerheid zeggen of dit inderdaad een oplossing zou zijn.

Post a new message
Dataseries X:
147768
137507
136919
136151
133001
125554
119647
114158
116193
152803
161761
160942
149470
139208
134588
130322
126611
122401
117352
112135
112879
148729
157230
157221
146681
136524
132111
125326
122716
116615
113719
110737
112093
143565
149946
149147
134339
122683
115614
116566
111272
104609
101802
94542
93051
124129
130374
123946
114971
105531
104919
104782
101281
94545
93248
84031
87486
115867
120327
117008
108811


Summary of computational transaction
Raw Inputview raw input (R code)
Raw Outputview raw output of R engine
Computing time10 seconds
R Server'Gwilym Jenkins' @ 72.249.127.135

\begin{tabular}{lllllllll}
\hline
Summary of computational transaction \tabularnewline
Raw Input & view raw input (R code)  \tabularnewline
Raw Output & view raw output of R engine  \tabularnewline
Computing time & 10 seconds \tabularnewline
R Server & 'Gwilym Jenkins' @ 72.249.127.135 \tabularnewline
\hline
\end{tabular}
%Source: https://freestatistics.org/blog/index.php?pk=31206&T=0

[TABLE]
[ROW][C]Summary of computational transaction[/C][/ROW]
[ROW][C]Raw Input[/C][C]view raw input (R code) [/C][/ROW]
[ROW][C]Raw Output[/C][C]view raw output of R engine [/C][/ROW]
[ROW][C]Computing time[/C][C]10 seconds[/C][/ROW]
[ROW][C]R Server[/C][C]'Gwilym Jenkins' @ 72.249.127.135[/C][/ROW]
[/TABLE]
Source: https://freestatistics.org/blog/index.php?pk=31206&T=0

Globally Unique Identifier (entire table): ba.freestatistics.org/blog/index.php?pk=31206&T=0

As an alternative you can also use a QR Code:  

The GUIDs for individual cells are displayed in the table below:

Summary of computational transaction
Raw Inputview raw input (R code)
Raw Outputview raw output of R engine
Computing time10 seconds
R Server'Gwilym Jenkins' @ 72.249.127.135


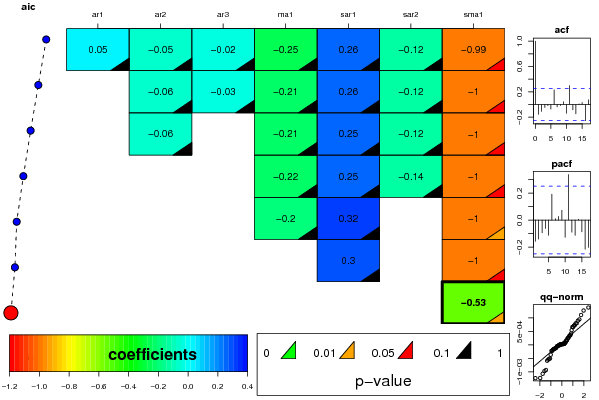
ARIMA Parameter Estimation and Backward Selection
Iterationar1ar2ar3ma1sar1sar2sma1
Estimates ( 1 )0.0471-0.0523-0.0242-0.25440.2574-0.1221-0.995
(p-val)(0.9728 )(0.867 )(0.906 )(0.8524 )(0.2704 )(0.6334 )(0.0818 )
Estimates ( 2 )0-0.0616-0.0289-0.20810.2575-0.1233-1.0046
(p-val)(NA )(0.6821 )(0.843 )(0.177 )(0.2703 )(0.6267 )(0.0831 )
Estimates ( 3 )0-0.06050-0.20850.2535-0.1238-1.0044
(p-val)(NA )(0.6863 )(NA )(0.1811 )(0.2777 )(0.6261 )(0.0801 )
Estimates ( 4 )000-0.22240.2532-0.1401-1.0042
(p-val)(NA )(NA )(NA )(0.1665 )(0.2726 )(0.571 )(0.0812 )
Estimates ( 5 )000-0.19610.31880-1.0014
(p-val)(NA )(NA )(NA )(0.2087 )(0.1238 )(NA )(0.0197 )
Estimates ( 6 )00000.29830-1.0026
(p-val)(NA )(NA )(NA )(NA )(0.152 )(NA )(0.0748 )
Estimates ( 7 )000000-0.5307
(p-val)(NA )(NA )(NA )(NA )(NA )(NA )(0.0199 )
Estimates ( 8 )NANANANANANANA
(p-val)(NA )(NA )(NA )(NA )(NA )(NA )(NA )
Estimates ( 9 )NANANANANANANA
(p-val)(NA )(NA )(NA )(NA )(NA )(NA )(NA )
Estimates ( 10 )NANANANANANANA
(p-val)(NA )(NA )(NA )(NA )(NA )(NA )(NA )
Estimates ( 11 )NANANANANANANA
(p-val)(NA )(NA )(NA )(NA )(NA )(NA )(NA )
Estimates ( 12 )NANANANANANANA
(p-val)(NA )(NA )(NA )(NA )(NA )(NA )(NA )
Estimates ( 13 )NANANANANANANA
(p-val)(NA )(NA )(NA )(NA )(NA )(NA )(NA )

\begin{tabular}{lllllllll}
\hline
ARIMA Parameter Estimation and Backward Selection \tabularnewline
Iteration & ar1 & ar2 & ar3 & ma1 & sar1 & sar2 & sma1 \tabularnewline
Estimates ( 1 ) & 0.0471 & -0.0523 & -0.0242 & -0.2544 & 0.2574 & -0.1221 & -0.995 \tabularnewline
(p-val) & (0.9728 ) & (0.867 ) & (0.906 ) & (0.8524 ) & (0.2704 ) & (0.6334 ) & (0.0818 ) \tabularnewline
Estimates ( 2 ) & 0 & -0.0616 & -0.0289 & -0.2081 & 0.2575 & -0.1233 & -1.0046 \tabularnewline
(p-val) & (NA ) & (0.6821 ) & (0.843 ) & (0.177 ) & (0.2703 ) & (0.6267 ) & (0.0831 ) \tabularnewline
Estimates ( 3 ) & 0 & -0.0605 & 0 & -0.2085 & 0.2535 & -0.1238 & -1.0044 \tabularnewline
(p-val) & (NA ) & (0.6863 ) & (NA ) & (0.1811 ) & (0.2777 ) & (0.6261 ) & (0.0801 ) \tabularnewline
Estimates ( 4 ) & 0 & 0 & 0 & -0.2224 & 0.2532 & -0.1401 & -1.0042 \tabularnewline
(p-val) & (NA ) & (NA ) & (NA ) & (0.1665 ) & (0.2726 ) & (0.571 ) & (0.0812 ) \tabularnewline
Estimates ( 5 ) & 0 & 0 & 0 & -0.1961 & 0.3188 & 0 & -1.0014 \tabularnewline
(p-val) & (NA ) & (NA ) & (NA ) & (0.2087 ) & (0.1238 ) & (NA ) & (0.0197 ) \tabularnewline
Estimates ( 6 ) & 0 & 0 & 0 & 0 & 0.2983 & 0 & -1.0026 \tabularnewline
(p-val) & (NA ) & (NA ) & (NA ) & (NA ) & (0.152 ) & (NA ) & (0.0748 ) \tabularnewline
Estimates ( 7 ) & 0 & 0 & 0 & 0 & 0 & 0 & -0.5307 \tabularnewline
(p-val) & (NA ) & (NA ) & (NA ) & (NA ) & (NA ) & (NA ) & (0.0199 ) \tabularnewline
Estimates ( 8 ) & NA & NA & NA & NA & NA & NA & NA \tabularnewline
(p-val) & (NA ) & (NA ) & (NA ) & (NA ) & (NA ) & (NA ) & (NA ) \tabularnewline
Estimates ( 9 ) & NA & NA & NA & NA & NA & NA & NA \tabularnewline
(p-val) & (NA ) & (NA ) & (NA ) & (NA ) & (NA ) & (NA ) & (NA ) \tabularnewline
Estimates ( 10 ) & NA & NA & NA & NA & NA & NA & NA \tabularnewline
(p-val) & (NA ) & (NA ) & (NA ) & (NA ) & (NA ) & (NA ) & (NA ) \tabularnewline
Estimates ( 11 ) & NA & NA & NA & NA & NA & NA & NA \tabularnewline
(p-val) & (NA ) & (NA ) & (NA ) & (NA ) & (NA ) & (NA ) & (NA ) \tabularnewline
Estimates ( 12 ) & NA & NA & NA & NA & NA & NA & NA \tabularnewline
(p-val) & (NA ) & (NA ) & (NA ) & (NA ) & (NA ) & (NA ) & (NA ) \tabularnewline
Estimates ( 13 ) & NA & NA & NA & NA & NA & NA & NA \tabularnewline
(p-val) & (NA ) & (NA ) & (NA ) & (NA ) & (NA ) & (NA ) & (NA ) \tabularnewline
\hline
\end{tabular}
%Source: https://freestatistics.org/blog/index.php?pk=31206&T=1

[TABLE]
[ROW][C]ARIMA Parameter Estimation and Backward Selection[/C][/ROW]
[ROW][C]Iteration[/C][C]ar1[/C][C]ar2[/C][C]ar3[/C][C]ma1[/C][C]sar1[/C][C]sar2[/C][C]sma1[/C][/ROW]
[ROW][C]Estimates ( 1 )[/C][C]0.0471[/C][C]-0.0523[/C][C]-0.0242[/C][C]-0.2544[/C][C]0.2574[/C][C]-0.1221[/C][C]-0.995[/C][/ROW]
[ROW][C](p-val)[/C][C](0.9728 )[/C][C](0.867 )[/C][C](0.906 )[/C][C](0.8524 )[/C][C](0.2704 )[/C][C](0.6334 )[/C][C](0.0818 )[/C][/ROW]
[ROW][C]Estimates ( 2 )[/C][C]0[/C][C]-0.0616[/C][C]-0.0289[/C][C]-0.2081[/C][C]0.2575[/C][C]-0.1233[/C][C]-1.0046[/C][/ROW]
[ROW][C](p-val)[/C][C](NA )[/C][C](0.6821 )[/C][C](0.843 )[/C][C](0.177 )[/C][C](0.2703 )[/C][C](0.6267 )[/C][C](0.0831 )[/C][/ROW]
[ROW][C]Estimates ( 3 )[/C][C]0[/C][C]-0.0605[/C][C]0[/C][C]-0.2085[/C][C]0.2535[/C][C]-0.1238[/C][C]-1.0044[/C][/ROW]
[ROW][C](p-val)[/C][C](NA )[/C][C](0.6863 )[/C][C](NA )[/C][C](0.1811 )[/C][C](0.2777 )[/C][C](0.6261 )[/C][C](0.0801 )[/C][/ROW]
[ROW][C]Estimates ( 4 )[/C][C]0[/C][C]0[/C][C]0[/C][C]-0.2224[/C][C]0.2532[/C][C]-0.1401[/C][C]-1.0042[/C][/ROW]
[ROW][C](p-val)[/C][C](NA )[/C][C](NA )[/C][C](NA )[/C][C](0.1665 )[/C][C](0.2726 )[/C][C](0.571 )[/C][C](0.0812 )[/C][/ROW]
[ROW][C]Estimates ( 5 )[/C][C]0[/C][C]0[/C][C]0[/C][C]-0.1961[/C][C]0.3188[/C][C]0[/C][C]-1.0014[/C][/ROW]
[ROW][C](p-val)[/C][C](NA )[/C][C](NA )[/C][C](NA )[/C][C](0.2087 )[/C][C](0.1238 )[/C][C](NA )[/C][C](0.0197 )[/C][/ROW]
[ROW][C]Estimates ( 6 )[/C][C]0[/C][C]0[/C][C]0[/C][C]0[/C][C]0.2983[/C][C]0[/C][C]-1.0026[/C][/ROW]
[ROW][C](p-val)[/C][C](NA )[/C][C](NA )[/C][C](NA )[/C][C](NA )[/C][C](0.152 )[/C][C](NA )[/C][C](0.0748 )[/C][/ROW]
[ROW][C]Estimates ( 7 )[/C][C]0[/C][C]0[/C][C]0[/C][C]0[/C][C]0[/C][C]0[/C][C]-0.5307[/C][/ROW]
[ROW][C](p-val)[/C][C](NA )[/C][C](NA )[/C][C](NA )[/C][C](NA )[/C][C](NA )[/C][C](NA )[/C][C](0.0199 )[/C][/ROW]
[ROW][C]Estimates ( 8 )[/C][C]NA[/C][C]NA[/C][C]NA[/C][C]NA[/C][C]NA[/C][C]NA[/C][C]NA[/C][/ROW]
[ROW][C](p-val)[/C][C](NA )[/C][C](NA )[/C][C](NA )[/C][C](NA )[/C][C](NA )[/C][C](NA )[/C][C](NA )[/C][/ROW]
[ROW][C]Estimates ( 9 )[/C][C]NA[/C][C]NA[/C][C]NA[/C][C]NA[/C][C]NA[/C][C]NA[/C][C]NA[/C][/ROW]
[ROW][C](p-val)[/C][C](NA )[/C][C](NA )[/C][C](NA )[/C][C](NA )[/C][C](NA )[/C][C](NA )[/C][C](NA )[/C][/ROW]
[ROW][C]Estimates ( 10 )[/C][C]NA[/C][C]NA[/C][C]NA[/C][C]NA[/C][C]NA[/C][C]NA[/C][C]NA[/C][/ROW]
[ROW][C](p-val)[/C][C](NA )[/C][C](NA )[/C][C](NA )[/C][C](NA )[/C][C](NA )[/C][C](NA )[/C][C](NA )[/C][/ROW]
[ROW][C]Estimates ( 11 )[/C][C]NA[/C][C]NA[/C][C]NA[/C][C]NA[/C][C]NA[/C][C]NA[/C][C]NA[/C][/ROW]
[ROW][C](p-val)[/C][C](NA )[/C][C](NA )[/C][C](NA )[/C][C](NA )[/C][C](NA )[/C][C](NA )[/C][C](NA )[/C][/ROW]
[ROW][C]Estimates ( 12 )[/C][C]NA[/C][C]NA[/C][C]NA[/C][C]NA[/C][C]NA[/C][C]NA[/C][C]NA[/C][/ROW]
[ROW][C](p-val)[/C][C](NA )[/C][C](NA )[/C][C](NA )[/C][C](NA )[/C][C](NA )[/C][C](NA )[/C][C](NA )[/C][/ROW]
[ROW][C]Estimates ( 13 )[/C][C]NA[/C][C]NA[/C][C]NA[/C][C]NA[/C][C]NA[/C][C]NA[/C][C]NA[/C][/ROW]
[ROW][C](p-val)[/C][C](NA )[/C][C](NA )[/C][C](NA )[/C][C](NA )[/C][C](NA )[/C][C](NA )[/C][C](NA )[/C][/ROW]
[/TABLE]
Source: https://freestatistics.org/blog/index.php?pk=31206&T=1

Globally Unique Identifier (entire table): ba.freestatistics.org/blog/index.php?pk=31206&T=1

As an alternative you can also use a QR Code:  

The GUIDs for individual cells are displayed in the table below:

ARIMA Parameter Estimation and Backward Selection
Iterationar1ar2ar3ma1sar1sar2sma1
Estimates ( 1 )0.0471-0.0523-0.0242-0.25440.2574-0.1221-0.995
(p-val)(0.9728 )(0.867 )(0.906 )(0.8524 )(0.2704 )(0.6334 )(0.0818 )
Estimates ( 2 )0-0.0616-0.0289-0.20810.2575-0.1233-1.0046
(p-val)(NA )(0.6821 )(0.843 )(0.177 )(0.2703 )(0.6267 )(0.0831 )
Estimates ( 3 )0-0.06050-0.20850.2535-0.1238-1.0044
(p-val)(NA )(0.6863 )(NA )(0.1811 )(0.2777 )(0.6261 )(0.0801 )
Estimates ( 4 )000-0.22240.2532-0.1401-1.0042
(p-val)(NA )(NA )(NA )(0.1665 )(0.2726 )(0.571 )(0.0812 )
Estimates ( 5 )000-0.19610.31880-1.0014
(p-val)(NA )(NA )(NA )(0.2087 )(0.1238 )(NA )(0.0197 )
Estimates ( 6 )00000.29830-1.0026
(p-val)(NA )(NA )(NA )(NA )(0.152 )(NA )(0.0748 )
Estimates ( 7 )000000-0.5307
(p-val)(NA )(NA )(NA )(NA )(NA )(NA )(0.0199 )
Estimates ( 8 )NANANANANANANA
(p-val)(NA )(NA )(NA )(NA )(NA )(NA )(NA )
Estimates ( 9 )NANANANANANANA
(p-val)(NA )(NA )(NA )(NA )(NA )(NA )(NA )
Estimates ( 10 )NANANANANANANA
(p-val)(NA )(NA )(NA )(NA )(NA )(NA )(NA )
Estimates ( 11 )NANANANANANANA
(p-val)(NA )(NA )(NA )(NA )(NA )(NA )(NA )
Estimates ( 12 )NANANANANANANA
(p-val)(NA )(NA )(NA )(NA )(NA )(NA )(NA )
Estimates ( 13 )NANANANANANANA
(p-val)(NA )(NA )(NA )(NA )(NA )(NA )(NA )


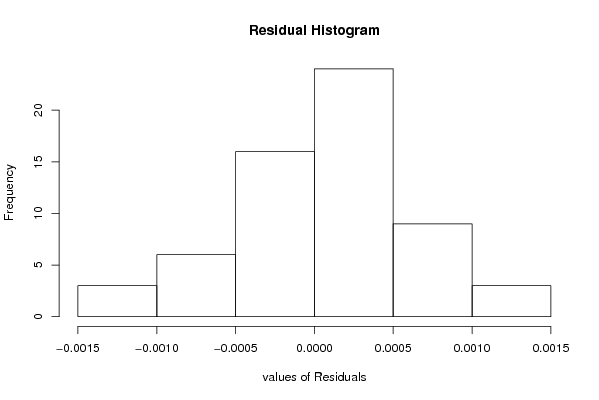
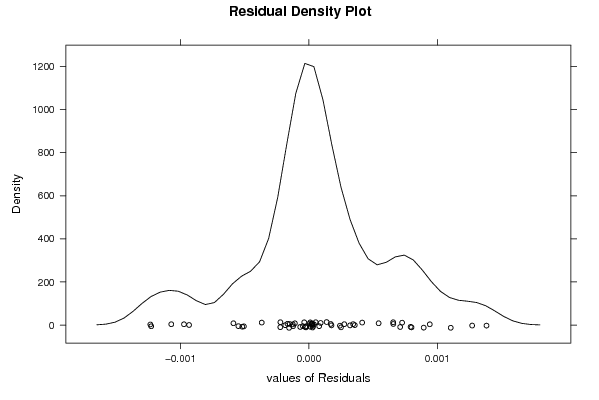
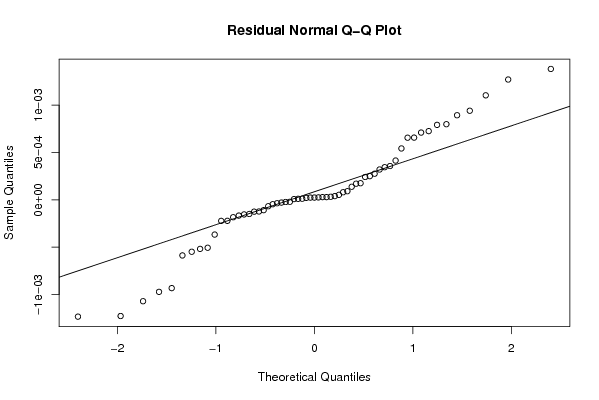
Estimated ARIMA Residuals
Value
-0.00107213872154515
-2.30208698629931e-05
0.000726239457783182
0.000657633903985971
0.000138050855875212
-0.00058804485133877
-0.000149816818216306
-3.62201847760903e-05
0.000275795407469272
-6.77436746849377e-05
2.84959602434733e-05
-0.000123341140070618
-0.00010929268142726
1.14833565370178e-05
0.000250092487298588
0.000792233057225821
-0.000154384127272459
0.000241513177436856
-0.000506788728461957
-0.000518969678078022
-4.66340105089134e-05
0.000711046833415149
0.000320542966907799
9.12475611538604e-05
0.000894356227016472
0.000543185673602825
0.000941775357128868
-0.00123536459868435
0.000656662741836225
0.000357321785023954
-0.000184102654289835
0.00110490252657894
0.000799436167080466
-0.000933784376332117
-2.08579086041568e-05
0.00127192183807596
-0.000367450292629672
0.000170233107575766
-0.00097324152015028
-0.000222114257369016
-2.91646606898892e-05
0.000415044464357727
-0.00054923445114792
0.00138376112824110
-0.00122871298060243
-0.000222753451278911
0.000344858599030336
2.36121040960783e-05
-0.000125257534387725

\begin{tabular}{lllllllll}
\hline
Estimated ARIMA Residuals \tabularnewline
Value \tabularnewline
-0.00107213872154515 \tabularnewline
-2.30208698629931e-05 \tabularnewline
0.000726239457783182 \tabularnewline
0.000657633903985971 \tabularnewline
0.000138050855875212 \tabularnewline
-0.00058804485133877 \tabularnewline
-0.000149816818216306 \tabularnewline
-3.62201847760903e-05 \tabularnewline
0.000275795407469272 \tabularnewline
-6.77436746849377e-05 \tabularnewline
2.84959602434733e-05 \tabularnewline
-0.000123341140070618 \tabularnewline
-0.00010929268142726 \tabularnewline
1.14833565370178e-05 \tabularnewline
0.000250092487298588 \tabularnewline
0.000792233057225821 \tabularnewline
-0.000154384127272459 \tabularnewline
0.000241513177436856 \tabularnewline
-0.000506788728461957 \tabularnewline
-0.000518969678078022 \tabularnewline
-4.66340105089134e-05 \tabularnewline
0.000711046833415149 \tabularnewline
0.000320542966907799 \tabularnewline
9.12475611538604e-05 \tabularnewline
0.000894356227016472 \tabularnewline
0.000543185673602825 \tabularnewline
0.000941775357128868 \tabularnewline
-0.00123536459868435 \tabularnewline
0.000656662741836225 \tabularnewline
0.000357321785023954 \tabularnewline
-0.000184102654289835 \tabularnewline
0.00110490252657894 \tabularnewline
0.000799436167080466 \tabularnewline
-0.000933784376332117 \tabularnewline
-2.08579086041568e-05 \tabularnewline
0.00127192183807596 \tabularnewline
-0.000367450292629672 \tabularnewline
0.000170233107575766 \tabularnewline
-0.00097324152015028 \tabularnewline
-0.000222114257369016 \tabularnewline
-2.91646606898892e-05 \tabularnewline
0.000415044464357727 \tabularnewline
-0.00054923445114792 \tabularnewline
0.00138376112824110 \tabularnewline
-0.00122871298060243 \tabularnewline
-0.000222753451278911 \tabularnewline
0.000344858599030336 \tabularnewline
2.36121040960783e-05 \tabularnewline
-0.000125257534387725 \tabularnewline
\hline
\end{tabular}
%Source: https://freestatistics.org/blog/index.php?pk=31206&T=2

[TABLE]
[ROW][C]Estimated ARIMA Residuals[/C][/ROW]
[ROW][C]Value[/C][/ROW]
[ROW][C]-0.00107213872154515[/C][/ROW]
[ROW][C]-2.30208698629931e-05[/C][/ROW]
[ROW][C]0.000726239457783182[/C][/ROW]
[ROW][C]0.000657633903985971[/C][/ROW]
[ROW][C]0.000138050855875212[/C][/ROW]
[ROW][C]-0.00058804485133877[/C][/ROW]
[ROW][C]-0.000149816818216306[/C][/ROW]
[ROW][C]-3.62201847760903e-05[/C][/ROW]
[ROW][C]0.000275795407469272[/C][/ROW]
[ROW][C]-6.77436746849377e-05[/C][/ROW]
[ROW][C]2.84959602434733e-05[/C][/ROW]
[ROW][C]-0.000123341140070618[/C][/ROW]
[ROW][C]-0.00010929268142726[/C][/ROW]
[ROW][C]1.14833565370178e-05[/C][/ROW]
[ROW][C]0.000250092487298588[/C][/ROW]
[ROW][C]0.000792233057225821[/C][/ROW]
[ROW][C]-0.000154384127272459[/C][/ROW]
[ROW][C]0.000241513177436856[/C][/ROW]
[ROW][C]-0.000506788728461957[/C][/ROW]
[ROW][C]-0.000518969678078022[/C][/ROW]
[ROW][C]-4.66340105089134e-05[/C][/ROW]
[ROW][C]0.000711046833415149[/C][/ROW]
[ROW][C]0.000320542966907799[/C][/ROW]
[ROW][C]9.12475611538604e-05[/C][/ROW]
[ROW][C]0.000894356227016472[/C][/ROW]
[ROW][C]0.000543185673602825[/C][/ROW]
[ROW][C]0.000941775357128868[/C][/ROW]
[ROW][C]-0.00123536459868435[/C][/ROW]
[ROW][C]0.000656662741836225[/C][/ROW]
[ROW][C]0.000357321785023954[/C][/ROW]
[ROW][C]-0.000184102654289835[/C][/ROW]
[ROW][C]0.00110490252657894[/C][/ROW]
[ROW][C]0.000799436167080466[/C][/ROW]
[ROW][C]-0.000933784376332117[/C][/ROW]
[ROW][C]-2.08579086041568e-05[/C][/ROW]
[ROW][C]0.00127192183807596[/C][/ROW]
[ROW][C]-0.000367450292629672[/C][/ROW]
[ROW][C]0.000170233107575766[/C][/ROW]
[ROW][C]-0.00097324152015028[/C][/ROW]
[ROW][C]-0.000222114257369016[/C][/ROW]
[ROW][C]-2.91646606898892e-05[/C][/ROW]
[ROW][C]0.000415044464357727[/C][/ROW]
[ROW][C]-0.00054923445114792[/C][/ROW]
[ROW][C]0.00138376112824110[/C][/ROW]
[ROW][C]-0.00122871298060243[/C][/ROW]
[ROW][C]-0.000222753451278911[/C][/ROW]
[ROW][C]0.000344858599030336[/C][/ROW]
[ROW][C]2.36121040960783e-05[/C][/ROW]
[ROW][C]-0.000125257534387725[/C][/ROW]
[/TABLE]
Source: https://freestatistics.org/blog/index.php?pk=31206&T=2

Globally Unique Identifier (entire table): ba.freestatistics.org/blog/index.php?pk=31206&T=2

As an alternative you can also use a QR Code:  

The GUIDs for individual cells are displayed in the table below:

Estimated ARIMA Residuals
Value
-0.00107213872154515
-2.30208698629931e-05
0.000726239457783182
0.000657633903985971
0.000138050855875212
-0.00058804485133877
-0.000149816818216306
-3.62201847760903e-05
0.000275795407469272
-6.77436746849377e-05
2.84959602434733e-05
-0.000123341140070618
-0.00010929268142726
1.14833565370178e-05
0.000250092487298588
0.000792233057225821
-0.000154384127272459
0.000241513177436856
-0.000506788728461957
-0.000518969678078022
-4.66340105089134e-05
0.000711046833415149
0.000320542966907799
9.12475611538604e-05
0.000894356227016472
0.000543185673602825
0.000941775357128868
-0.00123536459868435
0.000656662741836225
0.000357321785023954
-0.000184102654289835
0.00110490252657894
0.000799436167080466
-0.000933784376332117
-2.08579086041568e-05
0.00127192183807596
-0.000367450292629672
0.000170233107575766
-0.00097324152015028
-0.000222114257369016
-2.91646606898892e-05
0.000415044464357727
-0.00054923445114792
0.00138376112824110
-0.00122871298060243
-0.000222753451278911
0.000344858599030336
2.36121040960783e-05
-0.000125257534387725


Parameters (Session):
par1 = FALSE ; par2 = -0.1 ; par3 = 1 ; par4 = 1 ; par5 = 12 ; par6 = 3 ; par7 = 1 ; par8 = 2 ; par9 = 1 ;
Parameters (R input):
par1 = FALSE ; par2 = -0.1 ; par3 = 1 ; par4 = 1 ; par5 = 12 ; par6 = 3 ; par7 = 1 ; par8 = 2 ; par9 = 1 ;
R code (references can be found in the software module):
library(lattice)
if (par1 == 'TRUE') par1 <- TRUE
if (par1 == 'FALSE') par1 <- FALSE
par2 <- as.numeric(par2) #Box-Cox lambda transformation parameter
par3 <- as.numeric(par3) #degree of non-seasonal differencing
par4 <- as.numeric(par4) #degree of seasonal differencing
par5 <- as.numeric(par5) #seasonal period
par6 <- as.numeric(par6) #degree (p) of the non-seasonal AR(p) polynomial
par7 <- as.numeric(par7) #degree (q) of the non-seasonal MA(q) polynomial
par8 <- as.numeric(par8) #degree (P) of the seasonal AR(P) polynomial
par9 <- as.numeric(par9) #degree (Q) of the seasonal MA(Q) polynomial
armaGR <- function(arima.out, names, n){
try1 <- arima.out$coef
try2 <- sqrt(diag(arima.out$var.coef))
try.data.frame <- data.frame(matrix(NA,ncol=4,nrow=length(names)))
dimnames(try.data.frame) <- list(names,c('coef','std','tstat','pv'))
try.data.frame[,1] <- try1
for(i in 1:length(try2)) try.data.frame[which(rownames(try.data.frame)==names(try2)[i]),2] <- try2[i]
try.data.frame[,3] <- try.data.frame[,1] / try.data.frame[,2]
try.data.frame[,4] <- round((1-pt(abs(try.data.frame[,3]),df=n-(length(try2)+1)))*2,5)
vector <- rep(NA,length(names))
vector[is.na(try.data.frame[,4])] <- 0
maxi <- which.max(try.data.frame[,4])
continue <- max(try.data.frame[,4],na.rm=TRUE) > .05
vector[maxi] <- 0
list(summary=try.data.frame,next.vector=vector,continue=continue)
}
arimaSelect <- function(series, order=c(13,0,0), seasonal=list(order=c(2,0,0),period=12), include.mean=F){
nrc <- order[1]+order[3]+seasonal$order[1]+seasonal$order[3]
coeff <- matrix(NA, nrow=nrc*2, ncol=nrc)
pval <- matrix(NA, nrow=nrc*2, ncol=nrc)
mylist <- rep(list(NULL), nrc)
names <- NULL
if(order[1] > 0) names <- paste('ar',1:order[1],sep='')
if(order[3] > 0) names <- c( names , paste('ma',1:order[3],sep='') )
if(seasonal$order[1] > 0) names <- c(names, paste('sar',1:seasonal$order[1],sep=''))
if(seasonal$order[3] > 0) names <- c(names, paste('sma',1:seasonal$order[3],sep=''))
arima.out <- arima(series, order=order, seasonal=seasonal, include.mean=include.mean, method='ML')
mylist[[1]] <- arima.out
last.arma <- armaGR(arima.out, names, length(series))
mystop <- FALSE
i <- 1
coeff[i,] <- last.arma[[1]][,1]
pval [i,] <- last.arma[[1]][,4]
i <- 2
aic <- arima.out$aic
while(!mystop){
mylist[[i]] <- arima.out
arima.out <- arima(series, order=order, seasonal=seasonal, include.mean=include.mean, method='ML', fixed=last.arma$next.vector)
aic <- c(aic, arima.out$aic)
last.arma <- armaGR(arima.out, names, length(series))
mystop <- !last.arma$continue
coeff[i,] <- last.arma[[1]][,1]
pval [i,] <- last.arma[[1]][,4]
i <- i+1
}
list(coeff, pval, mylist, aic=aic)
}
arimaSelectplot <- function(arimaSelect.out,noms,choix){
noms <- names(arimaSelect.out[[3]][[1]]$coef)
coeff <- arimaSelect.out[[1]]
k <- min(which(is.na(coeff[,1])))-1
coeff <- coeff[1:k,]
pval <- arimaSelect.out[[2]][1:k,]
aic <- arimaSelect.out$aic[1:k]
coeff[coeff==0] <- NA
n <- ncol(coeff)
if(missing(choix)) choix <- k
layout(matrix(c(1,1,1,2,
3,3,3,2,
3,3,3,4,
5,6,7,7),nr=4),
widths=c(10,35,45,15),
heights=c(30,30,15,15))
couleurs <- rainbow(75)[1:50]#(50)
ticks <- pretty(coeff)
par(mar=c(1,1,3,1))
plot(aic,k:1-.5,type='o',pch=21,bg='blue',cex=2,axes=F,lty=2,xpd=NA)
points(aic[choix],k-choix+.5,pch=21,cex=4,bg=2,xpd=NA)
title('aic',line=2)
par(mar=c(3,0,0,0))
plot(0,axes=F,xlab='',ylab='',xlim=range(ticks),ylim=c(.1,1))
rect(xleft = min(ticks) + (0:49)/50*(max(ticks)-min(ticks)),
xright = min(ticks) + (1:50)/50*(max(ticks)-min(ticks)),
ytop = rep(1,50),
ybottom= rep(0,50),col=couleurs,border=NA)
axis(1,ticks)
rect(xleft=min(ticks),xright=max(ticks),ytop=1,ybottom=0)
text(mean(coeff,na.rm=T),.5,'coefficients',cex=2,font=2)
par(mar=c(1,1,3,1))
image(1:n,1:k,t(coeff[k:1,]),axes=F,col=couleurs,zlim=range(ticks))
for(i in 1:n) for(j in 1:k) if(!is.na(coeff[j,i])) {
if(pval[j,i]<.01) symb = 'green'
else if( (pval[j,i]<.05) & (pval[j,i]>=.01)) symb = 'orange'
else if( (pval[j,i]<.1) & (pval[j,i]>=.05)) symb = 'red'
else symb = 'black'
polygon(c(i+.5 ,i+.2 ,i+.5 ,i+.5),
c(k-j+0.5,k-j+0.5,k-j+0.8,k-j+0.5),
col=symb)
if(j==choix) {
rect(xleft=i-.5,
xright=i+.5,
ybottom=k-j+1.5,
ytop=k-j+.5,
lwd=4)
text(i,
k-j+1,
round(coeff[j,i],2),
cex=1.2,
font=2)
}
else{
rect(xleft=i-.5,xright=i+.5,ybottom=k-j+1.5,ytop=k-j+.5)
text(i,k-j+1,round(coeff[j,i],2),cex=1.2,font=1)
}
}
axis(3,1:n,noms)
par(mar=c(0.5,0,0,0.5))
plot(0,axes=F,xlab='',ylab='',type='n',xlim=c(0,8),ylim=c(-.2,.8))
cols <- c('green','orange','red','black')
niv <- c('0','0.01','0.05','0.1')
for(i in 0:3){
polygon(c(1+2*i ,1+2*i ,1+2*i-.5 ,1+2*i),
c(.4 ,.7 , .4 , .4),
col=cols[i+1])
text(2*i,0.5,niv[i+1],cex=1.5)
}
text(8,.5,1,cex=1.5)
text(4,0,'p-value',cex=2)
box()
residus <- arimaSelect.out[[3]][[choix]]$res
par(mar=c(1,2,4,1))
acf(residus,main='')
title('acf',line=.5)
par(mar=c(1,2,4,1))
pacf(residus,main='')
title('pacf',line=.5)
par(mar=c(2,2,4,1))
qqnorm(residus,main='')
title('qq-norm',line=.5)
qqline(residus)
residus
}
if (par2 == 0) x <- log(x)
if (par2 != 0) x <- x^par2
(selection <- arimaSelect(x, order=c(par6,par3,par7), seasonal=list(order=c(par8,par4,par9), period=par5)))
bitmap(file='test1.png')
resid <- arimaSelectplot(selection)
dev.off()
resid
bitmap(file='test2.png')
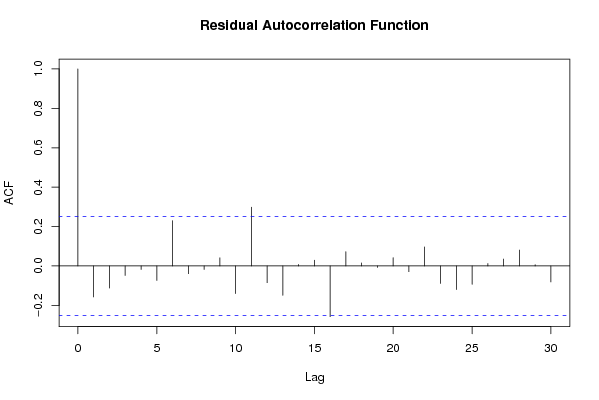
acf(resid,length(resid)/2, main='Residual Autocorrelation Function')
dev.off()
bitmap(file='test3.png')
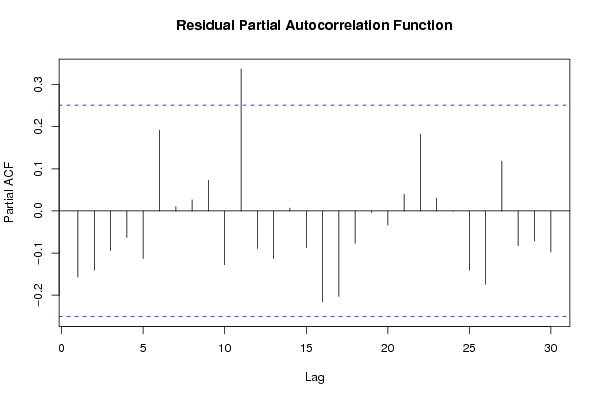
pacf(resid,length(resid)/2, main='Residual Partial Autocorrelation Function')
dev.off()
bitmap(file='test4.png')
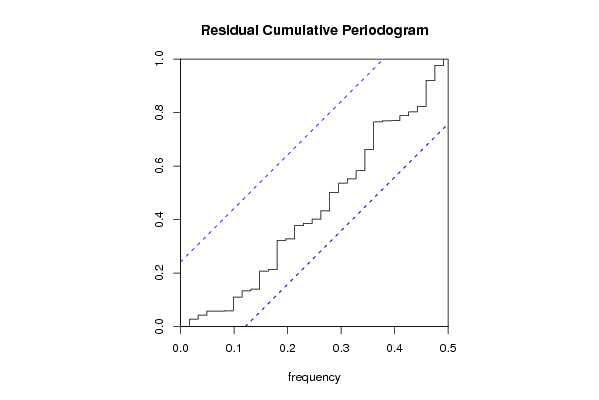
cpgram(resid, main='Residual Cumulative Periodogram')
dev.off()
bitmap(file='test5.png')
hist(resid, main='Residual Histogram', xlab='values of Residuals')
dev.off()
bitmap(file='test6.png')
densityplot(~resid,col='black',main='Residual Density Plot', xlab='values of Residuals')
dev.off()
bitmap(file='test7.png')
qqnorm(resid, main='Residual Normal Q-Q Plot')
qqline(resid)
dev.off()
ncols <- length(selection[[1]][1,])
nrows <- length(selection[[2]][,1])-1
load(file='createtable')
a<-table.start()
a<-table.row.start(a)
a<-table.element(a,'ARIMA Parameter Estimation and Backward Selection', ncols+1,TRUE)
a<-table.row.end(a)
a<-table.row.start(a)
a<-table.element(a,'Iteration', header=TRUE)
for (i in 1:ncols) {
a<-table.element(a,names(selection[[3]][[1]]$coef)[i],header=TRUE)
}
a<-table.row.end(a)
for (j in 1:nrows) {
a<-table.row.start(a)
mydum <- 'Estimates ('
mydum <- paste(mydum,j)
mydum <- paste(mydum,')')
a<-table.element(a,mydum, header=TRUE)
for (i in 1:ncols) {
a<-table.element(a,round(selection[[1]][j,i],4))
}
a<-table.row.end(a)
a<-table.row.start(a)
a<-table.element(a,'(p-val)', header=TRUE)
for (i in 1:ncols) {
mydum <- '('
mydum <- paste(mydum,round(selection[[2]][j,i],4),sep='')
mydum <- paste(mydum,')')
a<-table.element(a,mydum)
}
a<-table.row.end(a)
}
a<-table.end(a)
table.save(a,file='mytable.tab')
a<-table.start()
a<-table.row.start(a)
a<-table.element(a,'Estimated ARIMA Residuals', 1,TRUE)
a<-table.row.end(a)
a<-table.row.start(a)
a<-table.element(a,'Value', 1,TRUE)
a<-table.row.end(a)
for (i in (par4*par5+par3):length(resid)) {
a<-table.row.start(a)
a<-table.element(a,resid[i])
a<-table.row.end(a)
}
a<-table.end(a)
table.save(a,file='mytable1.tab')