Free Statistics

of Irreproducible Research!

Author's title

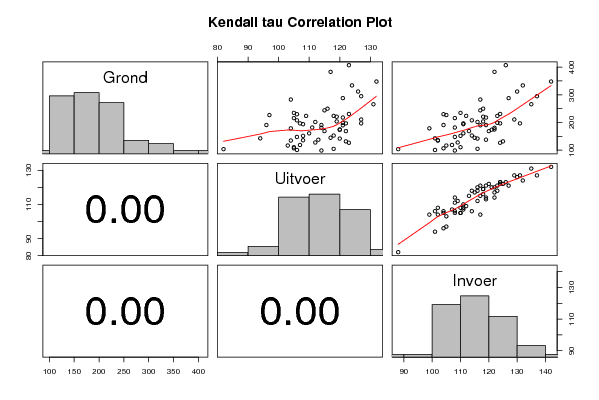
Kendall tau Correlation Plot prijsindexcijfers van de grondstoffen en de ho...

Author*The author of this computation has been verified*
R Software Modulerwasp_pairs.wasp
Title produced by softwareKendall tau Correlation Matrix
Date of computationSun, 07 Dec 2008 15:23:00 -0700
Cite this page as followsStatistical Computations at FreeStatistics.org, Office for Research Development and Education, URL https://freestatistics.org/blog/index.php?v=date/2008/Dec/07/t1228688672t1gtriyw24k2nbd.htm/, Retrieved Sun, 19 May 2024 11:11:40 +0000
Statistical Computations at FreeStatistics.org, Office for Research Development and Education, URL https://freestatistics.org/blog/index.php?pk=30327, Retrieved Sun, 19 May 2024 11:11:40 +0000
QR Codes:

Original text written by user:
IsPrivate?No (this computation is public)
User-defined keywords
Estimated Impact197
Family? (F = Feedback message, R = changed R code, M = changed R Module, P = changed Parameters, D = changed Data)
F     [Trivariate Scatterplots] [Trivariate Scatte...] [2008-11-10 21:48:17] [58bf45a666dc5198906262e8815a9722]
- RMPD    [Kendall tau Correlation Matrix] [Kendall tau Corre...] [2008-12-07 22:23:00] [63db34dadd44fb018112addcdefe949f] [Current]
Feedback Forum

Post a new message
Dataseries X:
101	106	101
104	82	88
99	114	108
105	118	116
107	105	104
111	105	110
117	103	105
119	107	107
127	123	124
128	112	109
135	104	102
132	122	125
136	108	102
143	94	101
142	120	116
153	118	114
145	117	115
138	113	119
148	106	108
152	108	110
169	122	120
169	115	113
161	110	111
174	120	121
179	104	99
191	96	104
190	121	117
182	111	108
175	120	122
181	114	122
197	107	111
194	108	111
197	127	131
216	105	108
221	119	118
218	121	119
230	106	104
227	97	105
204	119	118
197	122	124
199	121	123
208	106	114
191	114	119
202	112	116
211	127	129
224	109	112
224	118	123
231	123	124
244	115	117
235	105	110
250	116	118
266	131	135
288	121	127
283	104	117
295	127	137
312	126	130
334	124	132
348	132	142
383	117	122
407	123	126


Summary of computational transaction
Raw Inputview raw input (R code)
Raw Outputview raw output of R engine
Computing time1 seconds
R Server'Gwilym Jenkins' @ 72.249.127.135

\begin{tabular}{lllllllll}
\hline
Summary of computational transaction \tabularnewline
Raw Input & view raw input (R code)  \tabularnewline
Raw Output & view raw output of R engine  \tabularnewline
Computing time & 1 seconds \tabularnewline
R Server & 'Gwilym Jenkins' @ 72.249.127.135 \tabularnewline
\hline
\end{tabular}
%Source: https://freestatistics.org/blog/index.php?pk=30327&T=0

[TABLE]
[ROW][C]Summary of computational transaction[/C][/ROW]
[ROW][C]Raw Input[/C][C]view raw input (R code) [/C][/ROW]
[ROW][C]Raw Output[/C][C]view raw output of R engine [/C][/ROW]
[ROW][C]Computing time[/C][C]1 seconds[/C][/ROW]
[ROW][C]R Server[/C][C]'Gwilym Jenkins' @ 72.249.127.135[/C][/ROW]
[/TABLE]
Source: https://freestatistics.org/blog/index.php?pk=30327&T=0

Globally Unique Identifier (entire table): ba.freestatistics.org/blog/index.php?pk=30327&T=0

As an alternative you can also use a QR Code:  

The GUIDs for individual cells are displayed in the table below:

Summary of computational transaction
Raw Inputview raw input (R code)
Raw Outputview raw output of R engine
Computing time1 seconds
R Server'Gwilym Jenkins' @ 72.249.127.135


Kendall tau rank correlations for all pairs of data series
pairtaup-value
tau( Grond , Uitvoer )0.2678705389299270.00285858117169058
tau( Grond , Invoer )0.4016186554704927.3891881202659e-06
tau( Uitvoer , Invoer )0.7606393390267250

\begin{tabular}{lllllllll}
\hline
Kendall tau rank correlations for all pairs of data series \tabularnewline
pair & tau & p-value \tabularnewline
tau( Grond , Uitvoer ) & 0.267870538929927 & 0.00285858117169058 \tabularnewline
tau( Grond , Invoer ) & 0.401618655470492 & 7.3891881202659e-06 \tabularnewline
tau( Uitvoer , Invoer ) & 0.760639339026725 & 0 \tabularnewline
\hline
\end{tabular}
%Source: https://freestatistics.org/blog/index.php?pk=30327&T=1

[TABLE]
[ROW][C]Kendall tau rank correlations for all pairs of data series[/C][/ROW]
[ROW][C]pair[/C][C]tau[/C][C]p-value[/C][/ROW]
[ROW][C]tau( Grond , Uitvoer )[/C][C]0.267870538929927[/C][C]0.00285858117169058[/C][/ROW]
[ROW][C]tau( Grond , Invoer )[/C][C]0.401618655470492[/C][C]7.3891881202659e-06[/C][/ROW]
[ROW][C]tau( Uitvoer , Invoer )[/C][C]0.760639339026725[/C][C]0[/C][/ROW]
[/TABLE]
Source: https://freestatistics.org/blog/index.php?pk=30327&T=1

Globally Unique Identifier (entire table): ba.freestatistics.org/blog/index.php?pk=30327&T=1

As an alternative you can also use a QR Code:  

The GUIDs for individual cells are displayed in the table below:

Kendall tau rank correlations for all pairs of data series
pairtaup-value
tau( Grond , Uitvoer )0.2678705389299270.00285858117169058
tau( Grond , Invoer )0.4016186554704927.3891881202659e-06
tau( Uitvoer , Invoer )0.7606393390267250


Parameters (Session):
Parameters (R input):
R code (references can be found in the software module):
panel.tau <- function(x, y, digits=2, prefix='', cex.cor)
{
usr <- par('usr'); on.exit(par(usr))
par(usr = c(0, 1, 0, 1))
rr <- cor.test(x, y, method='kendall')
r <- round(rr$p.value,2)
txt <- format(c(r, 0.123456789), digits=digits)[1]
txt <- paste(prefix, txt, sep='')
if(missing(cex.cor)) cex <- 0.5/strwidth(txt)
text(0.5, 0.5, txt, cex = cex)
}
panel.hist <- function(x, ...)
{
usr <- par('usr'); on.exit(par(usr))
par(usr = c(usr[1:2], 0, 1.5) )
h <- hist(x, plot = FALSE)
breaks <- h$breaks; nB <- length(breaks)
y <- h$counts; y <- y/max(y)
rect(breaks[-nB], 0, breaks[-1], y, col='grey', ...)
}
bitmap(file='test1.png')
pairs(t(y),diag.panel=panel.hist, upper.panel=panel.smooth, lower.panel=panel.tau, main=main)
dev.off()
load(file='createtable')
a<-table.start()
a<-table.row.start(a)
a<-table.element(a,'Kendall tau rank correlations for all pairs of data series',3,TRUE)
a<-table.row.end(a)
a<-table.row.start(a)
a<-table.element(a,'pair',1,TRUE)
a<-table.element(a,'tau',1,TRUE)
a<-table.element(a,'p-value',1,TRUE)
a<-table.row.end(a)
n <- length(y[,1])
n
cor.test(y[1,],y[2,],method='kendall')
for (i in 1:(n-1))
{
for (j in (i+1):n)
{
a<-table.row.start(a)
dum <- paste('tau(',dimnames(t(x))[[2]][i])
dum <- paste(dum,',')
dum <- paste(dum,dimnames(t(x))[[2]][j])
dum <- paste(dum,')')
a<-table.element(a,dum,header=TRUE)
r <- cor.test(y[i,],y[j,],method='kendall')
a<-table.element(a,r$estimate)
a<-table.element(a,r$p.value)
a<-table.row.end(a)
}
}
a<-table.end(a)
table.save(a,file='mytable.tab')