Free Statistics

of Irreproducible Research!

Author's title

Author*The author of this computation has been verified*
R Software Modulerwasp_autocorrelation.wasp
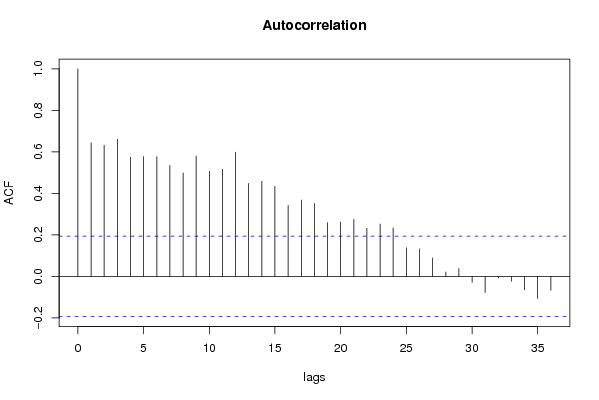
Title produced by software(Partial) Autocorrelation Function
Date of computationSun, 07 Dec 2008 12:58:05 -0700
Cite this page as followsStatistical Computations at FreeStatistics.org, Office for Research Development and Education, URL https://freestatistics.org/blog/index.php?v=date/2008/Dec/07/t1228680027hkd6cl0cnljd6k0.htm/, Retrieved Sun, 19 May 2024 09:37:20 +0000
Statistical Computations at FreeStatistics.org, Office for Research Development and Education, URL https://freestatistics.org/blog/index.php?pk=30284, Retrieved Sun, 19 May 2024 09:37:20 +0000
QR Codes:

Original text written by user:
IsPrivate?No (this computation is public)
User-defined keywords
Estimated Impact173
Family? (F = Feedback message, R = changed R code, M = changed R Module, P = changed Parameters, D = changed Data)
F     [Standard Deviation-Mean Plot] [step 1] [2008-12-06 12:33:55] [c45c87b96bbf32ffc2144fc37d767b2e]
- RMP     [(Partial) Autocorrelation Function] [acf] [2008-12-07 19:58:05] [3dc594a6c62226e1e98766c4d385bfaa] [Current]
Feedback Forum

Post a new message
Dataseries X:
3595
3914
4159
3676
3794
3446
3504
3958
3353
3480
3098
2944
3389
3497
4404
3849
3734
3060
3507
3287
3215
3764
2734
2837
2766
3851
3289
3848
3348
3682
4058
3655
3811
3341
3032
3475
3353
3186
3902
4164
3499
4145
3796
3711
3949
3740
3243
4407
4814
3908
5250
3937
4004
5560
3922
3759
4138
4634
3996
4308
4142
4429
5219
4929
5754
5592
4163
4962
5208
4755
4491
5732
5730
5024
6056
4901
5353
5578
4618
4724
5011
5298
4143
4617
4736
4214
5112
4197
4119
5104
4194
4583
3790
5557
4304
3838
4277
4951
4479
4677
4274
4782


Summary of computational transaction
Raw Inputview raw input (R code)
Raw Outputview raw output of R engine
Computing time3 seconds
R Server'Herman Ole Andreas Wold' @ 193.190.124.10:1001

\begin{tabular}{lllllllll}
\hline
Summary of computational transaction \tabularnewline
Raw Input & view raw input (R code)  \tabularnewline
Raw Output & view raw output of R engine  \tabularnewline
Computing time & 3 seconds \tabularnewline
R Server & 'Herman Ole Andreas Wold' @ 193.190.124.10:1001 \tabularnewline
\hline
\end{tabular}
%Source: https://freestatistics.org/blog/index.php?pk=30284&T=0

[TABLE]
[ROW][C]Summary of computational transaction[/C][/ROW]
[ROW][C]Raw Input[/C][C]view raw input (R code) [/C][/ROW]
[ROW][C]Raw Output[/C][C]view raw output of R engine [/C][/ROW]
[ROW][C]Computing time[/C][C]3 seconds[/C][/ROW]
[ROW][C]R Server[/C][C]'Herman Ole Andreas Wold' @ 193.190.124.10:1001[/C][/ROW]
[/TABLE]
Source: https://freestatistics.org/blog/index.php?pk=30284&T=0

Globally Unique Identifier (entire table): ba.freestatistics.org/blog/index.php?pk=30284&T=0

As an alternative you can also use a QR Code:  

The GUIDs for individual cells are displayed in the table below:

Summary of computational transaction
Raw Inputview raw input (R code)
Raw Outputview raw output of R engine
Computing time3 seconds
R Server'Herman Ole Andreas Wold' @ 193.190.124.10:1001


Autocorrelation Function
Time lag kACF(k)T-STATP-value
10.6438936.5030
20.6324276.38720
30.6609196.6750
40.5746815.8040
50.5777435.83490
60.5770585.8280
70.5344075.39720
80.4983025.03261e-06
90.5798025.85570
100.5066685.11711e-06
110.5164255.21560
120.5989796.04940
130.4481674.52638e-06
140.4586324.6325e-06
150.4343334.38651.4e-05
160.3417753.45180.000406
170.3678483.71510.000166
180.3513333.54830.000294
190.2590892.61670.005114
200.2617712.64380.004747
210.2744882.77220.00331
220.2319882.3430.010536
230.2527462.55260.006087
240.2338332.36160.010048
250.1376321.390.083775
260.1324491.33770.09199
270.0883750.89250.187102
280.0215850.2180.413933
290.0378920.38270.351371
30-0.028491-0.28770.387064
31-0.077472-0.78240.217887
32-0.006713-0.06780.473038
33-0.022909-0.23140.408745
34-0.064937-0.65580.256703
35-0.106191-1.07250.143017
36-0.066692-0.67360.251059

\begin{tabular}{lllllllll}
\hline
Autocorrelation Function \tabularnewline
Time lag k & ACF(k) & T-STAT & P-value \tabularnewline
1 & 0.643893 & 6.503 & 0 \tabularnewline
2 & 0.632427 & 6.3872 & 0 \tabularnewline
3 & 0.660919 & 6.675 & 0 \tabularnewline
4 & 0.574681 & 5.804 & 0 \tabularnewline
5 & 0.577743 & 5.8349 & 0 \tabularnewline
6 & 0.577058 & 5.828 & 0 \tabularnewline
7 & 0.534407 & 5.3972 & 0 \tabularnewline
8 & 0.498302 & 5.0326 & 1e-06 \tabularnewline
9 & 0.579802 & 5.8557 & 0 \tabularnewline
10 & 0.506668 & 5.1171 & 1e-06 \tabularnewline
11 & 0.516425 & 5.2156 & 0 \tabularnewline
12 & 0.598979 & 6.0494 & 0 \tabularnewline
13 & 0.448167 & 4.5263 & 8e-06 \tabularnewline
14 & 0.458632 & 4.632 & 5e-06 \tabularnewline
15 & 0.434333 & 4.3865 & 1.4e-05 \tabularnewline
16 & 0.341775 & 3.4518 & 0.000406 \tabularnewline
17 & 0.367848 & 3.7151 & 0.000166 \tabularnewline
18 & 0.351333 & 3.5483 & 0.000294 \tabularnewline
19 & 0.259089 & 2.6167 & 0.005114 \tabularnewline
20 & 0.261771 & 2.6438 & 0.004747 \tabularnewline
21 & 0.274488 & 2.7722 & 0.00331 \tabularnewline
22 & 0.231988 & 2.343 & 0.010536 \tabularnewline
23 & 0.252746 & 2.5526 & 0.006087 \tabularnewline
24 & 0.233833 & 2.3616 & 0.010048 \tabularnewline
25 & 0.137632 & 1.39 & 0.083775 \tabularnewline
26 & 0.132449 & 1.3377 & 0.09199 \tabularnewline
27 & 0.088375 & 0.8925 & 0.187102 \tabularnewline
28 & 0.021585 & 0.218 & 0.413933 \tabularnewline
29 & 0.037892 & 0.3827 & 0.351371 \tabularnewline
30 & -0.028491 & -0.2877 & 0.387064 \tabularnewline
31 & -0.077472 & -0.7824 & 0.217887 \tabularnewline
32 & -0.006713 & -0.0678 & 0.473038 \tabularnewline
33 & -0.022909 & -0.2314 & 0.408745 \tabularnewline
34 & -0.064937 & -0.6558 & 0.256703 \tabularnewline
35 & -0.106191 & -1.0725 & 0.143017 \tabularnewline
36 & -0.066692 & -0.6736 & 0.251059 \tabularnewline
\hline
\end{tabular}
%Source: https://freestatistics.org/blog/index.php?pk=30284&T=1

[TABLE]
[ROW][C]Autocorrelation Function[/C][/ROW]
[ROW][C]Time lag k[/C][C]ACF(k)[/C][C]T-STAT[/C][C]P-value[/C][/ROW]
[ROW][C]1[/C][C]0.643893[/C][C]6.503[/C][C]0[/C][/ROW]
[ROW][C]2[/C][C]0.632427[/C][C]6.3872[/C][C]0[/C][/ROW]
[ROW][C]3[/C][C]0.660919[/C][C]6.675[/C][C]0[/C][/ROW]
[ROW][C]4[/C][C]0.574681[/C][C]5.804[/C][C]0[/C][/ROW]
[ROW][C]5[/C][C]0.577743[/C][C]5.8349[/C][C]0[/C][/ROW]
[ROW][C]6[/C][C]0.577058[/C][C]5.828[/C][C]0[/C][/ROW]
[ROW][C]7[/C][C]0.534407[/C][C]5.3972[/C][C]0[/C][/ROW]
[ROW][C]8[/C][C]0.498302[/C][C]5.0326[/C][C]1e-06[/C][/ROW]
[ROW][C]9[/C][C]0.579802[/C][C]5.8557[/C][C]0[/C][/ROW]
[ROW][C]10[/C][C]0.506668[/C][C]5.1171[/C][C]1e-06[/C][/ROW]
[ROW][C]11[/C][C]0.516425[/C][C]5.2156[/C][C]0[/C][/ROW]
[ROW][C]12[/C][C]0.598979[/C][C]6.0494[/C][C]0[/C][/ROW]
[ROW][C]13[/C][C]0.448167[/C][C]4.5263[/C][C]8e-06[/C][/ROW]
[ROW][C]14[/C][C]0.458632[/C][C]4.632[/C][C]5e-06[/C][/ROW]
[ROW][C]15[/C][C]0.434333[/C][C]4.3865[/C][C]1.4e-05[/C][/ROW]
[ROW][C]16[/C][C]0.341775[/C][C]3.4518[/C][C]0.000406[/C][/ROW]
[ROW][C]17[/C][C]0.367848[/C][C]3.7151[/C][C]0.000166[/C][/ROW]
[ROW][C]18[/C][C]0.351333[/C][C]3.5483[/C][C]0.000294[/C][/ROW]
[ROW][C]19[/C][C]0.259089[/C][C]2.6167[/C][C]0.005114[/C][/ROW]
[ROW][C]20[/C][C]0.261771[/C][C]2.6438[/C][C]0.004747[/C][/ROW]
[ROW][C]21[/C][C]0.274488[/C][C]2.7722[/C][C]0.00331[/C][/ROW]
[ROW][C]22[/C][C]0.231988[/C][C]2.343[/C][C]0.010536[/C][/ROW]
[ROW][C]23[/C][C]0.252746[/C][C]2.5526[/C][C]0.006087[/C][/ROW]
[ROW][C]24[/C][C]0.233833[/C][C]2.3616[/C][C]0.010048[/C][/ROW]
[ROW][C]25[/C][C]0.137632[/C][C]1.39[/C][C]0.083775[/C][/ROW]
[ROW][C]26[/C][C]0.132449[/C][C]1.3377[/C][C]0.09199[/C][/ROW]
[ROW][C]27[/C][C]0.088375[/C][C]0.8925[/C][C]0.187102[/C][/ROW]
[ROW][C]28[/C][C]0.021585[/C][C]0.218[/C][C]0.413933[/C][/ROW]
[ROW][C]29[/C][C]0.037892[/C][C]0.3827[/C][C]0.351371[/C][/ROW]
[ROW][C]30[/C][C]-0.028491[/C][C]-0.2877[/C][C]0.387064[/C][/ROW]
[ROW][C]31[/C][C]-0.077472[/C][C]-0.7824[/C][C]0.217887[/C][/ROW]
[ROW][C]32[/C][C]-0.006713[/C][C]-0.0678[/C][C]0.473038[/C][/ROW]
[ROW][C]33[/C][C]-0.022909[/C][C]-0.2314[/C][C]0.408745[/C][/ROW]
[ROW][C]34[/C][C]-0.064937[/C][C]-0.6558[/C][C]0.256703[/C][/ROW]
[ROW][C]35[/C][C]-0.106191[/C][C]-1.0725[/C][C]0.143017[/C][/ROW]
[ROW][C]36[/C][C]-0.066692[/C][C]-0.6736[/C][C]0.251059[/C][/ROW]
[/TABLE]
Source: https://freestatistics.org/blog/index.php?pk=30284&T=1

Globally Unique Identifier (entire table): ba.freestatistics.org/blog/index.php?pk=30284&T=1

As an alternative you can also use a QR Code:  

The GUIDs for individual cells are displayed in the table below:

Autocorrelation Function
Time lag kACF(k)T-STATP-value
10.6438936.5030
20.6324276.38720
30.6609196.6750
40.5746815.8040
50.5777435.83490
60.5770585.8280
70.5344075.39720
80.4983025.03261e-06
90.5798025.85570
100.5066685.11711e-06
110.5164255.21560
120.5989796.04940
130.4481674.52638e-06
140.4586324.6325e-06
150.4343334.38651.4e-05
160.3417753.45180.000406
170.3678483.71510.000166
180.3513333.54830.000294
190.2590892.61670.005114
200.2617712.64380.004747
210.2744882.77220.00331
220.2319882.3430.010536
230.2527462.55260.006087
240.2338332.36160.010048
250.1376321.390.083775
260.1324491.33770.09199
270.0883750.89250.187102
280.0215850.2180.413933
290.0378920.38270.351371
30-0.028491-0.28770.387064
31-0.077472-0.78240.217887
32-0.006713-0.06780.473038
33-0.022909-0.23140.408745
34-0.064937-0.65580.256703
35-0.106191-1.07250.143017
36-0.066692-0.67360.251059


Partial Autocorrelation Function
Time lag kPACF(k)T-STATP-value
10.6438936.5030
20.3721023.7580.000143
30.3284153.31680.000631
40.0564940.57060.284775
50.0959990.96950.167285
60.0937680.9470.172936
70.030660.30960.37873
8-0.035993-0.36350.358487
90.2055712.07620.020196
10-0.003295-0.03330.486759
110.0603610.60960.271735
120.1953451.97290.025608
13-0.173472-1.7520.041391
14-0.071119-0.71830.237116
15-0.115707-1.16860.122647
16-0.164769-1.66410.049582
170.0068650.06930.472429
18-0.025143-0.25390.400031
19-0.131529-1.32840.093509
20-0.033501-0.33830.367899
21-0.057834-0.58410.280223
220.0273930.27670.391302
230.03880.39190.347989
24-0.052415-0.52940.29885
25-0.074347-0.75090.227229
26-0.095077-0.96020.169606
27-0.104538-1.05580.146781
28-0.045606-0.46060.323035
29-0.018884-0.19070.424562
30-0.094321-0.95260.171523
31-0.034268-0.34610.364993
320.1334131.34740.090417
330.1093021.10390.136119
340.0133730.13510.446416
35-0.199909-2.0190.023057
360.0938820.94820.172643

\begin{tabular}{lllllllll}
\hline
Partial Autocorrelation Function \tabularnewline
Time lag k & PACF(k) & T-STAT & P-value \tabularnewline
1 & 0.643893 & 6.503 & 0 \tabularnewline
2 & 0.372102 & 3.758 & 0.000143 \tabularnewline
3 & 0.328415 & 3.3168 & 0.000631 \tabularnewline
4 & 0.056494 & 0.5706 & 0.284775 \tabularnewline
5 & 0.095999 & 0.9695 & 0.167285 \tabularnewline
6 & 0.093768 & 0.947 & 0.172936 \tabularnewline
7 & 0.03066 & 0.3096 & 0.37873 \tabularnewline
8 & -0.035993 & -0.3635 & 0.358487 \tabularnewline
9 & 0.205571 & 2.0762 & 0.020196 \tabularnewline
10 & -0.003295 & -0.0333 & 0.486759 \tabularnewline
11 & 0.060361 & 0.6096 & 0.271735 \tabularnewline
12 & 0.195345 & 1.9729 & 0.025608 \tabularnewline
13 & -0.173472 & -1.752 & 0.041391 \tabularnewline
14 & -0.071119 & -0.7183 & 0.237116 \tabularnewline
15 & -0.115707 & -1.1686 & 0.122647 \tabularnewline
16 & -0.164769 & -1.6641 & 0.049582 \tabularnewline
17 & 0.006865 & 0.0693 & 0.472429 \tabularnewline
18 & -0.025143 & -0.2539 & 0.400031 \tabularnewline
19 & -0.131529 & -1.3284 & 0.093509 \tabularnewline
20 & -0.033501 & -0.3383 & 0.367899 \tabularnewline
21 & -0.057834 & -0.5841 & 0.280223 \tabularnewline
22 & 0.027393 & 0.2767 & 0.391302 \tabularnewline
23 & 0.0388 & 0.3919 & 0.347989 \tabularnewline
24 & -0.052415 & -0.5294 & 0.29885 \tabularnewline
25 & -0.074347 & -0.7509 & 0.227229 \tabularnewline
26 & -0.095077 & -0.9602 & 0.169606 \tabularnewline
27 & -0.104538 & -1.0558 & 0.146781 \tabularnewline
28 & -0.045606 & -0.4606 & 0.323035 \tabularnewline
29 & -0.018884 & -0.1907 & 0.424562 \tabularnewline
30 & -0.094321 & -0.9526 & 0.171523 \tabularnewline
31 & -0.034268 & -0.3461 & 0.364993 \tabularnewline
32 & 0.133413 & 1.3474 & 0.090417 \tabularnewline
33 & 0.109302 & 1.1039 & 0.136119 \tabularnewline
34 & 0.013373 & 0.1351 & 0.446416 \tabularnewline
35 & -0.199909 & -2.019 & 0.023057 \tabularnewline
36 & 0.093882 & 0.9482 & 0.172643 \tabularnewline
\hline
\end{tabular}
%Source: https://freestatistics.org/blog/index.php?pk=30284&T=2

[TABLE]
[ROW][C]Partial Autocorrelation Function[/C][/ROW]
[ROW][C]Time lag k[/C][C]PACF(k)[/C][C]T-STAT[/C][C]P-value[/C][/ROW]
[ROW][C]1[/C][C]0.643893[/C][C]6.503[/C][C]0[/C][/ROW]
[ROW][C]2[/C][C]0.372102[/C][C]3.758[/C][C]0.000143[/C][/ROW]
[ROW][C]3[/C][C]0.328415[/C][C]3.3168[/C][C]0.000631[/C][/ROW]
[ROW][C]4[/C][C]0.056494[/C][C]0.5706[/C][C]0.284775[/C][/ROW]
[ROW][C]5[/C][C]0.095999[/C][C]0.9695[/C][C]0.167285[/C][/ROW]
[ROW][C]6[/C][C]0.093768[/C][C]0.947[/C][C]0.172936[/C][/ROW]
[ROW][C]7[/C][C]0.03066[/C][C]0.3096[/C][C]0.37873[/C][/ROW]
[ROW][C]8[/C][C]-0.035993[/C][C]-0.3635[/C][C]0.358487[/C][/ROW]
[ROW][C]9[/C][C]0.205571[/C][C]2.0762[/C][C]0.020196[/C][/ROW]
[ROW][C]10[/C][C]-0.003295[/C][C]-0.0333[/C][C]0.486759[/C][/ROW]
[ROW][C]11[/C][C]0.060361[/C][C]0.6096[/C][C]0.271735[/C][/ROW]
[ROW][C]12[/C][C]0.195345[/C][C]1.9729[/C][C]0.025608[/C][/ROW]
[ROW][C]13[/C][C]-0.173472[/C][C]-1.752[/C][C]0.041391[/C][/ROW]
[ROW][C]14[/C][C]-0.071119[/C][C]-0.7183[/C][C]0.237116[/C][/ROW]
[ROW][C]15[/C][C]-0.115707[/C][C]-1.1686[/C][C]0.122647[/C][/ROW]
[ROW][C]16[/C][C]-0.164769[/C][C]-1.6641[/C][C]0.049582[/C][/ROW]
[ROW][C]17[/C][C]0.006865[/C][C]0.0693[/C][C]0.472429[/C][/ROW]
[ROW][C]18[/C][C]-0.025143[/C][C]-0.2539[/C][C]0.400031[/C][/ROW]
[ROW][C]19[/C][C]-0.131529[/C][C]-1.3284[/C][C]0.093509[/C][/ROW]
[ROW][C]20[/C][C]-0.033501[/C][C]-0.3383[/C][C]0.367899[/C][/ROW]
[ROW][C]21[/C][C]-0.057834[/C][C]-0.5841[/C][C]0.280223[/C][/ROW]
[ROW][C]22[/C][C]0.027393[/C][C]0.2767[/C][C]0.391302[/C][/ROW]
[ROW][C]23[/C][C]0.0388[/C][C]0.3919[/C][C]0.347989[/C][/ROW]
[ROW][C]24[/C][C]-0.052415[/C][C]-0.5294[/C][C]0.29885[/C][/ROW]
[ROW][C]25[/C][C]-0.074347[/C][C]-0.7509[/C][C]0.227229[/C][/ROW]
[ROW][C]26[/C][C]-0.095077[/C][C]-0.9602[/C][C]0.169606[/C][/ROW]
[ROW][C]27[/C][C]-0.104538[/C][C]-1.0558[/C][C]0.146781[/C][/ROW]
[ROW][C]28[/C][C]-0.045606[/C][C]-0.4606[/C][C]0.323035[/C][/ROW]
[ROW][C]29[/C][C]-0.018884[/C][C]-0.1907[/C][C]0.424562[/C][/ROW]
[ROW][C]30[/C][C]-0.094321[/C][C]-0.9526[/C][C]0.171523[/C][/ROW]
[ROW][C]31[/C][C]-0.034268[/C][C]-0.3461[/C][C]0.364993[/C][/ROW]
[ROW][C]32[/C][C]0.133413[/C][C]1.3474[/C][C]0.090417[/C][/ROW]
[ROW][C]33[/C][C]0.109302[/C][C]1.1039[/C][C]0.136119[/C][/ROW]
[ROW][C]34[/C][C]0.013373[/C][C]0.1351[/C][C]0.446416[/C][/ROW]
[ROW][C]35[/C][C]-0.199909[/C][C]-2.019[/C][C]0.023057[/C][/ROW]
[ROW][C]36[/C][C]0.093882[/C][C]0.9482[/C][C]0.172643[/C][/ROW]
[/TABLE]
Source: https://freestatistics.org/blog/index.php?pk=30284&T=2

Globally Unique Identifier (entire table): ba.freestatistics.org/blog/index.php?pk=30284&T=2

As an alternative you can also use a QR Code:  

The GUIDs for individual cells are displayed in the table below:

Partial Autocorrelation Function
Time lag kPACF(k)T-STATP-value
10.6438936.5030
20.3721023.7580.000143
30.3284153.31680.000631
40.0564940.57060.284775
50.0959990.96950.167285
60.0937680.9470.172936
70.030660.30960.37873
8-0.035993-0.36350.358487
90.2055712.07620.020196
10-0.003295-0.03330.486759
110.0603610.60960.271735
120.1953451.97290.025608
13-0.173472-1.7520.041391
14-0.071119-0.71830.237116
15-0.115707-1.16860.122647
16-0.164769-1.66410.049582
170.0068650.06930.472429
18-0.025143-0.25390.400031
19-0.131529-1.32840.093509
20-0.033501-0.33830.367899
21-0.057834-0.58410.280223
220.0273930.27670.391302
230.03880.39190.347989
24-0.052415-0.52940.29885
25-0.074347-0.75090.227229
26-0.095077-0.96020.169606
27-0.104538-1.05580.146781
28-0.045606-0.46060.323035
29-0.018884-0.19070.424562
30-0.094321-0.95260.171523
31-0.034268-0.34610.364993
320.1334131.34740.090417
330.1093021.10390.136119
340.0133730.13510.446416
35-0.199909-2.0190.023057
360.0938820.94820.172643


Parameters (Session):
par1 = 36 ; par2 = -0.1 ; par3 = 0 ; par4 = 0 ; par5 = 12 ;
Parameters (R input):
par1 = 36 ; par2 = -0.1 ; par3 = 0 ; par4 = 0 ; par5 = 12 ;
R code (references can be found in the software module):
if (par1 == 'Default') {
par1 = 10*log10(length(x))
} else {
par1 <- as.numeric(par1)
}
par2 <- as.numeric(par2)
par3 <- as.numeric(par3)
par4 <- as.numeric(par4)
par5 <- as.numeric(par5)
if (par2 == 0) {
x <- log(x)
} else {
x <- (x ^ par2 - 1) / par2
}
if (par3 > 0) x <- diff(x,lag=1,difference=par3)
if (par4 > 0) x <- diff(x,lag=par5,difference=par4)
bitmap(file='pic1.png')
racf <- acf(x,par1,main='Autocorrelation',xlab='lags',ylab='ACF')
dev.off()
bitmap(file='pic2.png')
rpacf <- pacf(x,par1,main='Partial Autocorrelation',xlab='lags',ylab='PACF')
dev.off()
(myacf <- c(racf$acf))
(mypacf <- c(rpacf$acf))
lengthx <- length(x)
sqrtn <- sqrt(lengthx)
load(file='createtable')
a<-table.start()
a<-table.row.start(a)
a<-table.element(a,'Autocorrelation Function',4,TRUE)
a<-table.row.end(a)
a<-table.row.start(a)
a<-table.element(a,'Time lag k',header=TRUE)
a<-table.element(a,hyperlink('basics.htm','ACF(k)','click here for more information about the Autocorrelation Function'),header=TRUE)
a<-table.element(a,'T-STAT',header=TRUE)
a<-table.element(a,'P-value',header=TRUE)
a<-table.row.end(a)
for (i in 2:(par1+1)) {
a<-table.row.start(a)
a<-table.element(a,i-1,header=TRUE)
a<-table.element(a,round(myacf[i],6))
mytstat <- myacf[i]*sqrtn
a<-table.element(a,round(mytstat,4))
a<-table.element(a,round(1-pt(abs(mytstat),lengthx),6))
a<-table.row.end(a)
}
a<-table.end(a)
table.save(a,file='mytable.tab')
a<-table.start()
a<-table.row.start(a)
a<-table.element(a,'Partial Autocorrelation Function',4,TRUE)
a<-table.row.end(a)
a<-table.row.start(a)
a<-table.element(a,'Time lag k',header=TRUE)
a<-table.element(a,hyperlink('basics.htm','PACF(k)','click here for more information about the Partial Autocorrelation Function'),header=TRUE)
a<-table.element(a,'T-STAT',header=TRUE)
a<-table.element(a,'P-value',header=TRUE)
a<-table.row.end(a)
for (i in 1:par1) {
a<-table.row.start(a)
a<-table.element(a,i,header=TRUE)
a<-table.element(a,round(mypacf[i],6))
mytstat <- mypacf[i]*sqrtn
a<-table.element(a,round(mytstat,4))
a<-table.element(a,round(1-pt(abs(mytstat),lengthx),6))
a<-table.row.end(a)
}
a<-table.end(a)
table.save(a,file='mytable1.tab')