Free Statistics

of Irreproducible Research!

Author's title

Author*The author of this computation has been verified*
R Software Modulerwasp_autocorrelation.wasp
Title produced by software(Partial) Autocorrelation Function
Date of computationSun, 07 Dec 2008 12:04:47 -0700
Cite this page as followsStatistical Computations at FreeStatistics.org, Office for Research Development and Education, URL https://freestatistics.org/blog/index.php?v=date/2008/Dec/07/t1228676738yk6pixlezaevc24.htm/, Retrieved Sun, 19 May 2024 11:37:34 +0000
Statistical Computations at FreeStatistics.org, Office for Research Development and Education, URL https://freestatistics.org/blog/index.php?pk=30253, Retrieved Sun, 19 May 2024 11:37:34 +0000
QR Codes:

Original text written by user:
IsPrivate?No (this computation is public)
User-defined keywords
Estimated Impact207
Family? (F = Feedback message, R = changed R code, M = changed R Module, P = changed Parameters, D = changed Data)
F     [Spectral Analysis] [SA] [2008-12-03 17:24:26] [bc937651ef42bf891200cf0e0edc7238]
F   P   [Spectral Analysis] [SA eigen reeks 1 ...] [2008-12-07 19:01:53] [bc937651ef42bf891200cf0e0edc7238]
F RMP       [(Partial) Autocorrelation Function] [ACF stationaire r...] [2008-12-07 19:04:47] [21d7d81e7693ad6dde5aadefb1046611] [Current]
F RMP         [ARIMA Backward Selection] [ARIMA eigen reeks] [2008-12-07 19:30:35] [bc937651ef42bf891200cf0e0edc7238]
-               [ARIMA Backward Selection] [Nieuwe arima eige...] [2008-12-15 21:09:07] [bc937651ef42bf891200cf0e0edc7238]
- RMP           [ARIMA Forecasting] [ARIMA FORECAST] [2008-12-15 23:29:01] [bc937651ef42bf891200cf0e0edc7238]
Feedback Forum
2008-12-14 21:34:49 [Bob Leysen] [reply
De student heeft het goed gedaan, maar heeft enkel een link voor ACF gemaakt. Hieronder een link met cumulatieve periuodogram

http://www.freestatistics.org/blog/index.php?v=date/2008/Dec/14/t1229290338ghn672sbijts6xb.htm

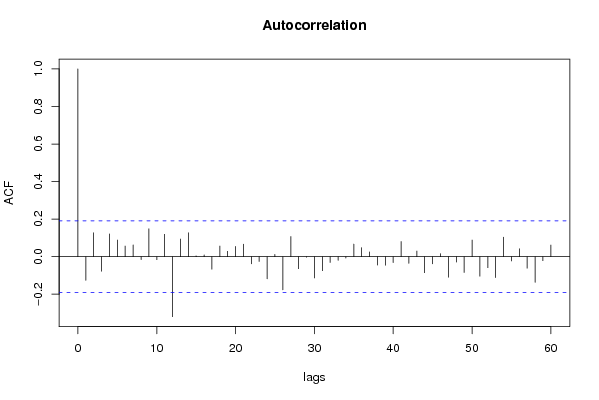
In step 3 doen we hetzelfde &als step 2 maar hier controleren we of de tijdsreeks stationair is. We stellen d=1, D=1 en lambda= 0,5 in.

We zien geen stappen of seasonaliteit meer. Deze tijdsreeks is dus stationair.
2008-12-14 21:51:42 [Bob Leysen] [reply
De student gaf een goed antwoord op step 4. Ik vat het nog even samen:

Voor het MA-proces kijken we naar de onderkant van de ACF. Voor het AR-proces zien we naar de bovenkant.

Een hoofdletter staat voor een seasonaal proces, en dan kijken we enkel naar de seasonale pieken. Een kleine letter staat voor een niet seasonaal proces en dan kijken we naar de eerste pieken.
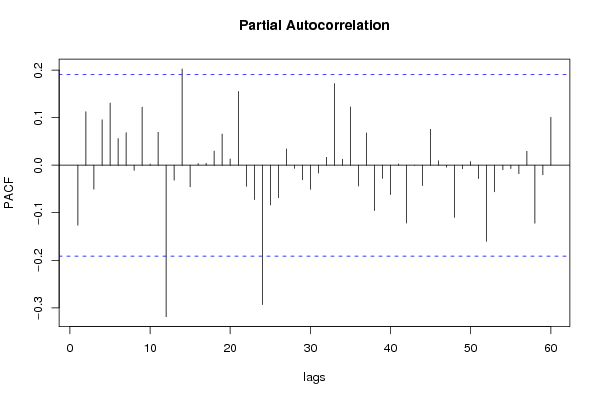
Op de partiële autocorrelatiefunctie lezen we de orde af, dit zijn de pieken die boven het betrouwbaarheidsinterval uitkomen.
2008-12-15 18:07:59 [Davy De Nef] [reply
De student vult hier voor de ACF alle gevonden waarden in. D=1, d=1 en lambda = 0,5. Deze waarden moeten ingevuld worden om de tijdreeks stationair te maken.

Er blijft geen trend of seizoenaliteit meer over. De reeks is dus stationair gemaakt.

Post a new message
Dataseries X:
206010
198112
194519
185705
180173
176142
203401
221902
197378
185001
176356
180449
180144
173666
165688
161570
156145
153730
182698
200765
176512
166618
158644
159585
163095
159044
155511
153745
150569
150605
179612
194690
189917
184128
175335
179566
181140
177876
175041
169292
166070
166972
206348
215706
202108
195411
193111
195198
198770
194163
190420
189733
186029
191531
232571
243477
227247
217859
208679
213188
216234
213586
209465
204045
200237
203666
241476
260307
243324
244460
233575
237217
235243
230354
227184
221678
217142
219452
256446
265845
248624
241114
229245
231805
219277
219313
212610
214771
211142
211457
240048
240636
230580
208795
197922
194596
194581
185686
178106
172608
167302
168053
202300
202388
182516
173476
166444
171297
169701
164182
161914
159612
151001
158114
186530
187069
174330
169362


Summary of computational transaction
Raw Inputview raw input (R code)
Raw Outputview raw output of R engine
Computing time1 seconds
R Server'Gwilym Jenkins' @ 72.249.127.135

\begin{tabular}{lllllllll}
\hline
Summary of computational transaction \tabularnewline
Raw Input & view raw input (R code)  \tabularnewline
Raw Output & view raw output of R engine  \tabularnewline
Computing time & 1 seconds \tabularnewline
R Server & 'Gwilym Jenkins' @ 72.249.127.135 \tabularnewline
\hline
\end{tabular}
%Source: https://freestatistics.org/blog/index.php?pk=30253&T=0

[TABLE]
[ROW][C]Summary of computational transaction[/C][/ROW]
[ROW][C]Raw Input[/C][C]view raw input (R code) [/C][/ROW]
[ROW][C]Raw Output[/C][C]view raw output of R engine [/C][/ROW]
[ROW][C]Computing time[/C][C]1 seconds[/C][/ROW]
[ROW][C]R Server[/C][C]'Gwilym Jenkins' @ 72.249.127.135[/C][/ROW]
[/TABLE]
Source: https://freestatistics.org/blog/index.php?pk=30253&T=0

Globally Unique Identifier (entire table): ba.freestatistics.org/blog/index.php?pk=30253&T=0

As an alternative you can also use a QR Code:  

The GUIDs for individual cells are displayed in the table below:

Summary of computational transaction
Raw Inputview raw input (R code)
Raw Outputview raw output of R engine
Computing time1 seconds
R Server'Gwilym Jenkins' @ 72.249.127.135


Autocorrelation Function
Time lag kACF(k)T-STATP-value
1-0.126187-1.2930.099418
20.1268661.30.098226
3-0.077559-0.79470.214278
40.1208281.23810.109217
50.0885580.90750.183122
60.0565870.57980.281632
70.0624170.63960.261918
8-0.015683-0.16070.436317
90.1486591.52330.065345
10-0.016136-0.16530.434494
110.1190511.21990.112615
12-0.319633-3.27530.000715
130.0936580.95970.169703
140.1268671.30.098224
150.0041650.04270.483019
160.0089520.09170.463542
17-0.066699-0.68350.247909
180.0562850.57680.28267
190.0282760.28970.386292
200.0545340.55880.288743
210.0665460.68190.248402
22-0.038354-0.3930.347556
23-0.025438-0.26070.397431
24-0.117857-1.20770.114943
250.0115990.11890.452807
26-0.176726-1.81090.036508
270.1069781.09620.13775
28-0.064261-0.65850.255836
29-0.002605-0.02670.489379
30-0.113524-1.16330.123677
31-0.074501-0.76340.223465
32-0.030701-0.31460.376848
33-0.019526-0.20010.420903
34-0.007676-0.07870.46873
350.0667970.68450.247596
360.0476330.48810.313252
370.0251440.25760.398591
38-0.044919-0.46030.323134
39-0.045247-0.46360.321933
40-0.031322-0.3210.37444
410.0801380.82120.206705
42-0.03556-0.36440.358153
430.0297930.30530.380377
44-0.085392-0.8750.191782
45-0.038174-0.39120.348235
460.0155480.15930.436861
47-0.109227-1.11920.132795
48-0.02911-0.29830.383034
49-0.084101-0.86180.195388
500.0887410.90930.182631
51-0.1038-1.06360.144967
52-0.058608-0.60050.274717
53-0.111332-1.14080.128271
540.1039351.0650.144657
55-0.022787-0.23350.407917
560.0420910.43130.333567
57-0.06149-0.63010.265005
58-0.136964-1.40350.081715
59-0.021758-0.2230.412004
600.0616380.63160.264509

\begin{tabular}{lllllllll}
\hline
Autocorrelation Function \tabularnewline
Time lag k & ACF(k) & T-STAT & P-value \tabularnewline
1 & -0.126187 & -1.293 & 0.099418 \tabularnewline
2 & 0.126866 & 1.3 & 0.098226 \tabularnewline
3 & -0.077559 & -0.7947 & 0.214278 \tabularnewline
4 & 0.120828 & 1.2381 & 0.109217 \tabularnewline
5 & 0.088558 & 0.9075 & 0.183122 \tabularnewline
6 & 0.056587 & 0.5798 & 0.281632 \tabularnewline
7 & 0.062417 & 0.6396 & 0.261918 \tabularnewline
8 & -0.015683 & -0.1607 & 0.436317 \tabularnewline
9 & 0.148659 & 1.5233 & 0.065345 \tabularnewline
10 & -0.016136 & -0.1653 & 0.434494 \tabularnewline
11 & 0.119051 & 1.2199 & 0.112615 \tabularnewline
12 & -0.319633 & -3.2753 & 0.000715 \tabularnewline
13 & 0.093658 & 0.9597 & 0.169703 \tabularnewline
14 & 0.126867 & 1.3 & 0.098224 \tabularnewline
15 & 0.004165 & 0.0427 & 0.483019 \tabularnewline
16 & 0.008952 & 0.0917 & 0.463542 \tabularnewline
17 & -0.066699 & -0.6835 & 0.247909 \tabularnewline
18 & 0.056285 & 0.5768 & 0.28267 \tabularnewline
19 & 0.028276 & 0.2897 & 0.386292 \tabularnewline
20 & 0.054534 & 0.5588 & 0.288743 \tabularnewline
21 & 0.066546 & 0.6819 & 0.248402 \tabularnewline
22 & -0.038354 & -0.393 & 0.347556 \tabularnewline
23 & -0.025438 & -0.2607 & 0.397431 \tabularnewline
24 & -0.117857 & -1.2077 & 0.114943 \tabularnewline
25 & 0.011599 & 0.1189 & 0.452807 \tabularnewline
26 & -0.176726 & -1.8109 & 0.036508 \tabularnewline
27 & 0.106978 & 1.0962 & 0.13775 \tabularnewline
28 & -0.064261 & -0.6585 & 0.255836 \tabularnewline
29 & -0.002605 & -0.0267 & 0.489379 \tabularnewline
30 & -0.113524 & -1.1633 & 0.123677 \tabularnewline
31 & -0.074501 & -0.7634 & 0.223465 \tabularnewline
32 & -0.030701 & -0.3146 & 0.376848 \tabularnewline
33 & -0.019526 & -0.2001 & 0.420903 \tabularnewline
34 & -0.007676 & -0.0787 & 0.46873 \tabularnewline
35 & 0.066797 & 0.6845 & 0.247596 \tabularnewline
36 & 0.047633 & 0.4881 & 0.313252 \tabularnewline
37 & 0.025144 & 0.2576 & 0.398591 \tabularnewline
38 & -0.044919 & -0.4603 & 0.323134 \tabularnewline
39 & -0.045247 & -0.4636 & 0.321933 \tabularnewline
40 & -0.031322 & -0.321 & 0.37444 \tabularnewline
41 & 0.080138 & 0.8212 & 0.206705 \tabularnewline
42 & -0.03556 & -0.3644 & 0.358153 \tabularnewline
43 & 0.029793 & 0.3053 & 0.380377 \tabularnewline
44 & -0.085392 & -0.875 & 0.191782 \tabularnewline
45 & -0.038174 & -0.3912 & 0.348235 \tabularnewline
46 & 0.015548 & 0.1593 & 0.436861 \tabularnewline
47 & -0.109227 & -1.1192 & 0.132795 \tabularnewline
48 & -0.02911 & -0.2983 & 0.383034 \tabularnewline
49 & -0.084101 & -0.8618 & 0.195388 \tabularnewline
50 & 0.088741 & 0.9093 & 0.182631 \tabularnewline
51 & -0.1038 & -1.0636 & 0.144967 \tabularnewline
52 & -0.058608 & -0.6005 & 0.274717 \tabularnewline
53 & -0.111332 & -1.1408 & 0.128271 \tabularnewline
54 & 0.103935 & 1.065 & 0.144657 \tabularnewline
55 & -0.022787 & -0.2335 & 0.407917 \tabularnewline
56 & 0.042091 & 0.4313 & 0.333567 \tabularnewline
57 & -0.06149 & -0.6301 & 0.265005 \tabularnewline
58 & -0.136964 & -1.4035 & 0.081715 \tabularnewline
59 & -0.021758 & -0.223 & 0.412004 \tabularnewline
60 & 0.061638 & 0.6316 & 0.264509 \tabularnewline
\hline
\end{tabular}
%Source: https://freestatistics.org/blog/index.php?pk=30253&T=1

[TABLE]
[ROW][C]Autocorrelation Function[/C][/ROW]
[ROW][C]Time lag k[/C][C]ACF(k)[/C][C]T-STAT[/C][C]P-value[/C][/ROW]
[ROW][C]1[/C][C]-0.126187[/C][C]-1.293[/C][C]0.099418[/C][/ROW]
[ROW][C]2[/C][C]0.126866[/C][C]1.3[/C][C]0.098226[/C][/ROW]
[ROW][C]3[/C][C]-0.077559[/C][C]-0.7947[/C][C]0.214278[/C][/ROW]
[ROW][C]4[/C][C]0.120828[/C][C]1.2381[/C][C]0.109217[/C][/ROW]
[ROW][C]5[/C][C]0.088558[/C][C]0.9075[/C][C]0.183122[/C][/ROW]
[ROW][C]6[/C][C]0.056587[/C][C]0.5798[/C][C]0.281632[/C][/ROW]
[ROW][C]7[/C][C]0.062417[/C][C]0.6396[/C][C]0.261918[/C][/ROW]
[ROW][C]8[/C][C]-0.015683[/C][C]-0.1607[/C][C]0.436317[/C][/ROW]
[ROW][C]9[/C][C]0.148659[/C][C]1.5233[/C][C]0.065345[/C][/ROW]
[ROW][C]10[/C][C]-0.016136[/C][C]-0.1653[/C][C]0.434494[/C][/ROW]
[ROW][C]11[/C][C]0.119051[/C][C]1.2199[/C][C]0.112615[/C][/ROW]
[ROW][C]12[/C][C]-0.319633[/C][C]-3.2753[/C][C]0.000715[/C][/ROW]
[ROW][C]13[/C][C]0.093658[/C][C]0.9597[/C][C]0.169703[/C][/ROW]
[ROW][C]14[/C][C]0.126867[/C][C]1.3[/C][C]0.098224[/C][/ROW]
[ROW][C]15[/C][C]0.004165[/C][C]0.0427[/C][C]0.483019[/C][/ROW]
[ROW][C]16[/C][C]0.008952[/C][C]0.0917[/C][C]0.463542[/C][/ROW]
[ROW][C]17[/C][C]-0.066699[/C][C]-0.6835[/C][C]0.247909[/C][/ROW]
[ROW][C]18[/C][C]0.056285[/C][C]0.5768[/C][C]0.28267[/C][/ROW]
[ROW][C]19[/C][C]0.028276[/C][C]0.2897[/C][C]0.386292[/C][/ROW]
[ROW][C]20[/C][C]0.054534[/C][C]0.5588[/C][C]0.288743[/C][/ROW]
[ROW][C]21[/C][C]0.066546[/C][C]0.6819[/C][C]0.248402[/C][/ROW]
[ROW][C]22[/C][C]-0.038354[/C][C]-0.393[/C][C]0.347556[/C][/ROW]
[ROW][C]23[/C][C]-0.025438[/C][C]-0.2607[/C][C]0.397431[/C][/ROW]
[ROW][C]24[/C][C]-0.117857[/C][C]-1.2077[/C][C]0.114943[/C][/ROW]
[ROW][C]25[/C][C]0.011599[/C][C]0.1189[/C][C]0.452807[/C][/ROW]
[ROW][C]26[/C][C]-0.176726[/C][C]-1.8109[/C][C]0.036508[/C][/ROW]
[ROW][C]27[/C][C]0.106978[/C][C]1.0962[/C][C]0.13775[/C][/ROW]
[ROW][C]28[/C][C]-0.064261[/C][C]-0.6585[/C][C]0.255836[/C][/ROW]
[ROW][C]29[/C][C]-0.002605[/C][C]-0.0267[/C][C]0.489379[/C][/ROW]
[ROW][C]30[/C][C]-0.113524[/C][C]-1.1633[/C][C]0.123677[/C][/ROW]
[ROW][C]31[/C][C]-0.074501[/C][C]-0.7634[/C][C]0.223465[/C][/ROW]
[ROW][C]32[/C][C]-0.030701[/C][C]-0.3146[/C][C]0.376848[/C][/ROW]
[ROW][C]33[/C][C]-0.019526[/C][C]-0.2001[/C][C]0.420903[/C][/ROW]
[ROW][C]34[/C][C]-0.007676[/C][C]-0.0787[/C][C]0.46873[/C][/ROW]
[ROW][C]35[/C][C]0.066797[/C][C]0.6845[/C][C]0.247596[/C][/ROW]
[ROW][C]36[/C][C]0.047633[/C][C]0.4881[/C][C]0.313252[/C][/ROW]
[ROW][C]37[/C][C]0.025144[/C][C]0.2576[/C][C]0.398591[/C][/ROW]
[ROW][C]38[/C][C]-0.044919[/C][C]-0.4603[/C][C]0.323134[/C][/ROW]
[ROW][C]39[/C][C]-0.045247[/C][C]-0.4636[/C][C]0.321933[/C][/ROW]
[ROW][C]40[/C][C]-0.031322[/C][C]-0.321[/C][C]0.37444[/C][/ROW]
[ROW][C]41[/C][C]0.080138[/C][C]0.8212[/C][C]0.206705[/C][/ROW]
[ROW][C]42[/C][C]-0.03556[/C][C]-0.3644[/C][C]0.358153[/C][/ROW]
[ROW][C]43[/C][C]0.029793[/C][C]0.3053[/C][C]0.380377[/C][/ROW]
[ROW][C]44[/C][C]-0.085392[/C][C]-0.875[/C][C]0.191782[/C][/ROW]
[ROW][C]45[/C][C]-0.038174[/C][C]-0.3912[/C][C]0.348235[/C][/ROW]
[ROW][C]46[/C][C]0.015548[/C][C]0.1593[/C][C]0.436861[/C][/ROW]
[ROW][C]47[/C][C]-0.109227[/C][C]-1.1192[/C][C]0.132795[/C][/ROW]
[ROW][C]48[/C][C]-0.02911[/C][C]-0.2983[/C][C]0.383034[/C][/ROW]
[ROW][C]49[/C][C]-0.084101[/C][C]-0.8618[/C][C]0.195388[/C][/ROW]
[ROW][C]50[/C][C]0.088741[/C][C]0.9093[/C][C]0.182631[/C][/ROW]
[ROW][C]51[/C][C]-0.1038[/C][C]-1.0636[/C][C]0.144967[/C][/ROW]
[ROW][C]52[/C][C]-0.058608[/C][C]-0.6005[/C][C]0.274717[/C][/ROW]
[ROW][C]53[/C][C]-0.111332[/C][C]-1.1408[/C][C]0.128271[/C][/ROW]
[ROW][C]54[/C][C]0.103935[/C][C]1.065[/C][C]0.144657[/C][/ROW]
[ROW][C]55[/C][C]-0.022787[/C][C]-0.2335[/C][C]0.407917[/C][/ROW]
[ROW][C]56[/C][C]0.042091[/C][C]0.4313[/C][C]0.333567[/C][/ROW]
[ROW][C]57[/C][C]-0.06149[/C][C]-0.6301[/C][C]0.265005[/C][/ROW]
[ROW][C]58[/C][C]-0.136964[/C][C]-1.4035[/C][C]0.081715[/C][/ROW]
[ROW][C]59[/C][C]-0.021758[/C][C]-0.223[/C][C]0.412004[/C][/ROW]
[ROW][C]60[/C][C]0.061638[/C][C]0.6316[/C][C]0.264509[/C][/ROW]
[/TABLE]
Source: https://freestatistics.org/blog/index.php?pk=30253&T=1

Globally Unique Identifier (entire table): ba.freestatistics.org/blog/index.php?pk=30253&T=1

As an alternative you can also use a QR Code:  

The GUIDs for individual cells are displayed in the table below:

Autocorrelation Function
Time lag kACF(k)T-STATP-value
1-0.126187-1.2930.099418
20.1268661.30.098226
3-0.077559-0.79470.214278
40.1208281.23810.109217
50.0885580.90750.183122
60.0565870.57980.281632
70.0624170.63960.261918
8-0.015683-0.16070.436317
90.1486591.52330.065345
10-0.016136-0.16530.434494
110.1190511.21990.112615
12-0.319633-3.27530.000715
130.0936580.95970.169703
140.1268671.30.098224
150.0041650.04270.483019
160.0089520.09170.463542
17-0.066699-0.68350.247909
180.0562850.57680.28267
190.0282760.28970.386292
200.0545340.55880.288743
210.0665460.68190.248402
22-0.038354-0.3930.347556
23-0.025438-0.26070.397431
24-0.117857-1.20770.114943
250.0115990.11890.452807
26-0.176726-1.81090.036508
270.1069781.09620.13775
28-0.064261-0.65850.255836
29-0.002605-0.02670.489379
30-0.113524-1.16330.123677
31-0.074501-0.76340.223465
32-0.030701-0.31460.376848
33-0.019526-0.20010.420903
34-0.007676-0.07870.46873
350.0667970.68450.247596
360.0476330.48810.313252
370.0251440.25760.398591
38-0.044919-0.46030.323134
39-0.045247-0.46360.321933
40-0.031322-0.3210.37444
410.0801380.82120.206705
42-0.03556-0.36440.358153
430.0297930.30530.380377
44-0.085392-0.8750.191782
45-0.038174-0.39120.348235
460.0155480.15930.436861
47-0.109227-1.11920.132795
48-0.02911-0.29830.383034
49-0.084101-0.86180.195388
500.0887410.90930.182631
51-0.1038-1.06360.144967
52-0.058608-0.60050.274717
53-0.111332-1.14080.128271
540.1039351.0650.144657
55-0.022787-0.23350.407917
560.0420910.43130.333567
57-0.06149-0.63010.265005
58-0.136964-1.40350.081715
59-0.021758-0.2230.412004
600.0616380.63160.264509


Partial Autocorrelation Function
Time lag kPACF(k)T-STATP-value
1-0.126187-1.2930.099418
20.1127381.15520.125312
3-0.050567-0.51820.302721
40.0955760.97940.164826
50.130711.33940.09167
60.0560550.57440.283464
70.0685590.70250.241953
8-0.010658-0.10920.456621
90.122151.25170.106736
100.0025540.02620.489586
110.0692750.70990.239683
12-0.318704-3.26570.000737
13-0.031426-0.3220.374038
140.2025882.07590.020173
15-0.045512-0.46640.320963
160.0035870.03680.485374
170.0039030.040.484087
180.0298710.30610.380071
190.0656050.67230.25145
200.0132410.13570.446166
210.1551641.590.057426
22-0.044391-0.45490.325072
23-0.072397-0.74180.229919
24-0.293344-3.00590.001656
25-0.083704-0.85770.196502
26-0.068254-0.69940.242926
270.0341910.35030.363389
28-0.006871-0.07040.472003
29-0.030833-0.31590.376335
30-0.050638-0.51890.302466
31-0.01648-0.16890.433112
320.0167560.17170.432001
330.1719611.76210.040483
340.0127810.1310.448025
350.1226211.25650.105863
36-0.04355-0.44630.328165
370.0679180.6960.243999
38-0.095442-0.9780.165163
39-0.027702-0.28390.388537
40-0.061765-0.63290.264085
410.002460.02520.48997
42-0.121659-1.24660.107653
43-0.00017-0.00170.499307
44-0.042783-0.43840.331
450.0758280.7770.21945
460.0092830.09510.462201
47-0.004215-0.04320.482814
48-0.109837-1.12550.131473
49-0.007629-0.07820.468919
500.0080280.08230.467299
51-0.028144-0.28840.38681
52-0.160238-1.6420.051796
53-0.05606-0.57440.283447
54-0.0094-0.09630.461723
55-0.006966-0.07140.471616
56-0.017753-0.18190.428
570.0293820.30110.381976
58-0.121893-1.2490.107216
59-0.020324-0.20830.417715
600.1009811.03470.151582

\begin{tabular}{lllllllll}
\hline
Partial Autocorrelation Function \tabularnewline
Time lag k & PACF(k) & T-STAT & P-value \tabularnewline
1 & -0.126187 & -1.293 & 0.099418 \tabularnewline
2 & 0.112738 & 1.1552 & 0.125312 \tabularnewline
3 & -0.050567 & -0.5182 & 0.302721 \tabularnewline
4 & 0.095576 & 0.9794 & 0.164826 \tabularnewline
5 & 0.13071 & 1.3394 & 0.09167 \tabularnewline
6 & 0.056055 & 0.5744 & 0.283464 \tabularnewline
7 & 0.068559 & 0.7025 & 0.241953 \tabularnewline
8 & -0.010658 & -0.1092 & 0.456621 \tabularnewline
9 & 0.12215 & 1.2517 & 0.106736 \tabularnewline
10 & 0.002554 & 0.0262 & 0.489586 \tabularnewline
11 & 0.069275 & 0.7099 & 0.239683 \tabularnewline
12 & -0.318704 & -3.2657 & 0.000737 \tabularnewline
13 & -0.031426 & -0.322 & 0.374038 \tabularnewline
14 & 0.202588 & 2.0759 & 0.020173 \tabularnewline
15 & -0.045512 & -0.4664 & 0.320963 \tabularnewline
16 & 0.003587 & 0.0368 & 0.485374 \tabularnewline
17 & 0.003903 & 0.04 & 0.484087 \tabularnewline
18 & 0.029871 & 0.3061 & 0.380071 \tabularnewline
19 & 0.065605 & 0.6723 & 0.25145 \tabularnewline
20 & 0.013241 & 0.1357 & 0.446166 \tabularnewline
21 & 0.155164 & 1.59 & 0.057426 \tabularnewline
22 & -0.044391 & -0.4549 & 0.325072 \tabularnewline
23 & -0.072397 & -0.7418 & 0.229919 \tabularnewline
24 & -0.293344 & -3.0059 & 0.001656 \tabularnewline
25 & -0.083704 & -0.8577 & 0.196502 \tabularnewline
26 & -0.068254 & -0.6994 & 0.242926 \tabularnewline
27 & 0.034191 & 0.3503 & 0.363389 \tabularnewline
28 & -0.006871 & -0.0704 & 0.472003 \tabularnewline
29 & -0.030833 & -0.3159 & 0.376335 \tabularnewline
30 & -0.050638 & -0.5189 & 0.302466 \tabularnewline
31 & -0.01648 & -0.1689 & 0.433112 \tabularnewline
32 & 0.016756 & 0.1717 & 0.432001 \tabularnewline
33 & 0.171961 & 1.7621 & 0.040483 \tabularnewline
34 & 0.012781 & 0.131 & 0.448025 \tabularnewline
35 & 0.122621 & 1.2565 & 0.105863 \tabularnewline
36 & -0.04355 & -0.4463 & 0.328165 \tabularnewline
37 & 0.067918 & 0.696 & 0.243999 \tabularnewline
38 & -0.095442 & -0.978 & 0.165163 \tabularnewline
39 & -0.027702 & -0.2839 & 0.388537 \tabularnewline
40 & -0.061765 & -0.6329 & 0.264085 \tabularnewline
41 & 0.00246 & 0.0252 & 0.48997 \tabularnewline
42 & -0.121659 & -1.2466 & 0.107653 \tabularnewline
43 & -0.00017 & -0.0017 & 0.499307 \tabularnewline
44 & -0.042783 & -0.4384 & 0.331 \tabularnewline
45 & 0.075828 & 0.777 & 0.21945 \tabularnewline
46 & 0.009283 & 0.0951 & 0.462201 \tabularnewline
47 & -0.004215 & -0.0432 & 0.482814 \tabularnewline
48 & -0.109837 & -1.1255 & 0.131473 \tabularnewline
49 & -0.007629 & -0.0782 & 0.468919 \tabularnewline
50 & 0.008028 & 0.0823 & 0.467299 \tabularnewline
51 & -0.028144 & -0.2884 & 0.38681 \tabularnewline
52 & -0.160238 & -1.642 & 0.051796 \tabularnewline
53 & -0.05606 & -0.5744 & 0.283447 \tabularnewline
54 & -0.0094 & -0.0963 & 0.461723 \tabularnewline
55 & -0.006966 & -0.0714 & 0.471616 \tabularnewline
56 & -0.017753 & -0.1819 & 0.428 \tabularnewline
57 & 0.029382 & 0.3011 & 0.381976 \tabularnewline
58 & -0.121893 & -1.249 & 0.107216 \tabularnewline
59 & -0.020324 & -0.2083 & 0.417715 \tabularnewline
60 & 0.100981 & 1.0347 & 0.151582 \tabularnewline
\hline
\end{tabular}
%Source: https://freestatistics.org/blog/index.php?pk=30253&T=2

[TABLE]
[ROW][C]Partial Autocorrelation Function[/C][/ROW]
[ROW][C]Time lag k[/C][C]PACF(k)[/C][C]T-STAT[/C][C]P-value[/C][/ROW]
[ROW][C]1[/C][C]-0.126187[/C][C]-1.293[/C][C]0.099418[/C][/ROW]
[ROW][C]2[/C][C]0.112738[/C][C]1.1552[/C][C]0.125312[/C][/ROW]
[ROW][C]3[/C][C]-0.050567[/C][C]-0.5182[/C][C]0.302721[/C][/ROW]
[ROW][C]4[/C][C]0.095576[/C][C]0.9794[/C][C]0.164826[/C][/ROW]
[ROW][C]5[/C][C]0.13071[/C][C]1.3394[/C][C]0.09167[/C][/ROW]
[ROW][C]6[/C][C]0.056055[/C][C]0.5744[/C][C]0.283464[/C][/ROW]
[ROW][C]7[/C][C]0.068559[/C][C]0.7025[/C][C]0.241953[/C][/ROW]
[ROW][C]8[/C][C]-0.010658[/C][C]-0.1092[/C][C]0.456621[/C][/ROW]
[ROW][C]9[/C][C]0.12215[/C][C]1.2517[/C][C]0.106736[/C][/ROW]
[ROW][C]10[/C][C]0.002554[/C][C]0.0262[/C][C]0.489586[/C][/ROW]
[ROW][C]11[/C][C]0.069275[/C][C]0.7099[/C][C]0.239683[/C][/ROW]
[ROW][C]12[/C][C]-0.318704[/C][C]-3.2657[/C][C]0.000737[/C][/ROW]
[ROW][C]13[/C][C]-0.031426[/C][C]-0.322[/C][C]0.374038[/C][/ROW]
[ROW][C]14[/C][C]0.202588[/C][C]2.0759[/C][C]0.020173[/C][/ROW]
[ROW][C]15[/C][C]-0.045512[/C][C]-0.4664[/C][C]0.320963[/C][/ROW]
[ROW][C]16[/C][C]0.003587[/C][C]0.0368[/C][C]0.485374[/C][/ROW]
[ROW][C]17[/C][C]0.003903[/C][C]0.04[/C][C]0.484087[/C][/ROW]
[ROW][C]18[/C][C]0.029871[/C][C]0.3061[/C][C]0.380071[/C][/ROW]
[ROW][C]19[/C][C]0.065605[/C][C]0.6723[/C][C]0.25145[/C][/ROW]
[ROW][C]20[/C][C]0.013241[/C][C]0.1357[/C][C]0.446166[/C][/ROW]
[ROW][C]21[/C][C]0.155164[/C][C]1.59[/C][C]0.057426[/C][/ROW]
[ROW][C]22[/C][C]-0.044391[/C][C]-0.4549[/C][C]0.325072[/C][/ROW]
[ROW][C]23[/C][C]-0.072397[/C][C]-0.7418[/C][C]0.229919[/C][/ROW]
[ROW][C]24[/C][C]-0.293344[/C][C]-3.0059[/C][C]0.001656[/C][/ROW]
[ROW][C]25[/C][C]-0.083704[/C][C]-0.8577[/C][C]0.196502[/C][/ROW]
[ROW][C]26[/C][C]-0.068254[/C][C]-0.6994[/C][C]0.242926[/C][/ROW]
[ROW][C]27[/C][C]0.034191[/C][C]0.3503[/C][C]0.363389[/C][/ROW]
[ROW][C]28[/C][C]-0.006871[/C][C]-0.0704[/C][C]0.472003[/C][/ROW]
[ROW][C]29[/C][C]-0.030833[/C][C]-0.3159[/C][C]0.376335[/C][/ROW]
[ROW][C]30[/C][C]-0.050638[/C][C]-0.5189[/C][C]0.302466[/C][/ROW]
[ROW][C]31[/C][C]-0.01648[/C][C]-0.1689[/C][C]0.433112[/C][/ROW]
[ROW][C]32[/C][C]0.016756[/C][C]0.1717[/C][C]0.432001[/C][/ROW]
[ROW][C]33[/C][C]0.171961[/C][C]1.7621[/C][C]0.040483[/C][/ROW]
[ROW][C]34[/C][C]0.012781[/C][C]0.131[/C][C]0.448025[/C][/ROW]
[ROW][C]35[/C][C]0.122621[/C][C]1.2565[/C][C]0.105863[/C][/ROW]
[ROW][C]36[/C][C]-0.04355[/C][C]-0.4463[/C][C]0.328165[/C][/ROW]
[ROW][C]37[/C][C]0.067918[/C][C]0.696[/C][C]0.243999[/C][/ROW]
[ROW][C]38[/C][C]-0.095442[/C][C]-0.978[/C][C]0.165163[/C][/ROW]
[ROW][C]39[/C][C]-0.027702[/C][C]-0.2839[/C][C]0.388537[/C][/ROW]
[ROW][C]40[/C][C]-0.061765[/C][C]-0.6329[/C][C]0.264085[/C][/ROW]
[ROW][C]41[/C][C]0.00246[/C][C]0.0252[/C][C]0.48997[/C][/ROW]
[ROW][C]42[/C][C]-0.121659[/C][C]-1.2466[/C][C]0.107653[/C][/ROW]
[ROW][C]43[/C][C]-0.00017[/C][C]-0.0017[/C][C]0.499307[/C][/ROW]
[ROW][C]44[/C][C]-0.042783[/C][C]-0.4384[/C][C]0.331[/C][/ROW]
[ROW][C]45[/C][C]0.075828[/C][C]0.777[/C][C]0.21945[/C][/ROW]
[ROW][C]46[/C][C]0.009283[/C][C]0.0951[/C][C]0.462201[/C][/ROW]
[ROW][C]47[/C][C]-0.004215[/C][C]-0.0432[/C][C]0.482814[/C][/ROW]
[ROW][C]48[/C][C]-0.109837[/C][C]-1.1255[/C][C]0.131473[/C][/ROW]
[ROW][C]49[/C][C]-0.007629[/C][C]-0.0782[/C][C]0.468919[/C][/ROW]
[ROW][C]50[/C][C]0.008028[/C][C]0.0823[/C][C]0.467299[/C][/ROW]
[ROW][C]51[/C][C]-0.028144[/C][C]-0.2884[/C][C]0.38681[/C][/ROW]
[ROW][C]52[/C][C]-0.160238[/C][C]-1.642[/C][C]0.051796[/C][/ROW]
[ROW][C]53[/C][C]-0.05606[/C][C]-0.5744[/C][C]0.283447[/C][/ROW]
[ROW][C]54[/C][C]-0.0094[/C][C]-0.0963[/C][C]0.461723[/C][/ROW]
[ROW][C]55[/C][C]-0.006966[/C][C]-0.0714[/C][C]0.471616[/C][/ROW]
[ROW][C]56[/C][C]-0.017753[/C][C]-0.1819[/C][C]0.428[/C][/ROW]
[ROW][C]57[/C][C]0.029382[/C][C]0.3011[/C][C]0.381976[/C][/ROW]
[ROW][C]58[/C][C]-0.121893[/C][C]-1.249[/C][C]0.107216[/C][/ROW]
[ROW][C]59[/C][C]-0.020324[/C][C]-0.2083[/C][C]0.417715[/C][/ROW]
[ROW][C]60[/C][C]0.100981[/C][C]1.0347[/C][C]0.151582[/C][/ROW]
[/TABLE]
Source: https://freestatistics.org/blog/index.php?pk=30253&T=2

Globally Unique Identifier (entire table): ba.freestatistics.org/blog/index.php?pk=30253&T=2

As an alternative you can also use a QR Code:  

The GUIDs for individual cells are displayed in the table below:

Partial Autocorrelation Function
Time lag kPACF(k)T-STATP-value
1-0.126187-1.2930.099418
20.1127381.15520.125312
3-0.050567-0.51820.302721
40.0955760.97940.164826
50.130711.33940.09167
60.0560550.57440.283464
70.0685590.70250.241953
8-0.010658-0.10920.456621
90.122151.25170.106736
100.0025540.02620.489586
110.0692750.70990.239683
12-0.318704-3.26570.000737
13-0.031426-0.3220.374038
140.2025882.07590.020173
15-0.045512-0.46640.320963
160.0035870.03680.485374
170.0039030.040.484087
180.0298710.30610.380071
190.0656050.67230.25145
200.0132410.13570.446166
210.1551641.590.057426
22-0.044391-0.45490.325072
23-0.072397-0.74180.229919
24-0.293344-3.00590.001656
25-0.083704-0.85770.196502
26-0.068254-0.69940.242926
270.0341910.35030.363389
28-0.006871-0.07040.472003
29-0.030833-0.31590.376335
30-0.050638-0.51890.302466
31-0.01648-0.16890.433112
320.0167560.17170.432001
330.1719611.76210.040483
340.0127810.1310.448025
350.1226211.25650.105863
36-0.04355-0.44630.328165
370.0679180.6960.243999
38-0.095442-0.9780.165163
39-0.027702-0.28390.388537
40-0.061765-0.63290.264085
410.002460.02520.48997
42-0.121659-1.24660.107653
43-0.00017-0.00170.499307
44-0.042783-0.43840.331
450.0758280.7770.21945
460.0092830.09510.462201
47-0.004215-0.04320.482814
48-0.109837-1.12550.131473
49-0.007629-0.07820.468919
500.0080280.08230.467299
51-0.028144-0.28840.38681
52-0.160238-1.6420.051796
53-0.05606-0.57440.283447
54-0.0094-0.09630.461723
55-0.006966-0.07140.471616
56-0.017753-0.18190.428
570.0293820.30110.381976
58-0.121893-1.2490.107216
59-0.020324-0.20830.417715
600.1009811.03470.151582


Parameters (Session):
par1 = 60 ; par2 = 0.5 ; par3 = 1 ; par4 = 1 ; par5 = 12 ;
Parameters (R input):
par1 = 60 ; par2 = 0.5 ; par3 = 1 ; par4 = 1 ; par5 = 12 ;
R code (references can be found in the software module):
if (par1 == 'Default') {
par1 = 10*log10(length(x))
} else {
par1 <- as.numeric(par1)
}
par2 <- as.numeric(par2)
par3 <- as.numeric(par3)
par4 <- as.numeric(par4)
par5 <- as.numeric(par5)
if (par2 == 0) {
x <- log(x)
} else {
x <- (x ^ par2 - 1) / par2
}
if (par3 > 0) x <- diff(x,lag=1,difference=par3)
if (par4 > 0) x <- diff(x,lag=par5,difference=par4)
bitmap(file='pic1.png')
racf <- acf(x,par1,main='Autocorrelation',xlab='lags',ylab='ACF')
dev.off()
bitmap(file='pic2.png')
rpacf <- pacf(x,par1,main='Partial Autocorrelation',xlab='lags',ylab='PACF')
dev.off()
(myacf <- c(racf$acf))
(mypacf <- c(rpacf$acf))
lengthx <- length(x)
sqrtn <- sqrt(lengthx)
load(file='createtable')
a<-table.start()
a<-table.row.start(a)
a<-table.element(a,'Autocorrelation Function',4,TRUE)
a<-table.row.end(a)
a<-table.row.start(a)
a<-table.element(a,'Time lag k',header=TRUE)
a<-table.element(a,hyperlink('basics.htm','ACF(k)','click here for more information about the Autocorrelation Function'),header=TRUE)
a<-table.element(a,'T-STAT',header=TRUE)
a<-table.element(a,'P-value',header=TRUE)
a<-table.row.end(a)
for (i in 2:(par1+1)) {
a<-table.row.start(a)
a<-table.element(a,i-1,header=TRUE)
a<-table.element(a,round(myacf[i],6))
mytstat <- myacf[i]*sqrtn
a<-table.element(a,round(mytstat,4))
a<-table.element(a,round(1-pt(abs(mytstat),lengthx),6))
a<-table.row.end(a)
}
a<-table.end(a)
table.save(a,file='mytable.tab')
a<-table.start()
a<-table.row.start(a)
a<-table.element(a,'Partial Autocorrelation Function',4,TRUE)
a<-table.row.end(a)
a<-table.row.start(a)
a<-table.element(a,'Time lag k',header=TRUE)
a<-table.element(a,hyperlink('basics.htm','PACF(k)','click here for more information about the Partial Autocorrelation Function'),header=TRUE)
a<-table.element(a,'T-STAT',header=TRUE)
a<-table.element(a,'P-value',header=TRUE)
a<-table.row.end(a)
for (i in 1:par1) {
a<-table.row.start(a)
a<-table.element(a,i,header=TRUE)
a<-table.element(a,round(mypacf[i],6))
mytstat <- mypacf[i]*sqrtn
a<-table.element(a,round(mytstat,4))
a<-table.element(a,round(1-pt(abs(mytstat),lengthx),6))
a<-table.row.end(a)
}
a<-table.end(a)
table.save(a,file='mytable1.tab')