Free Statistics

of Irreproducible Research!

Author's title

Author*The author of this computation has been verified*
R Software Modulerwasp_autocorrelation.wasp
Title produced by software(Partial) Autocorrelation Function
Date of computationSun, 07 Dec 2008 11:33:42 -0700
Cite this page as followsStatistical Computations at FreeStatistics.org, Office for Research Development and Education, URL https://freestatistics.org/blog/index.php?v=date/2008/Dec/07/t1228675042jzvmnewx1lclbtc.htm/, Retrieved Sun, 19 May 2024 12:02:01 +0000
Statistical Computations at FreeStatistics.org, Office for Research Development and Education, URL https://freestatistics.org/blog/index.php?pk=30231, Retrieved Sun, 19 May 2024 12:02:01 +0000
QR Codes:

Original text written by user:
IsPrivate?No (this computation is public)
User-defined keywords
Estimated Impact158
Family? (F = Feedback message, R = changed R code, M = changed R Module, P = changed Parameters, D = changed Data)
-     [Univariate Data Series] [data set] [2008-12-01 19:54:57] [b98453cac15ba1066b407e146608df68]
F RMP   [Spectral Analysis] [Spectraal analyse...] [2008-12-06 18:27:45] [a4602103a5e123497aa555277d0e627b]
- RMPD      [(Partial) Autocorrelation Function] [ACF omzet] [2008-12-07 18:33:42] [09074fbe368d26382bb94e5bb318a104] [Current]
Feedback Forum

Post a new message
Dataseries X:
35810356,5
35492936,3
38937434,1
40059102,8
37708710,2
41570965,7
36333563
34181220,1
42593543,9
43119727,6
38497690,9
45473273,4
38399780,4
38882302,6
44051120,6
41677559,9
40699203,5
44150027,6
38225518,7
35447405,7
43075518,3
42302792
39743541,7
44670641,2
37123384
37668266,4
46117528,8
42273156,4
39404153,2
45799994,5
38602505,2
39454830,1
47427901,4
46497980,9
45057149,4
50615569,2
43033396,2
46013056,5
54222266,3
46417306,4
51046271,8
51201279,6
43475288,7
44968981,1
53939345,4
54549319,7
54072107,3
58434230,1
51158751
50039368
57872617,4
51642978,8
54534465,9
56094697,8
48189983,1
47492381
52987449,1
55719803,5
53922860,5
54931231,9


Summary of computational transaction
Raw Inputview raw input (R code)
Raw Outputview raw output of R engine
Computing time1 seconds
R Server'George Udny Yule' @ 72.249.76.132

\begin{tabular}{lllllllll}
\hline
Summary of computational transaction \tabularnewline
Raw Input & view raw input (R code)  \tabularnewline
Raw Output & view raw output of R engine  \tabularnewline
Computing time & 1 seconds \tabularnewline
R Server & 'George Udny Yule' @ 72.249.76.132 \tabularnewline
\hline
\end{tabular}
%Source: https://freestatistics.org/blog/index.php?pk=30231&T=0

[TABLE]
[ROW][C]Summary of computational transaction[/C][/ROW]
[ROW][C]Raw Input[/C][C]view raw input (R code) [/C][/ROW]
[ROW][C]Raw Output[/C][C]view raw output of R engine [/C][/ROW]
[ROW][C]Computing time[/C][C]1 seconds[/C][/ROW]
[ROW][C]R Server[/C][C]'George Udny Yule' @ 72.249.76.132[/C][/ROW]
[/TABLE]
Source: https://freestatistics.org/blog/index.php?pk=30231&T=0

Globally Unique Identifier (entire table): ba.freestatistics.org/blog/index.php?pk=30231&T=0

As an alternative you can also use a QR Code:  

The GUIDs for individual cells are displayed in the table below:

Summary of computational transaction
Raw Inputview raw input (R code)
Raw Outputview raw output of R engine
Computing time1 seconds
R Server'George Udny Yule' @ 72.249.76.132


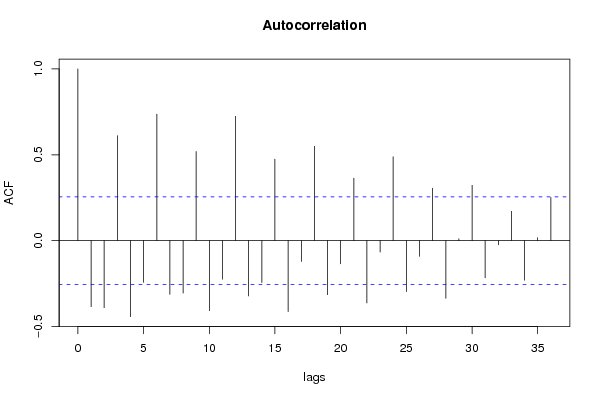
Autocorrelation Function
Time lag kACF(k)T-STATP-value
1-0.385145-2.95840.002222
2-0.390602-3.00030.001974
30.6114784.69688e-06
4-0.443026-3.40290.000602
5-0.243266-1.86860.033325
60.7367585.65910
7-0.312821-2.40280.009717
8-0.305854-2.34930.011088
90.5190943.98729.3e-05
10-0.408014-3.1340.001343
11-0.225091-1.7290.044524
120.7239135.56050
13-0.322381-2.47630.008082
14-0.244547-1.87840.032635
150.4744473.64430.000284
16-0.413719-3.17780.001181
17-0.121029-0.92960.178172
180.5492974.21924.3e-05
19-0.315019-2.41970.009317
20-0.134944-1.03650.152093
210.363352.79090.003535
22-0.363514-2.79220.003523
23-0.067102-0.51540.304093
240.488493.75220.000201
25-0.296761-2.27950.013136
26-0.091542-0.70310.242364
270.3055852.34720.011144
28-0.336275-2.5830.006147
290.0103330.07940.468503
300.3221152.47420.008124
31-0.21691-1.66610.050496
32-0.024706-0.18980.42507
330.1707621.31160.09736
34-0.230759-1.77250.040738
350.0160460.12330.451163
360.2512321.92980.029225

\begin{tabular}{lllllllll}
\hline
Autocorrelation Function \tabularnewline
Time lag k & ACF(k) & T-STAT & P-value \tabularnewline
1 & -0.385145 & -2.9584 & 0.002222 \tabularnewline
2 & -0.390602 & -3.0003 & 0.001974 \tabularnewline
3 & 0.611478 & 4.6968 & 8e-06 \tabularnewline
4 & -0.443026 & -3.4029 & 0.000602 \tabularnewline
5 & -0.243266 & -1.8686 & 0.033325 \tabularnewline
6 & 0.736758 & 5.6591 & 0 \tabularnewline
7 & -0.312821 & -2.4028 & 0.009717 \tabularnewline
8 & -0.305854 & -2.3493 & 0.011088 \tabularnewline
9 & 0.519094 & 3.9872 & 9.3e-05 \tabularnewline
10 & -0.408014 & -3.134 & 0.001343 \tabularnewline
11 & -0.225091 & -1.729 & 0.044524 \tabularnewline
12 & 0.723913 & 5.5605 & 0 \tabularnewline
13 & -0.322381 & -2.4763 & 0.008082 \tabularnewline
14 & -0.244547 & -1.8784 & 0.032635 \tabularnewline
15 & 0.474447 & 3.6443 & 0.000284 \tabularnewline
16 & -0.413719 & -3.1778 & 0.001181 \tabularnewline
17 & -0.121029 & -0.9296 & 0.178172 \tabularnewline
18 & 0.549297 & 4.2192 & 4.3e-05 \tabularnewline
19 & -0.315019 & -2.4197 & 0.009317 \tabularnewline
20 & -0.134944 & -1.0365 & 0.152093 \tabularnewline
21 & 0.36335 & 2.7909 & 0.003535 \tabularnewline
22 & -0.363514 & -2.7922 & 0.003523 \tabularnewline
23 & -0.067102 & -0.5154 & 0.304093 \tabularnewline
24 & 0.48849 & 3.7522 & 0.000201 \tabularnewline
25 & -0.296761 & -2.2795 & 0.013136 \tabularnewline
26 & -0.091542 & -0.7031 & 0.242364 \tabularnewline
27 & 0.305585 & 2.3472 & 0.011144 \tabularnewline
28 & -0.336275 & -2.583 & 0.006147 \tabularnewline
29 & 0.010333 & 0.0794 & 0.468503 \tabularnewline
30 & 0.322115 & 2.4742 & 0.008124 \tabularnewline
31 & -0.21691 & -1.6661 & 0.050496 \tabularnewline
32 & -0.024706 & -0.1898 & 0.42507 \tabularnewline
33 & 0.170762 & 1.3116 & 0.09736 \tabularnewline
34 & -0.230759 & -1.7725 & 0.040738 \tabularnewline
35 & 0.016046 & 0.1233 & 0.451163 \tabularnewline
36 & 0.251232 & 1.9298 & 0.029225 \tabularnewline
\hline
\end{tabular}
%Source: https://freestatistics.org/blog/index.php?pk=30231&T=1

[TABLE]
[ROW][C]Autocorrelation Function[/C][/ROW]
[ROW][C]Time lag k[/C][C]ACF(k)[/C][C]T-STAT[/C][C]P-value[/C][/ROW]
[ROW][C]1[/C][C]-0.385145[/C][C]-2.9584[/C][C]0.002222[/C][/ROW]
[ROW][C]2[/C][C]-0.390602[/C][C]-3.0003[/C][C]0.001974[/C][/ROW]
[ROW][C]3[/C][C]0.611478[/C][C]4.6968[/C][C]8e-06[/C][/ROW]
[ROW][C]4[/C][C]-0.443026[/C][C]-3.4029[/C][C]0.000602[/C][/ROW]
[ROW][C]5[/C][C]-0.243266[/C][C]-1.8686[/C][C]0.033325[/C][/ROW]
[ROW][C]6[/C][C]0.736758[/C][C]5.6591[/C][C]0[/C][/ROW]
[ROW][C]7[/C][C]-0.312821[/C][C]-2.4028[/C][C]0.009717[/C][/ROW]
[ROW][C]8[/C][C]-0.305854[/C][C]-2.3493[/C][C]0.011088[/C][/ROW]
[ROW][C]9[/C][C]0.519094[/C][C]3.9872[/C][C]9.3e-05[/C][/ROW]
[ROW][C]10[/C][C]-0.408014[/C][C]-3.134[/C][C]0.001343[/C][/ROW]
[ROW][C]11[/C][C]-0.225091[/C][C]-1.729[/C][C]0.044524[/C][/ROW]
[ROW][C]12[/C][C]0.723913[/C][C]5.5605[/C][C]0[/C][/ROW]
[ROW][C]13[/C][C]-0.322381[/C][C]-2.4763[/C][C]0.008082[/C][/ROW]
[ROW][C]14[/C][C]-0.244547[/C][C]-1.8784[/C][C]0.032635[/C][/ROW]
[ROW][C]15[/C][C]0.474447[/C][C]3.6443[/C][C]0.000284[/C][/ROW]
[ROW][C]16[/C][C]-0.413719[/C][C]-3.1778[/C][C]0.001181[/C][/ROW]
[ROW][C]17[/C][C]-0.121029[/C][C]-0.9296[/C][C]0.178172[/C][/ROW]
[ROW][C]18[/C][C]0.549297[/C][C]4.2192[/C][C]4.3e-05[/C][/ROW]
[ROW][C]19[/C][C]-0.315019[/C][C]-2.4197[/C][C]0.009317[/C][/ROW]
[ROW][C]20[/C][C]-0.134944[/C][C]-1.0365[/C][C]0.152093[/C][/ROW]
[ROW][C]21[/C][C]0.36335[/C][C]2.7909[/C][C]0.003535[/C][/ROW]
[ROW][C]22[/C][C]-0.363514[/C][C]-2.7922[/C][C]0.003523[/C][/ROW]
[ROW][C]23[/C][C]-0.067102[/C][C]-0.5154[/C][C]0.304093[/C][/ROW]
[ROW][C]24[/C][C]0.48849[/C][C]3.7522[/C][C]0.000201[/C][/ROW]
[ROW][C]25[/C][C]-0.296761[/C][C]-2.2795[/C][C]0.013136[/C][/ROW]
[ROW][C]26[/C][C]-0.091542[/C][C]-0.7031[/C][C]0.242364[/C][/ROW]
[ROW][C]27[/C][C]0.305585[/C][C]2.3472[/C][C]0.011144[/C][/ROW]
[ROW][C]28[/C][C]-0.336275[/C][C]-2.583[/C][C]0.006147[/C][/ROW]
[ROW][C]29[/C][C]0.010333[/C][C]0.0794[/C][C]0.468503[/C][/ROW]
[ROW][C]30[/C][C]0.322115[/C][C]2.4742[/C][C]0.008124[/C][/ROW]
[ROW][C]31[/C][C]-0.21691[/C][C]-1.6661[/C][C]0.050496[/C][/ROW]
[ROW][C]32[/C][C]-0.024706[/C][C]-0.1898[/C][C]0.42507[/C][/ROW]
[ROW][C]33[/C][C]0.170762[/C][C]1.3116[/C][C]0.09736[/C][/ROW]
[ROW][C]34[/C][C]-0.230759[/C][C]-1.7725[/C][C]0.040738[/C][/ROW]
[ROW][C]35[/C][C]0.016046[/C][C]0.1233[/C][C]0.451163[/C][/ROW]
[ROW][C]36[/C][C]0.251232[/C][C]1.9298[/C][C]0.029225[/C][/ROW]
[/TABLE]
Source: https://freestatistics.org/blog/index.php?pk=30231&T=1

Globally Unique Identifier (entire table): ba.freestatistics.org/blog/index.php?pk=30231&T=1

As an alternative you can also use a QR Code:  

The GUIDs for individual cells are displayed in the table below:

Autocorrelation Function
Time lag kACF(k)T-STATP-value
1-0.385145-2.95840.002222
2-0.390602-3.00030.001974
30.6114784.69688e-06
4-0.443026-3.40290.000602
5-0.243266-1.86860.033325
60.7367585.65910
7-0.312821-2.40280.009717
8-0.305854-2.34930.011088
90.5190943.98729.3e-05
10-0.408014-3.1340.001343
11-0.225091-1.7290.044524
120.7239135.56050
13-0.322381-2.47630.008082
14-0.244547-1.87840.032635
150.4744473.64430.000284
16-0.413719-3.17780.001181
17-0.121029-0.92960.178172
180.5492974.21924.3e-05
19-0.315019-2.41970.009317
20-0.134944-1.03650.152093
210.363352.79090.003535
22-0.363514-2.79220.003523
23-0.067102-0.51540.304093
240.488493.75220.000201
25-0.296761-2.27950.013136
26-0.091542-0.70310.242364
270.3055852.34720.011144
28-0.336275-2.5830.006147
290.0103330.07940.468503
300.3221152.47420.008124
31-0.21691-1.66610.050496
32-0.024706-0.18980.42507
330.1707621.31160.09736
34-0.230759-1.77250.040738
350.0160460.12330.451163
360.2512321.92980.029225


Partial Autocorrelation Function
Time lag kPACF(k)T-STATP-value
1-0.385145-2.95840.002222
2-0.632807-4.86075e-06
30.2391581.8370.035624
4-0.513795-3.94650.000107
5-0.43504-3.34160.000725
60.1424841.09440.139105
70.181471.39390.084288
8-0.057821-0.44410.329286
9-0.031765-0.2440.404041
10-0.190917-1.46650.073917
11-0.290947-2.23480.014615
120.1434751.1020.137458
130.0762160.58540.280246
140.1215440.93360.177158
15-0.05251-0.40330.344079
16-0.021206-0.16290.435582
170.1018250.78210.218633
18-0.088256-0.67790.250239
19-0.179513-1.37890.086571
20-0.120783-0.92780.178659
21-0.152957-1.17490.122381
22-0.08414-0.64630.260299
23-0.062914-0.48320.315353
240.0110120.08460.46644
25-0.045427-0.34890.364192
26-0.043186-0.33170.37064
27-0.140749-1.08110.142023
28-0.065277-0.50140.308976
29-0.017204-0.13210.447658
30-0.219712-1.68760.04838
310.0267440.20540.418973
320.005540.04260.483101
33-0.020578-0.15810.437473
340.0164150.12610.450046
35-0.035443-0.27220.393192
36-0.05137-0.39460.347286

\begin{tabular}{lllllllll}
\hline
Partial Autocorrelation Function \tabularnewline
Time lag k & PACF(k) & T-STAT & P-value \tabularnewline
1 & -0.385145 & -2.9584 & 0.002222 \tabularnewline
2 & -0.632807 & -4.8607 & 5e-06 \tabularnewline
3 & 0.239158 & 1.837 & 0.035624 \tabularnewline
4 & -0.513795 & -3.9465 & 0.000107 \tabularnewline
5 & -0.43504 & -3.3416 & 0.000725 \tabularnewline
6 & 0.142484 & 1.0944 & 0.139105 \tabularnewline
7 & 0.18147 & 1.3939 & 0.084288 \tabularnewline
8 & -0.057821 & -0.4441 & 0.329286 \tabularnewline
9 & -0.031765 & -0.244 & 0.404041 \tabularnewline
10 & -0.190917 & -1.4665 & 0.073917 \tabularnewline
11 & -0.290947 & -2.2348 & 0.014615 \tabularnewline
12 & 0.143475 & 1.102 & 0.137458 \tabularnewline
13 & 0.076216 & 0.5854 & 0.280246 \tabularnewline
14 & 0.121544 & 0.9336 & 0.177158 \tabularnewline
15 & -0.05251 & -0.4033 & 0.344079 \tabularnewline
16 & -0.021206 & -0.1629 & 0.435582 \tabularnewline
17 & 0.101825 & 0.7821 & 0.218633 \tabularnewline
18 & -0.088256 & -0.6779 & 0.250239 \tabularnewline
19 & -0.179513 & -1.3789 & 0.086571 \tabularnewline
20 & -0.120783 & -0.9278 & 0.178659 \tabularnewline
21 & -0.152957 & -1.1749 & 0.122381 \tabularnewline
22 & -0.08414 & -0.6463 & 0.260299 \tabularnewline
23 & -0.062914 & -0.4832 & 0.315353 \tabularnewline
24 & 0.011012 & 0.0846 & 0.46644 \tabularnewline
25 & -0.045427 & -0.3489 & 0.364192 \tabularnewline
26 & -0.043186 & -0.3317 & 0.37064 \tabularnewline
27 & -0.140749 & -1.0811 & 0.142023 \tabularnewline
28 & -0.065277 & -0.5014 & 0.308976 \tabularnewline
29 & -0.017204 & -0.1321 & 0.447658 \tabularnewline
30 & -0.219712 & -1.6876 & 0.04838 \tabularnewline
31 & 0.026744 & 0.2054 & 0.418973 \tabularnewline
32 & 0.00554 & 0.0426 & 0.483101 \tabularnewline
33 & -0.020578 & -0.1581 & 0.437473 \tabularnewline
34 & 0.016415 & 0.1261 & 0.450046 \tabularnewline
35 & -0.035443 & -0.2722 & 0.393192 \tabularnewline
36 & -0.05137 & -0.3946 & 0.347286 \tabularnewline
\hline
\end{tabular}
%Source: https://freestatistics.org/blog/index.php?pk=30231&T=2

[TABLE]
[ROW][C]Partial Autocorrelation Function[/C][/ROW]
[ROW][C]Time lag k[/C][C]PACF(k)[/C][C]T-STAT[/C][C]P-value[/C][/ROW]
[ROW][C]1[/C][C]-0.385145[/C][C]-2.9584[/C][C]0.002222[/C][/ROW]
[ROW][C]2[/C][C]-0.632807[/C][C]-4.8607[/C][C]5e-06[/C][/ROW]
[ROW][C]3[/C][C]0.239158[/C][C]1.837[/C][C]0.035624[/C][/ROW]
[ROW][C]4[/C][C]-0.513795[/C][C]-3.9465[/C][C]0.000107[/C][/ROW]
[ROW][C]5[/C][C]-0.43504[/C][C]-3.3416[/C][C]0.000725[/C][/ROW]
[ROW][C]6[/C][C]0.142484[/C][C]1.0944[/C][C]0.139105[/C][/ROW]
[ROW][C]7[/C][C]0.18147[/C][C]1.3939[/C][C]0.084288[/C][/ROW]
[ROW][C]8[/C][C]-0.057821[/C][C]-0.4441[/C][C]0.329286[/C][/ROW]
[ROW][C]9[/C][C]-0.031765[/C][C]-0.244[/C][C]0.404041[/C][/ROW]
[ROW][C]10[/C][C]-0.190917[/C][C]-1.4665[/C][C]0.073917[/C][/ROW]
[ROW][C]11[/C][C]-0.290947[/C][C]-2.2348[/C][C]0.014615[/C][/ROW]
[ROW][C]12[/C][C]0.143475[/C][C]1.102[/C][C]0.137458[/C][/ROW]
[ROW][C]13[/C][C]0.076216[/C][C]0.5854[/C][C]0.280246[/C][/ROW]
[ROW][C]14[/C][C]0.121544[/C][C]0.9336[/C][C]0.177158[/C][/ROW]
[ROW][C]15[/C][C]-0.05251[/C][C]-0.4033[/C][C]0.344079[/C][/ROW]
[ROW][C]16[/C][C]-0.021206[/C][C]-0.1629[/C][C]0.435582[/C][/ROW]
[ROW][C]17[/C][C]0.101825[/C][C]0.7821[/C][C]0.218633[/C][/ROW]
[ROW][C]18[/C][C]-0.088256[/C][C]-0.6779[/C][C]0.250239[/C][/ROW]
[ROW][C]19[/C][C]-0.179513[/C][C]-1.3789[/C][C]0.086571[/C][/ROW]
[ROW][C]20[/C][C]-0.120783[/C][C]-0.9278[/C][C]0.178659[/C][/ROW]
[ROW][C]21[/C][C]-0.152957[/C][C]-1.1749[/C][C]0.122381[/C][/ROW]
[ROW][C]22[/C][C]-0.08414[/C][C]-0.6463[/C][C]0.260299[/C][/ROW]
[ROW][C]23[/C][C]-0.062914[/C][C]-0.4832[/C][C]0.315353[/C][/ROW]
[ROW][C]24[/C][C]0.011012[/C][C]0.0846[/C][C]0.46644[/C][/ROW]
[ROW][C]25[/C][C]-0.045427[/C][C]-0.3489[/C][C]0.364192[/C][/ROW]
[ROW][C]26[/C][C]-0.043186[/C][C]-0.3317[/C][C]0.37064[/C][/ROW]
[ROW][C]27[/C][C]-0.140749[/C][C]-1.0811[/C][C]0.142023[/C][/ROW]
[ROW][C]28[/C][C]-0.065277[/C][C]-0.5014[/C][C]0.308976[/C][/ROW]
[ROW][C]29[/C][C]-0.017204[/C][C]-0.1321[/C][C]0.447658[/C][/ROW]
[ROW][C]30[/C][C]-0.219712[/C][C]-1.6876[/C][C]0.04838[/C][/ROW]
[ROW][C]31[/C][C]0.026744[/C][C]0.2054[/C][C]0.418973[/C][/ROW]
[ROW][C]32[/C][C]0.00554[/C][C]0.0426[/C][C]0.483101[/C][/ROW]
[ROW][C]33[/C][C]-0.020578[/C][C]-0.1581[/C][C]0.437473[/C][/ROW]
[ROW][C]34[/C][C]0.016415[/C][C]0.1261[/C][C]0.450046[/C][/ROW]
[ROW][C]35[/C][C]-0.035443[/C][C]-0.2722[/C][C]0.393192[/C][/ROW]
[ROW][C]36[/C][C]-0.05137[/C][C]-0.3946[/C][C]0.347286[/C][/ROW]
[/TABLE]
Source: https://freestatistics.org/blog/index.php?pk=30231&T=2

Globally Unique Identifier (entire table): ba.freestatistics.org/blog/index.php?pk=30231&T=2

As an alternative you can also use a QR Code:  

The GUIDs for individual cells are displayed in the table below:

Partial Autocorrelation Function
Time lag kPACF(k)T-STATP-value
1-0.385145-2.95840.002222
2-0.632807-4.86075e-06
30.2391581.8370.035624
4-0.513795-3.94650.000107
5-0.43504-3.34160.000725
60.1424841.09440.139105
70.181471.39390.084288
8-0.057821-0.44410.329286
9-0.031765-0.2440.404041
10-0.190917-1.46650.073917
11-0.290947-2.23480.014615
120.1434751.1020.137458
130.0762160.58540.280246
140.1215440.93360.177158
15-0.05251-0.40330.344079
16-0.021206-0.16290.435582
170.1018250.78210.218633
18-0.088256-0.67790.250239
19-0.179513-1.37890.086571
20-0.120783-0.92780.178659
21-0.152957-1.17490.122381
22-0.08414-0.64630.260299
23-0.062914-0.48320.315353
240.0110120.08460.46644
25-0.045427-0.34890.364192
26-0.043186-0.33170.37064
27-0.140749-1.08110.142023
28-0.065277-0.50140.308976
29-0.017204-0.13210.447658
30-0.219712-1.68760.04838
310.0267440.20540.418973
320.005540.04260.483101
33-0.020578-0.15810.437473
340.0164150.12610.450046
35-0.035443-0.27220.393192
36-0.05137-0.39460.347286


Parameters (Session):
par1 = 36 ; par2 = 1 ; par3 = 1 ; par4 = 0 ; par5 = 12 ;
Parameters (R input):
par1 = 36 ; par2 = 1 ; par3 = 1 ; par4 = 0 ; par5 = 12 ;
R code (references can be found in the software module):
if (par1 == 'Default') {
par1 = 10*log10(length(x))
} else {
par1 <- as.numeric(par1)
}
par2 <- as.numeric(par2)
par3 <- as.numeric(par3)
par4 <- as.numeric(par4)
par5 <- as.numeric(par5)
if (par2 == 0) {
x <- log(x)
} else {
x <- (x ^ par2 - 1) / par2
}
if (par3 > 0) x <- diff(x,lag=1,difference=par3)
if (par4 > 0) x <- diff(x,lag=par5,difference=par4)
bitmap(file='pic1.png')
racf <- acf(x,par1,main='Autocorrelation',xlab='lags',ylab='ACF')
dev.off()
bitmap(file='pic2.png')
rpacf <- pacf(x,par1,main='Partial Autocorrelation',xlab='lags',ylab='PACF')
dev.off()
(myacf <- c(racf$acf))
(mypacf <- c(rpacf$acf))
lengthx <- length(x)
sqrtn <- sqrt(lengthx)
load(file='createtable')
a<-table.start()
a<-table.row.start(a)
a<-table.element(a,'Autocorrelation Function',4,TRUE)
a<-table.row.end(a)
a<-table.row.start(a)
a<-table.element(a,'Time lag k',header=TRUE)
a<-table.element(a,hyperlink('basics.htm','ACF(k)','click here for more information about the Autocorrelation Function'),header=TRUE)
a<-table.element(a,'T-STAT',header=TRUE)
a<-table.element(a,'P-value',header=TRUE)
a<-table.row.end(a)
for (i in 2:(par1+1)) {
a<-table.row.start(a)
a<-table.element(a,i-1,header=TRUE)
a<-table.element(a,round(myacf[i],6))
mytstat <- myacf[i]*sqrtn
a<-table.element(a,round(mytstat,4))
a<-table.element(a,round(1-pt(abs(mytstat),lengthx),6))
a<-table.row.end(a)
}
a<-table.end(a)
table.save(a,file='mytable.tab')
a<-table.start()
a<-table.row.start(a)
a<-table.element(a,'Partial Autocorrelation Function',4,TRUE)
a<-table.row.end(a)
a<-table.row.start(a)
a<-table.element(a,'Time lag k',header=TRUE)
a<-table.element(a,hyperlink('basics.htm','PACF(k)','click here for more information about the Partial Autocorrelation Function'),header=TRUE)
a<-table.element(a,'T-STAT',header=TRUE)
a<-table.element(a,'P-value',header=TRUE)
a<-table.row.end(a)
for (i in 1:par1) {
a<-table.row.start(a)
a<-table.element(a,i,header=TRUE)
a<-table.element(a,round(mypacf[i],6))
mytstat <- mypacf[i]*sqrtn
a<-table.element(a,round(mytstat,4))
a<-table.element(a,round(1-pt(abs(mytstat),lengthx),6))
a<-table.row.end(a)
}
a<-table.end(a)
table.save(a,file='mytable1.tab')