Free Statistics

of Irreproducible Research!

Author's title

Author*Unverified author*
R Software Modulerwasp_autocorrelation.wasp
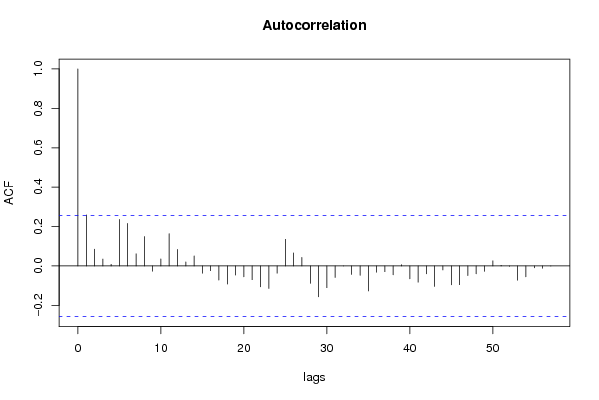
Title produced by software(Partial) Autocorrelation Function
Date of computationSun, 07 Dec 2008 11:31:16 -0700
Cite this page as followsStatistical Computations at FreeStatistics.org, Office for Research Development and Education, URL https://freestatistics.org/blog/index.php?v=date/2008/Dec/07/t1228674701y6mk3hxqgqtrnnx.htm/, Retrieved Sun, 19 May 2024 08:52:56 +0000
Statistical Computations at FreeStatistics.org, Office for Research Development and Education, URL https://freestatistics.org/blog/index.php?pk=30224, Retrieved Sun, 19 May 2024 08:52:56 +0000
QR Codes:

Original text written by user:
IsPrivate?No (this computation is public)
User-defined keywords
Estimated Impact186
Family? (F = Feedback message, R = changed R code, M = changed R Module, P = changed Parameters, D = changed Data)
-     [Univariate Data Series] [data set] [2008-12-01 19:54:57] [b98453cac15ba1066b407e146608df68]
-   PD  [Univariate Data Series] [part 1] [2008-12-07 17:49:27] [74be16979710d4c4e7c6647856088456]
F RMPD    [Variance Reduction Matrix] [part 2] [2008-12-07 18:05:04] [74be16979710d4c4e7c6647856088456]
F RMP       [(Partial) Autocorrelation Function] [] [2008-12-07 18:08:51] [74be16979710d4c4e7c6647856088456]
F   P           [(Partial) Autocorrelation Function] [part 3] [2008-12-07 18:31:16] [d41d8cd98f00b204e9800998ecf8427e] [Current]
- RMP             [ARIMA Backward Selection] [eigen reeks stap 5] [2008-12-14 16:19:21] [b1bd16d1f47bfe13feacf1c27a0abba5]
Feedback Forum
2008-12-14 17:19:51 [Jasmine Hendrikx] [reply
Evaluatie stap 3 ACF:
De berekening is goed uitgevoerd en de conclusie is ook goed. Er is duidelijk geen trend meer aanwezig en er is ook geen seizoenaliteit in terug te vinden. Buiten 1 coëfficiënt vallen alle coëfficiënten binnen het betrouwbaarheidsinterval.
2008-12-14 17:25:25 [Jasmine Hendrikx] [reply
Evaluatie stap 4:
Deze vraag is niet besproken, omdat de student niet begreep hoe je de ARMA processen moet aflezen.
Om een AR proces te ontdekken, moeten we kijken naar typische patronen in de ACF. Naar de allereerste staaf (lag 0) moeten we niet kijken. We kijken naar de eerste vier, vijf staafjes. We zien in de ACF positieve staafjes met een snelle convergentie naar 0.Voor de orde van het AR proces moeten we naar de PACF kijken. We kijken hoeveel van de eerste coëfficiënten significant zijn. Als we naar de eerste vier kijken, zien we dat er 1 staafje significant is, daarom stellen we p gelijk aan 1. Om P te bepalen, kijken we ook naar de ACF. We zien in de seizoenale autocorrelatiecoëfficiënten geen specifiek patroon dat gelijkt op een theoretisch patroon, daarom stellen we P dus gelijk aan 0. Om te besluiten of er een MA proces aanwezig is, moet er gekeken worden naar de PACF. We zien hier geen patroon in, vandaar dat we q gelijkstellen aan 0. Om een SMA proces te ontdekken, moeten we ook kijken naar de PACF. Om te kijken welke orde het is, kijken we weer naar de ACF . We zien in de PACF echter geen SMA proces, vandaar dat we Q gelijkstellen aan 0.

Er zou ook nog gebruik moeten gemaakt worden van het spectrum, maar dit heeft de student echter niet gedaan.
Hier kunnen we de volgende vuistregel bij vermelden:
Indien het cumulatief periodogram van de tijdreeks een afwijking vertoont aan de bovenkant van de diagonaal, dan is het zeer waarschijnlijk dat we een AR proces zullen moeten gebruiken. Wanneer we echter een afwijking onderaan hebben, duidt dit op een MA proces.

Vraag 5 is ook niet opgelost, omdat de student vraag 4 niet kon oplossen, maar eigenlijk kon je deze wel oplossen. Je moet gebruik maken van de Backward Selection Method en dan bij d=1 en D=0 invullen, bij lambda 1 (is reeds berekend in vorige stappen) en bij de andere parameters P, p, q en Q vul je gewoon steeds het maximum in. Het model dat de computer dan berekend, kun je dan vergelijken met het model dat je zelf hebt opgesteld in vraag 4. Vervolgens moet je gaan bekijken of de computer een goed model heeft berekend door te kijken of de assumpties van de residu’s vervuld zijn. Hieronder is de URL: http://www.freestatistics.org/blog/index.php?v=date/2008/Dec/14/t1229272108kser6cv4pjpgea1.htm

2008-12-16 15:59:46 [Kelly Deckx] [reply
Bedankt! Dit heeft mij enorm goed geholpen!

Post a new message
Dataseries X:
2174.56
2196.72
2350.44
2440.25
2408.64
2472.81
2407.6
2454.62
2448.05
2497.84
2645.64
2756.76
2849.27
2921.44
2981.85
3080.58
3106.22
3119.31
3061.26
3097.31
3161.69
3257.16
3277.01
3295.32
3363.99
3494.17
3667.03
3813.06
3917.96
3895.51
3801.06
3570.12
3701.61
3862.27
3970.1
4138.52
4199.75
4290.89
4443.91
4502.64
4356.98
4591.27
4696.96
4621.4
4562.84
4202.52
4296.49
4435.23
4105.18
4116.68
3844.49
3720.98
3674.4
3857.62
3801.06
3504.37
3032.6
3047.03
2962.34


Summary of computational transaction
Raw Inputview raw input (R code)
Raw Outputview raw output of R engine
Computing time2 seconds
R Server'Herman Ole Andreas Wold' @ 193.190.124.10:1001

\begin{tabular}{lllllllll}
\hline
Summary of computational transaction \tabularnewline
Raw Input & view raw input (R code)  \tabularnewline
Raw Output & view raw output of R engine  \tabularnewline
Computing time & 2 seconds \tabularnewline
R Server & 'Herman Ole Andreas Wold' @ 193.190.124.10:1001 \tabularnewline
\hline
\end{tabular}
%Source: https://freestatistics.org/blog/index.php?pk=30224&T=0

[TABLE]
[ROW][C]Summary of computational transaction[/C][/ROW]
[ROW][C]Raw Input[/C][C]view raw input (R code) [/C][/ROW]
[ROW][C]Raw Output[/C][C]view raw output of R engine [/C][/ROW]
[ROW][C]Computing time[/C][C]2 seconds[/C][/ROW]
[ROW][C]R Server[/C][C]'Herman Ole Andreas Wold' @ 193.190.124.10:1001[/C][/ROW]
[/TABLE]
Source: https://freestatistics.org/blog/index.php?pk=30224&T=0

Globally Unique Identifier (entire table): ba.freestatistics.org/blog/index.php?pk=30224&T=0

As an alternative you can also use a QR Code:  

The GUIDs for individual cells are displayed in the table below:

Summary of computational transaction
Raw Inputview raw input (R code)
Raw Outputview raw output of R engine
Computing time2 seconds
R Server'Herman Ole Andreas Wold' @ 193.190.124.10:1001


Autocorrelation Function
Time lag kACF(k)T-STATP-value
10.2592331.97430.02656
20.084850.64620.26035
30.034980.26640.395437
40.0084760.06460.474375
50.2361671.79860.038644
60.2159571.64470.052723
70.0615550.46880.320488
80.149011.13480.130558
9-0.026477-0.20160.420451
100.0359140.27350.392715
110.1635911.24590.10891
120.0840110.63980.262408
130.0206640.15740.437749
140.0506450.38570.350564
15-0.036802-0.28030.390132
16-0.024185-0.18420.427255
17-0.071697-0.5460.29357
18-0.091841-0.69940.243537
19-0.046511-0.35420.36223
20-0.054993-0.41880.338448
21-0.069724-0.5310.298724
22-0.105923-0.80670.211571
23-0.113867-0.86720.194707
24-0.036833-0.28050.390042
250.1353771.0310.15341
260.0658250.50130.309026
270.0433270.330.371306
28-0.088228-0.67190.25215
29-0.156507-1.19190.119073
30-0.110645-0.84260.201444
31-0.058206-0.44330.329604
320.0001189e-040.499644
33-0.043275-0.32960.371455
34-0.047442-0.36130.359591
35-0.126941-0.96680.168841
36-0.031449-0.23950.405778
37-0.028998-0.22080.412994
38-0.045087-0.34340.366279
390.0065710.050.480131
40-0.065289-0.49720.310455
41-0.082597-0.6290.265897
42-0.040143-0.30570.380455
43-0.103841-0.79080.216132
44-0.020279-0.15440.4389
45-0.095563-0.72780.234837
46-0.09499-0.72340.236165
47-0.048861-0.37210.355583
48-0.039709-0.30240.381708
49-0.027472-0.20920.417506
500.0259880.19790.421899
510.003370.02570.489806
52-0.00193-0.01470.494162
53-0.072058-0.54880.292632
54-0.055387-0.42180.33736
55-0.009655-0.07350.470818
56-0.011521-0.08770.465192
57-0.000706-0.00540.497866
58NANANA
59NANANA
60NANANA

\begin{tabular}{lllllllll}
\hline
Autocorrelation Function \tabularnewline
Time lag k & ACF(k) & T-STAT & P-value \tabularnewline
1 & 0.259233 & 1.9743 & 0.02656 \tabularnewline
2 & 0.08485 & 0.6462 & 0.26035 \tabularnewline
3 & 0.03498 & 0.2664 & 0.395437 \tabularnewline
4 & 0.008476 & 0.0646 & 0.474375 \tabularnewline
5 & 0.236167 & 1.7986 & 0.038644 \tabularnewline
6 & 0.215957 & 1.6447 & 0.052723 \tabularnewline
7 & 0.061555 & 0.4688 & 0.320488 \tabularnewline
8 & 0.14901 & 1.1348 & 0.130558 \tabularnewline
9 & -0.026477 & -0.2016 & 0.420451 \tabularnewline
10 & 0.035914 & 0.2735 & 0.392715 \tabularnewline
11 & 0.163591 & 1.2459 & 0.10891 \tabularnewline
12 & 0.084011 & 0.6398 & 0.262408 \tabularnewline
13 & 0.020664 & 0.1574 & 0.437749 \tabularnewline
14 & 0.050645 & 0.3857 & 0.350564 \tabularnewline
15 & -0.036802 & -0.2803 & 0.390132 \tabularnewline
16 & -0.024185 & -0.1842 & 0.427255 \tabularnewline
17 & -0.071697 & -0.546 & 0.29357 \tabularnewline
18 & -0.091841 & -0.6994 & 0.243537 \tabularnewline
19 & -0.046511 & -0.3542 & 0.36223 \tabularnewline
20 & -0.054993 & -0.4188 & 0.338448 \tabularnewline
21 & -0.069724 & -0.531 & 0.298724 \tabularnewline
22 & -0.105923 & -0.8067 & 0.211571 \tabularnewline
23 & -0.113867 & -0.8672 & 0.194707 \tabularnewline
24 & -0.036833 & -0.2805 & 0.390042 \tabularnewline
25 & 0.135377 & 1.031 & 0.15341 \tabularnewline
26 & 0.065825 & 0.5013 & 0.309026 \tabularnewline
27 & 0.043327 & 0.33 & 0.371306 \tabularnewline
28 & -0.088228 & -0.6719 & 0.25215 \tabularnewline
29 & -0.156507 & -1.1919 & 0.119073 \tabularnewline
30 & -0.110645 & -0.8426 & 0.201444 \tabularnewline
31 & -0.058206 & -0.4433 & 0.329604 \tabularnewline
32 & 0.000118 & 9e-04 & 0.499644 \tabularnewline
33 & -0.043275 & -0.3296 & 0.371455 \tabularnewline
34 & -0.047442 & -0.3613 & 0.359591 \tabularnewline
35 & -0.126941 & -0.9668 & 0.168841 \tabularnewline
36 & -0.031449 & -0.2395 & 0.405778 \tabularnewline
37 & -0.028998 & -0.2208 & 0.412994 \tabularnewline
38 & -0.045087 & -0.3434 & 0.366279 \tabularnewline
39 & 0.006571 & 0.05 & 0.480131 \tabularnewline
40 & -0.065289 & -0.4972 & 0.310455 \tabularnewline
41 & -0.082597 & -0.629 & 0.265897 \tabularnewline
42 & -0.040143 & -0.3057 & 0.380455 \tabularnewline
43 & -0.103841 & -0.7908 & 0.216132 \tabularnewline
44 & -0.020279 & -0.1544 & 0.4389 \tabularnewline
45 & -0.095563 & -0.7278 & 0.234837 \tabularnewline
46 & -0.09499 & -0.7234 & 0.236165 \tabularnewline
47 & -0.048861 & -0.3721 & 0.355583 \tabularnewline
48 & -0.039709 & -0.3024 & 0.381708 \tabularnewline
49 & -0.027472 & -0.2092 & 0.417506 \tabularnewline
50 & 0.025988 & 0.1979 & 0.421899 \tabularnewline
51 & 0.00337 & 0.0257 & 0.489806 \tabularnewline
52 & -0.00193 & -0.0147 & 0.494162 \tabularnewline
53 & -0.072058 & -0.5488 & 0.292632 \tabularnewline
54 & -0.055387 & -0.4218 & 0.33736 \tabularnewline
55 & -0.009655 & -0.0735 & 0.470818 \tabularnewline
56 & -0.011521 & -0.0877 & 0.465192 \tabularnewline
57 & -0.000706 & -0.0054 & 0.497866 \tabularnewline
58 & NA & NA & NA \tabularnewline
59 & NA & NA & NA \tabularnewline
60 & NA & NA & NA \tabularnewline
\hline
\end{tabular}
%Source: https://freestatistics.org/blog/index.php?pk=30224&T=1

[TABLE]
[ROW][C]Autocorrelation Function[/C][/ROW]
[ROW][C]Time lag k[/C][C]ACF(k)[/C][C]T-STAT[/C][C]P-value[/C][/ROW]
[ROW][C]1[/C][C]0.259233[/C][C]1.9743[/C][C]0.02656[/C][/ROW]
[ROW][C]2[/C][C]0.08485[/C][C]0.6462[/C][C]0.26035[/C][/ROW]
[ROW][C]3[/C][C]0.03498[/C][C]0.2664[/C][C]0.395437[/C][/ROW]
[ROW][C]4[/C][C]0.008476[/C][C]0.0646[/C][C]0.474375[/C][/ROW]
[ROW][C]5[/C][C]0.236167[/C][C]1.7986[/C][C]0.038644[/C][/ROW]
[ROW][C]6[/C][C]0.215957[/C][C]1.6447[/C][C]0.052723[/C][/ROW]
[ROW][C]7[/C][C]0.061555[/C][C]0.4688[/C][C]0.320488[/C][/ROW]
[ROW][C]8[/C][C]0.14901[/C][C]1.1348[/C][C]0.130558[/C][/ROW]
[ROW][C]9[/C][C]-0.026477[/C][C]-0.2016[/C][C]0.420451[/C][/ROW]
[ROW][C]10[/C][C]0.035914[/C][C]0.2735[/C][C]0.392715[/C][/ROW]
[ROW][C]11[/C][C]0.163591[/C][C]1.2459[/C][C]0.10891[/C][/ROW]
[ROW][C]12[/C][C]0.084011[/C][C]0.6398[/C][C]0.262408[/C][/ROW]
[ROW][C]13[/C][C]0.020664[/C][C]0.1574[/C][C]0.437749[/C][/ROW]
[ROW][C]14[/C][C]0.050645[/C][C]0.3857[/C][C]0.350564[/C][/ROW]
[ROW][C]15[/C][C]-0.036802[/C][C]-0.2803[/C][C]0.390132[/C][/ROW]
[ROW][C]16[/C][C]-0.024185[/C][C]-0.1842[/C][C]0.427255[/C][/ROW]
[ROW][C]17[/C][C]-0.071697[/C][C]-0.546[/C][C]0.29357[/C][/ROW]
[ROW][C]18[/C][C]-0.091841[/C][C]-0.6994[/C][C]0.243537[/C][/ROW]
[ROW][C]19[/C][C]-0.046511[/C][C]-0.3542[/C][C]0.36223[/C][/ROW]
[ROW][C]20[/C][C]-0.054993[/C][C]-0.4188[/C][C]0.338448[/C][/ROW]
[ROW][C]21[/C][C]-0.069724[/C][C]-0.531[/C][C]0.298724[/C][/ROW]
[ROW][C]22[/C][C]-0.105923[/C][C]-0.8067[/C][C]0.211571[/C][/ROW]
[ROW][C]23[/C][C]-0.113867[/C][C]-0.8672[/C][C]0.194707[/C][/ROW]
[ROW][C]24[/C][C]-0.036833[/C][C]-0.2805[/C][C]0.390042[/C][/ROW]
[ROW][C]25[/C][C]0.135377[/C][C]1.031[/C][C]0.15341[/C][/ROW]
[ROW][C]26[/C][C]0.065825[/C][C]0.5013[/C][C]0.309026[/C][/ROW]
[ROW][C]27[/C][C]0.043327[/C][C]0.33[/C][C]0.371306[/C][/ROW]
[ROW][C]28[/C][C]-0.088228[/C][C]-0.6719[/C][C]0.25215[/C][/ROW]
[ROW][C]29[/C][C]-0.156507[/C][C]-1.1919[/C][C]0.119073[/C][/ROW]
[ROW][C]30[/C][C]-0.110645[/C][C]-0.8426[/C][C]0.201444[/C][/ROW]
[ROW][C]31[/C][C]-0.058206[/C][C]-0.4433[/C][C]0.329604[/C][/ROW]
[ROW][C]32[/C][C]0.000118[/C][C]9e-04[/C][C]0.499644[/C][/ROW]
[ROW][C]33[/C][C]-0.043275[/C][C]-0.3296[/C][C]0.371455[/C][/ROW]
[ROW][C]34[/C][C]-0.047442[/C][C]-0.3613[/C][C]0.359591[/C][/ROW]
[ROW][C]35[/C][C]-0.126941[/C][C]-0.9668[/C][C]0.168841[/C][/ROW]
[ROW][C]36[/C][C]-0.031449[/C][C]-0.2395[/C][C]0.405778[/C][/ROW]
[ROW][C]37[/C][C]-0.028998[/C][C]-0.2208[/C][C]0.412994[/C][/ROW]
[ROW][C]38[/C][C]-0.045087[/C][C]-0.3434[/C][C]0.366279[/C][/ROW]
[ROW][C]39[/C][C]0.006571[/C][C]0.05[/C][C]0.480131[/C][/ROW]
[ROW][C]40[/C][C]-0.065289[/C][C]-0.4972[/C][C]0.310455[/C][/ROW]
[ROW][C]41[/C][C]-0.082597[/C][C]-0.629[/C][C]0.265897[/C][/ROW]
[ROW][C]42[/C][C]-0.040143[/C][C]-0.3057[/C][C]0.380455[/C][/ROW]
[ROW][C]43[/C][C]-0.103841[/C][C]-0.7908[/C][C]0.216132[/C][/ROW]
[ROW][C]44[/C][C]-0.020279[/C][C]-0.1544[/C][C]0.4389[/C][/ROW]
[ROW][C]45[/C][C]-0.095563[/C][C]-0.7278[/C][C]0.234837[/C][/ROW]
[ROW][C]46[/C][C]-0.09499[/C][C]-0.7234[/C][C]0.236165[/C][/ROW]
[ROW][C]47[/C][C]-0.048861[/C][C]-0.3721[/C][C]0.355583[/C][/ROW]
[ROW][C]48[/C][C]-0.039709[/C][C]-0.3024[/C][C]0.381708[/C][/ROW]
[ROW][C]49[/C][C]-0.027472[/C][C]-0.2092[/C][C]0.417506[/C][/ROW]
[ROW][C]50[/C][C]0.025988[/C][C]0.1979[/C][C]0.421899[/C][/ROW]
[ROW][C]51[/C][C]0.00337[/C][C]0.0257[/C][C]0.489806[/C][/ROW]
[ROW][C]52[/C][C]-0.00193[/C][C]-0.0147[/C][C]0.494162[/C][/ROW]
[ROW][C]53[/C][C]-0.072058[/C][C]-0.5488[/C][C]0.292632[/C][/ROW]
[ROW][C]54[/C][C]-0.055387[/C][C]-0.4218[/C][C]0.33736[/C][/ROW]
[ROW][C]55[/C][C]-0.009655[/C][C]-0.0735[/C][C]0.470818[/C][/ROW]
[ROW][C]56[/C][C]-0.011521[/C][C]-0.0877[/C][C]0.465192[/C][/ROW]
[ROW][C]57[/C][C]-0.000706[/C][C]-0.0054[/C][C]0.497866[/C][/ROW]
[ROW][C]58[/C][C]NA[/C][C]NA[/C][C]NA[/C][/ROW]
[ROW][C]59[/C][C]NA[/C][C]NA[/C][C]NA[/C][/ROW]
[ROW][C]60[/C][C]NA[/C][C]NA[/C][C]NA[/C][/ROW]
[/TABLE]
Source: https://freestatistics.org/blog/index.php?pk=30224&T=1

Globally Unique Identifier (entire table): ba.freestatistics.org/blog/index.php?pk=30224&T=1

As an alternative you can also use a QR Code:  

The GUIDs for individual cells are displayed in the table below:

Autocorrelation Function
Time lag kACF(k)T-STATP-value
10.2592331.97430.02656
20.084850.64620.26035
30.034980.26640.395437
40.0084760.06460.474375
50.2361671.79860.038644
60.2159571.64470.052723
70.0615550.46880.320488
80.149011.13480.130558
9-0.026477-0.20160.420451
100.0359140.27350.392715
110.1635911.24590.10891
120.0840110.63980.262408
130.0206640.15740.437749
140.0506450.38570.350564
15-0.036802-0.28030.390132
16-0.024185-0.18420.427255
17-0.071697-0.5460.29357
18-0.091841-0.69940.243537
19-0.046511-0.35420.36223
20-0.054993-0.41880.338448
21-0.069724-0.5310.298724
22-0.105923-0.80670.211571
23-0.113867-0.86720.194707
24-0.036833-0.28050.390042
250.1353771.0310.15341
260.0658250.50130.309026
270.0433270.330.371306
28-0.088228-0.67190.25215
29-0.156507-1.19190.119073
30-0.110645-0.84260.201444
31-0.058206-0.44330.329604
320.0001189e-040.499644
33-0.043275-0.32960.371455
34-0.047442-0.36130.359591
35-0.126941-0.96680.168841
36-0.031449-0.23950.405778
37-0.028998-0.22080.412994
38-0.045087-0.34340.366279
390.0065710.050.480131
40-0.065289-0.49720.310455
41-0.082597-0.6290.265897
42-0.040143-0.30570.380455
43-0.103841-0.79080.216132
44-0.020279-0.15440.4389
45-0.095563-0.72780.234837
46-0.09499-0.72340.236165
47-0.048861-0.37210.355583
48-0.039709-0.30240.381708
49-0.027472-0.20920.417506
500.0259880.19790.421899
510.003370.02570.489806
52-0.00193-0.01470.494162
53-0.072058-0.54880.292632
54-0.055387-0.42180.33736
55-0.009655-0.07350.470818
56-0.011521-0.08770.465192
57-0.000706-0.00540.497866
58NANANA
59NANANA
60NANANA


Partial Autocorrelation Function
Time lag kPACF(k)T-STATP-value
10.2592331.97430.02656
20.018920.14410.442965
30.0091110.06940.472459
4-0.004488-0.03420.486425
50.2506761.90910.030601
60.1100170.83790.202774
7-0.043724-0.3330.370169
80.1407871.07220.144035
9-0.092938-0.70780.240955
100.0138230.10530.458261
110.1028870.78360.218242
120.0086190.06560.473944
13-0.086142-0.6560.257196
140.0586680.44680.32834
15-0.035712-0.2720.393303
16-0.107381-0.81780.208412
17-0.09101-0.69310.245503
18-0.055618-0.42360.33672
19-0.06619-0.50410.308054
20-0.035801-0.27270.393043
21-0.007706-0.05870.476702
22-0.102226-0.77850.21971
23-0.021667-0.1650.434755
240.0686610.52290.301517
250.2090541.59210.058399
260.0326890.2490.402139
270.1103160.84010.202139
28-0.026333-0.20050.420878
29-0.091426-0.69630.244517
30-0.100086-0.76220.224505
31-0.063506-0.48360.315228
32-0.02964-0.22570.411101
33-0.111386-0.84830.199882
340.0638590.48630.31428
35-0.139255-1.06050.146648
360.0188910.14390.443052
37-0.050446-0.38420.351124
38-0.034652-0.26390.396396
390.0062140.04730.481208
40-0.00576-0.04390.482579
410.0149430.11380.454893
420.0222620.16950.432979
430.0167090.12730.449591
440.0503730.38360.351328
45-0.068156-0.51910.302846
46-0.013534-0.10310.459129
470.0099560.07580.46991
48-0.009631-0.07330.470891
49-0.005571-0.04240.483153
50-0.024096-0.18350.427519
51-0.002502-0.01910.492431
52-0.096507-0.7350.232658
53-0.080465-0.61280.271201
54-0.000454-0.00350.498627
550.0180950.13780.445435
560.0207370.15790.437532
570.02510.19120.424534
58NANANA
59NANANA
60NANANA

\begin{tabular}{lllllllll}
\hline
Partial Autocorrelation Function \tabularnewline
Time lag k & PACF(k) & T-STAT & P-value \tabularnewline
1 & 0.259233 & 1.9743 & 0.02656 \tabularnewline
2 & 0.01892 & 0.1441 & 0.442965 \tabularnewline
3 & 0.009111 & 0.0694 & 0.472459 \tabularnewline
4 & -0.004488 & -0.0342 & 0.486425 \tabularnewline
5 & 0.250676 & 1.9091 & 0.030601 \tabularnewline
6 & 0.110017 & 0.8379 & 0.202774 \tabularnewline
7 & -0.043724 & -0.333 & 0.370169 \tabularnewline
8 & 0.140787 & 1.0722 & 0.144035 \tabularnewline
9 & -0.092938 & -0.7078 & 0.240955 \tabularnewline
10 & 0.013823 & 0.1053 & 0.458261 \tabularnewline
11 & 0.102887 & 0.7836 & 0.218242 \tabularnewline
12 & 0.008619 & 0.0656 & 0.473944 \tabularnewline
13 & -0.086142 & -0.656 & 0.257196 \tabularnewline
14 & 0.058668 & 0.4468 & 0.32834 \tabularnewline
15 & -0.035712 & -0.272 & 0.393303 \tabularnewline
16 & -0.107381 & -0.8178 & 0.208412 \tabularnewline
17 & -0.09101 & -0.6931 & 0.245503 \tabularnewline
18 & -0.055618 & -0.4236 & 0.33672 \tabularnewline
19 & -0.06619 & -0.5041 & 0.308054 \tabularnewline
20 & -0.035801 & -0.2727 & 0.393043 \tabularnewline
21 & -0.007706 & -0.0587 & 0.476702 \tabularnewline
22 & -0.102226 & -0.7785 & 0.21971 \tabularnewline
23 & -0.021667 & -0.165 & 0.434755 \tabularnewline
24 & 0.068661 & 0.5229 & 0.301517 \tabularnewline
25 & 0.209054 & 1.5921 & 0.058399 \tabularnewline
26 & 0.032689 & 0.249 & 0.402139 \tabularnewline
27 & 0.110316 & 0.8401 & 0.202139 \tabularnewline
28 & -0.026333 & -0.2005 & 0.420878 \tabularnewline
29 & -0.091426 & -0.6963 & 0.244517 \tabularnewline
30 & -0.100086 & -0.7622 & 0.224505 \tabularnewline
31 & -0.063506 & -0.4836 & 0.315228 \tabularnewline
32 & -0.02964 & -0.2257 & 0.411101 \tabularnewline
33 & -0.111386 & -0.8483 & 0.199882 \tabularnewline
34 & 0.063859 & 0.4863 & 0.31428 \tabularnewline
35 & -0.139255 & -1.0605 & 0.146648 \tabularnewline
36 & 0.018891 & 0.1439 & 0.443052 \tabularnewline
37 & -0.050446 & -0.3842 & 0.351124 \tabularnewline
38 & -0.034652 & -0.2639 & 0.396396 \tabularnewline
39 & 0.006214 & 0.0473 & 0.481208 \tabularnewline
40 & -0.00576 & -0.0439 & 0.482579 \tabularnewline
41 & 0.014943 & 0.1138 & 0.454893 \tabularnewline
42 & 0.022262 & 0.1695 & 0.432979 \tabularnewline
43 & 0.016709 & 0.1273 & 0.449591 \tabularnewline
44 & 0.050373 & 0.3836 & 0.351328 \tabularnewline
45 & -0.068156 & -0.5191 & 0.302846 \tabularnewline
46 & -0.013534 & -0.1031 & 0.459129 \tabularnewline
47 & 0.009956 & 0.0758 & 0.46991 \tabularnewline
48 & -0.009631 & -0.0733 & 0.470891 \tabularnewline
49 & -0.005571 & -0.0424 & 0.483153 \tabularnewline
50 & -0.024096 & -0.1835 & 0.427519 \tabularnewline
51 & -0.002502 & -0.0191 & 0.492431 \tabularnewline
52 & -0.096507 & -0.735 & 0.232658 \tabularnewline
53 & -0.080465 & -0.6128 & 0.271201 \tabularnewline
54 & -0.000454 & -0.0035 & 0.498627 \tabularnewline
55 & 0.018095 & 0.1378 & 0.445435 \tabularnewline
56 & 0.020737 & 0.1579 & 0.437532 \tabularnewline
57 & 0.0251 & 0.1912 & 0.424534 \tabularnewline
58 & NA & NA & NA \tabularnewline
59 & NA & NA & NA \tabularnewline
60 & NA & NA & NA \tabularnewline
\hline
\end{tabular}
%Source: https://freestatistics.org/blog/index.php?pk=30224&T=2

[TABLE]
[ROW][C]Partial Autocorrelation Function[/C][/ROW]
[ROW][C]Time lag k[/C][C]PACF(k)[/C][C]T-STAT[/C][C]P-value[/C][/ROW]
[ROW][C]1[/C][C]0.259233[/C][C]1.9743[/C][C]0.02656[/C][/ROW]
[ROW][C]2[/C][C]0.01892[/C][C]0.1441[/C][C]0.442965[/C][/ROW]
[ROW][C]3[/C][C]0.009111[/C][C]0.0694[/C][C]0.472459[/C][/ROW]
[ROW][C]4[/C][C]-0.004488[/C][C]-0.0342[/C][C]0.486425[/C][/ROW]
[ROW][C]5[/C][C]0.250676[/C][C]1.9091[/C][C]0.030601[/C][/ROW]
[ROW][C]6[/C][C]0.110017[/C][C]0.8379[/C][C]0.202774[/C][/ROW]
[ROW][C]7[/C][C]-0.043724[/C][C]-0.333[/C][C]0.370169[/C][/ROW]
[ROW][C]8[/C][C]0.140787[/C][C]1.0722[/C][C]0.144035[/C][/ROW]
[ROW][C]9[/C][C]-0.092938[/C][C]-0.7078[/C][C]0.240955[/C][/ROW]
[ROW][C]10[/C][C]0.013823[/C][C]0.1053[/C][C]0.458261[/C][/ROW]
[ROW][C]11[/C][C]0.102887[/C][C]0.7836[/C][C]0.218242[/C][/ROW]
[ROW][C]12[/C][C]0.008619[/C][C]0.0656[/C][C]0.473944[/C][/ROW]
[ROW][C]13[/C][C]-0.086142[/C][C]-0.656[/C][C]0.257196[/C][/ROW]
[ROW][C]14[/C][C]0.058668[/C][C]0.4468[/C][C]0.32834[/C][/ROW]
[ROW][C]15[/C][C]-0.035712[/C][C]-0.272[/C][C]0.393303[/C][/ROW]
[ROW][C]16[/C][C]-0.107381[/C][C]-0.8178[/C][C]0.208412[/C][/ROW]
[ROW][C]17[/C][C]-0.09101[/C][C]-0.6931[/C][C]0.245503[/C][/ROW]
[ROW][C]18[/C][C]-0.055618[/C][C]-0.4236[/C][C]0.33672[/C][/ROW]
[ROW][C]19[/C][C]-0.06619[/C][C]-0.5041[/C][C]0.308054[/C][/ROW]
[ROW][C]20[/C][C]-0.035801[/C][C]-0.2727[/C][C]0.393043[/C][/ROW]
[ROW][C]21[/C][C]-0.007706[/C][C]-0.0587[/C][C]0.476702[/C][/ROW]
[ROW][C]22[/C][C]-0.102226[/C][C]-0.7785[/C][C]0.21971[/C][/ROW]
[ROW][C]23[/C][C]-0.021667[/C][C]-0.165[/C][C]0.434755[/C][/ROW]
[ROW][C]24[/C][C]0.068661[/C][C]0.5229[/C][C]0.301517[/C][/ROW]
[ROW][C]25[/C][C]0.209054[/C][C]1.5921[/C][C]0.058399[/C][/ROW]
[ROW][C]26[/C][C]0.032689[/C][C]0.249[/C][C]0.402139[/C][/ROW]
[ROW][C]27[/C][C]0.110316[/C][C]0.8401[/C][C]0.202139[/C][/ROW]
[ROW][C]28[/C][C]-0.026333[/C][C]-0.2005[/C][C]0.420878[/C][/ROW]
[ROW][C]29[/C][C]-0.091426[/C][C]-0.6963[/C][C]0.244517[/C][/ROW]
[ROW][C]30[/C][C]-0.100086[/C][C]-0.7622[/C][C]0.224505[/C][/ROW]
[ROW][C]31[/C][C]-0.063506[/C][C]-0.4836[/C][C]0.315228[/C][/ROW]
[ROW][C]32[/C][C]-0.02964[/C][C]-0.2257[/C][C]0.411101[/C][/ROW]
[ROW][C]33[/C][C]-0.111386[/C][C]-0.8483[/C][C]0.199882[/C][/ROW]
[ROW][C]34[/C][C]0.063859[/C][C]0.4863[/C][C]0.31428[/C][/ROW]
[ROW][C]35[/C][C]-0.139255[/C][C]-1.0605[/C][C]0.146648[/C][/ROW]
[ROW][C]36[/C][C]0.018891[/C][C]0.1439[/C][C]0.443052[/C][/ROW]
[ROW][C]37[/C][C]-0.050446[/C][C]-0.3842[/C][C]0.351124[/C][/ROW]
[ROW][C]38[/C][C]-0.034652[/C][C]-0.2639[/C][C]0.396396[/C][/ROW]
[ROW][C]39[/C][C]0.006214[/C][C]0.0473[/C][C]0.481208[/C][/ROW]
[ROW][C]40[/C][C]-0.00576[/C][C]-0.0439[/C][C]0.482579[/C][/ROW]
[ROW][C]41[/C][C]0.014943[/C][C]0.1138[/C][C]0.454893[/C][/ROW]
[ROW][C]42[/C][C]0.022262[/C][C]0.1695[/C][C]0.432979[/C][/ROW]
[ROW][C]43[/C][C]0.016709[/C][C]0.1273[/C][C]0.449591[/C][/ROW]
[ROW][C]44[/C][C]0.050373[/C][C]0.3836[/C][C]0.351328[/C][/ROW]
[ROW][C]45[/C][C]-0.068156[/C][C]-0.5191[/C][C]0.302846[/C][/ROW]
[ROW][C]46[/C][C]-0.013534[/C][C]-0.1031[/C][C]0.459129[/C][/ROW]
[ROW][C]47[/C][C]0.009956[/C][C]0.0758[/C][C]0.46991[/C][/ROW]
[ROW][C]48[/C][C]-0.009631[/C][C]-0.0733[/C][C]0.470891[/C][/ROW]
[ROW][C]49[/C][C]-0.005571[/C][C]-0.0424[/C][C]0.483153[/C][/ROW]
[ROW][C]50[/C][C]-0.024096[/C][C]-0.1835[/C][C]0.427519[/C][/ROW]
[ROW][C]51[/C][C]-0.002502[/C][C]-0.0191[/C][C]0.492431[/C][/ROW]
[ROW][C]52[/C][C]-0.096507[/C][C]-0.735[/C][C]0.232658[/C][/ROW]
[ROW][C]53[/C][C]-0.080465[/C][C]-0.6128[/C][C]0.271201[/C][/ROW]
[ROW][C]54[/C][C]-0.000454[/C][C]-0.0035[/C][C]0.498627[/C][/ROW]
[ROW][C]55[/C][C]0.018095[/C][C]0.1378[/C][C]0.445435[/C][/ROW]
[ROW][C]56[/C][C]0.020737[/C][C]0.1579[/C][C]0.437532[/C][/ROW]
[ROW][C]57[/C][C]0.0251[/C][C]0.1912[/C][C]0.424534[/C][/ROW]
[ROW][C]58[/C][C]NA[/C][C]NA[/C][C]NA[/C][/ROW]
[ROW][C]59[/C][C]NA[/C][C]NA[/C][C]NA[/C][/ROW]
[ROW][C]60[/C][C]NA[/C][C]NA[/C][C]NA[/C][/ROW]
[/TABLE]
Source: https://freestatistics.org/blog/index.php?pk=30224&T=2

Globally Unique Identifier (entire table): ba.freestatistics.org/blog/index.php?pk=30224&T=2

As an alternative you can also use a QR Code:  

The GUIDs for individual cells are displayed in the table below:

Partial Autocorrelation Function
Time lag kPACF(k)T-STATP-value
10.2592331.97430.02656
20.018920.14410.442965
30.0091110.06940.472459
4-0.004488-0.03420.486425
50.2506761.90910.030601
60.1100170.83790.202774
7-0.043724-0.3330.370169
80.1407871.07220.144035
9-0.092938-0.70780.240955
100.0138230.10530.458261
110.1028870.78360.218242
120.0086190.06560.473944
13-0.086142-0.6560.257196
140.0586680.44680.32834
15-0.035712-0.2720.393303
16-0.107381-0.81780.208412
17-0.09101-0.69310.245503
18-0.055618-0.42360.33672
19-0.06619-0.50410.308054
20-0.035801-0.27270.393043
21-0.007706-0.05870.476702
22-0.102226-0.77850.21971
23-0.021667-0.1650.434755
240.0686610.52290.301517
250.2090541.59210.058399
260.0326890.2490.402139
270.1103160.84010.202139
28-0.026333-0.20050.420878
29-0.091426-0.69630.244517
30-0.100086-0.76220.224505
31-0.063506-0.48360.315228
32-0.02964-0.22570.411101
33-0.111386-0.84830.199882
340.0638590.48630.31428
35-0.139255-1.06050.146648
360.0188910.14390.443052
37-0.050446-0.38420.351124
38-0.034652-0.26390.396396
390.0062140.04730.481208
40-0.00576-0.04390.482579
410.0149430.11380.454893
420.0222620.16950.432979
430.0167090.12730.449591
440.0503730.38360.351328
45-0.068156-0.51910.302846
46-0.013534-0.10310.459129
470.0099560.07580.46991
48-0.009631-0.07330.470891
49-0.005571-0.04240.483153
50-0.024096-0.18350.427519
51-0.002502-0.01910.492431
52-0.096507-0.7350.232658
53-0.080465-0.61280.271201
54-0.000454-0.00350.498627
550.0180950.13780.445435
560.0207370.15790.437532
570.02510.19120.424534
58NANANA
59NANANA
60NANANA


Parameters (Session):
par1 = 60 ; par2 = 1 ; par3 = 1 ; par4 = 0 ; par5 = 12 ;
Parameters (R input):
par1 = 60 ; par2 = 1 ; par3 = 1 ; par4 = 0 ; par5 = 12 ;
R code (references can be found in the software module):
if (par1 == 'Default') {
par1 = 10*log10(length(x))
} else {
par1 <- as.numeric(par1)
}
par2 <- as.numeric(par2)
par3 <- as.numeric(par3)
par4 <- as.numeric(par4)
par5 <- as.numeric(par5)
if (par2 == 0) {
x <- log(x)
} else {
x <- (x ^ par2 - 1) / par2
}
if (par3 > 0) x <- diff(x,lag=1,difference=par3)
if (par4 > 0) x <- diff(x,lag=par5,difference=par4)
bitmap(file='pic1.png')
racf <- acf(x,par1,main='Autocorrelation',xlab='lags',ylab='ACF')
dev.off()
bitmap(file='pic2.png')
rpacf <- pacf(x,par1,main='Partial Autocorrelation',xlab='lags',ylab='PACF')
dev.off()
(myacf <- c(racf$acf))
(mypacf <- c(rpacf$acf))
lengthx <- length(x)
sqrtn <- sqrt(lengthx)
load(file='createtable')
a<-table.start()
a<-table.row.start(a)
a<-table.element(a,'Autocorrelation Function',4,TRUE)
a<-table.row.end(a)
a<-table.row.start(a)
a<-table.element(a,'Time lag k',header=TRUE)
a<-table.element(a,hyperlink('basics.htm','ACF(k)','click here for more information about the Autocorrelation Function'),header=TRUE)
a<-table.element(a,'T-STAT',header=TRUE)
a<-table.element(a,'P-value',header=TRUE)
a<-table.row.end(a)
for (i in 2:(par1+1)) {
a<-table.row.start(a)
a<-table.element(a,i-1,header=TRUE)
a<-table.element(a,round(myacf[i],6))
mytstat <- myacf[i]*sqrtn
a<-table.element(a,round(mytstat,4))
a<-table.element(a,round(1-pt(abs(mytstat),lengthx),6))
a<-table.row.end(a)
}
a<-table.end(a)
table.save(a,file='mytable.tab')
a<-table.start()
a<-table.row.start(a)
a<-table.element(a,'Partial Autocorrelation Function',4,TRUE)
a<-table.row.end(a)
a<-table.row.start(a)
a<-table.element(a,'Time lag k',header=TRUE)
a<-table.element(a,hyperlink('basics.htm','PACF(k)','click here for more information about the Partial Autocorrelation Function'),header=TRUE)
a<-table.element(a,'T-STAT',header=TRUE)
a<-table.element(a,'P-value',header=TRUE)
a<-table.row.end(a)
for (i in 1:par1) {
a<-table.row.start(a)
a<-table.element(a,i,header=TRUE)
a<-table.element(a,round(mypacf[i],6))
mytstat <- mypacf[i]*sqrtn
a<-table.element(a,round(mytstat,4))
a<-table.element(a,round(1-pt(abs(mytstat),lengthx),6))
a<-table.row.end(a)
}
a<-table.end(a)
table.save(a,file='mytable1.tab')