Free Statistics

of Irreproducible Research!

Author's title

Author*The author of this computation has been verified*
R Software Modulerwasp_centraltendency.wasp
Title produced by softwareCentral Tendency
Date of computationSun, 07 Dec 2008 11:05:37 -0700
Cite this page as followsStatistical Computations at FreeStatistics.org, Office for Research Development and Education, URL https://freestatistics.org/blog/index.php?v=date/2008/Dec/07/t1228673166rzqmu663ciw2k0k.htm/, Retrieved Sun, 19 May 2024 10:48:45 +0000
Statistical Computations at FreeStatistics.org, Office for Research Development and Education, URL https://freestatistics.org/blog/index.php?pk=30204, Retrieved Sun, 19 May 2024 10:48:45 +0000
QR Codes:

Original text written by user:
IsPrivate?No (this computation is public)
User-defined keywords
Estimated Impact179
Family? (F = Feedback message, R = changed R code, M = changed R Module, P = changed Parameters, D = changed Data)
-     [Univariate Data Series] [Uitvoer per gewes...] [2008-12-07 13:17:15] [299afd6311e4c20059ea2f05c8dd029d]
- RMPD    [Central Tendency] [Uitvoer per gewes...] [2008-12-07 18:05:37] [5e2b1e7aa808f9f0d23fd35605d4968f] [Current]
Feedback Forum

Post a new message
Dataseries X:
2283
2249.5
2468.9
2469.2
2417.7
2411.1
2361
1924.1
2486.9
2674.9
2296.2
2101.5
2322
2273.8
2501.3
2435.2
2273.3
2454.7
2328.8
1897
2608.1
2712.3
2322
2282.6
2241.1
2417.2
2829
2600.6
2321
2768.5
2457.3
2142.7
2764.4
2788.9
2679.5
2536.5
2682.7
2699.6
3097.8
3015.2
2878
3010.9
2612.3
2419.3
3096.5
3013
3397.4
3423.1
3298.7
3065.7
3918.3
3154.4
3334.7
3461.6
3018.5
2832
3301.3
3342.8
3464.4
3016.6
3201.3
3135.3
3549.8
3247.2
3441.8
3535.6
3384.7
2996.6
3402.8
3889.4
3766.3
3200.7


Summary of computational transaction
Raw Inputview raw input (R code)
Raw Outputview raw output of R engine
Computing time3 seconds
R Server'Herman Ole Andreas Wold' @ 193.190.124.10:1001

\begin{tabular}{lllllllll}
\hline
Summary of computational transaction \tabularnewline
Raw Input & view raw input (R code)  \tabularnewline
Raw Output & view raw output of R engine  \tabularnewline
Computing time & 3 seconds \tabularnewline
R Server & 'Herman Ole Andreas Wold' @ 193.190.124.10:1001 \tabularnewline
\hline
\end{tabular}
%Source: https://freestatistics.org/blog/index.php?pk=30204&T=0

[TABLE]
[ROW][C]Summary of computational transaction[/C][/ROW]
[ROW][C]Raw Input[/C][C]view raw input (R code) [/C][/ROW]
[ROW][C]Raw Output[/C][C]view raw output of R engine [/C][/ROW]
[ROW][C]Computing time[/C][C]3 seconds[/C][/ROW]
[ROW][C]R Server[/C][C]'Herman Ole Andreas Wold' @ 193.190.124.10:1001[/C][/ROW]
[/TABLE]
Source: https://freestatistics.org/blog/index.php?pk=30204&T=0

Globally Unique Identifier (entire table): ba.freestatistics.org/blog/index.php?pk=30204&T=0

As an alternative you can also use a QR Code:  

The GUIDs for individual cells are displayed in the table below:

Summary of computational transaction
Raw Inputview raw input (R code)
Raw Outputview raw output of R engine
Computing time3 seconds
R Server'Herman Ole Andreas Wold' @ 193.190.124.10:1001


Central Tendency - Ungrouped Data
MeasureValueS.E.Value/S.E.
Arithmetic Mean2811.2236111111157.231476645172449.1202355050233
Geometric Mean2770.32235615996
Harmonic Mean2730.10637172916
Quadratic Mean2852.28584961547
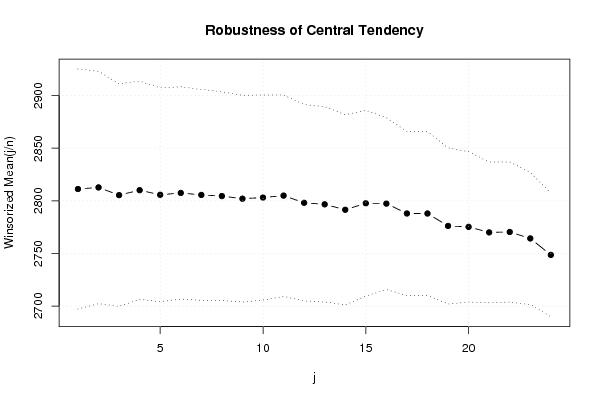
Winsorized Mean ( 1 / 24 )2811.1986111111157.039797369311749.2848632141807
Winsorized Mean ( 2 / 24 )2812.7069444444455.179289023275750.9739613219371
Winsorized Mean ( 3 / 24 )2805.4027777777852.87531136851153.0569504967206
Winsorized Mean ( 4 / 24 )2810.0805555555651.813437550444154.2345902608708
Winsorized Mean ( 5 / 24 )2805.7194444444450.783776299197455.2483420672438
Winsorized Mean ( 6 / 24 )2807.4694444444450.440244967275155.6593142294588
Winsorized Mean ( 7 / 24 )2805.5930555555650.084967645617556.0166690214693
Winsorized Mean ( 8 / 24 )2804.4930555555649.570875080096556.5754195588451
Winsorized Mean ( 9 / 24 )2802.0055555555649.121867944566457.0419178423263
Winsorized Mean ( 10 / 24 )2803.0888888888948.722103031065757.5321817923502
Winsorized Mean ( 11 / 24 )2804.937547.842275482128858.6288480581942
Winsorized Mean ( 12 / 24 )2798.1208333333346.647970724158359.9837632783505
Winsorized Mean ( 13 / 24 )2796.6583333333346.408303658657760.262024526975
Winsorized Mean ( 14 / 24 )2791.4861111111145.171076794966161.7980865008335
Winsorized Mean ( 15 / 24 )2797.6527777777844.133224028107363.391080968751
Winsorized Mean ( 16 / 24 )2797.3416666666740.809675035298968.5460412082935
Winsorized Mean ( 17 / 24 )2787.9444444444438.965522704811671.549006683803
Winsorized Mean ( 18 / 24 )2787.9194444444438.926367513410271.6203340443723
Winsorized Mean ( 19 / 24 )2776.1236111111137.078420283977974.8716798032173
Winsorized Mean ( 20 / 24 )2775.2347222222235.725154490627477.6829313068558
Winsorized Mean ( 21 / 24 )2769.9847222222233.433880552192282.8496326622366
Winsorized Mean ( 22 / 24 )2770.3819444444433.273635234918983.2605732702473
Winsorized Mean ( 23 / 24 )2764.2486111111131.439056105410187.9240331466388
Winsorized Mean ( 24 / 24 )2748.6152777777829.342780812938693.6726241217663
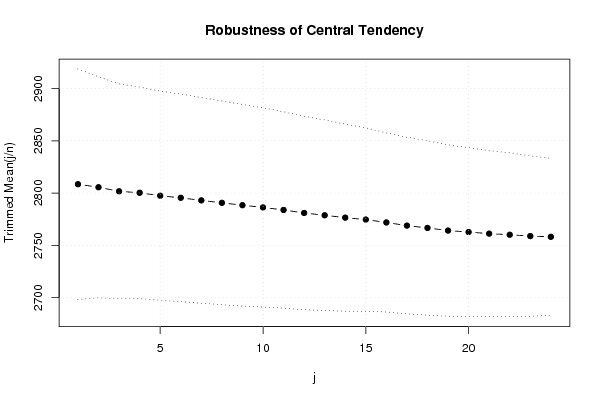
Trimmed Mean ( 1 / 24 )2808.4685714285755.134138760900650.9388309048957
Trimmed Mean ( 2 / 24 )2805.5779411764752.861523581464953.0741028841667
Trimmed Mean ( 3 / 24 )2801.6893939393951.348495148157654.5622493094604
Trimmed Mean ( 4 / 24 )2800.29687550.584983006791455.3582646182572
Trimmed Mean ( 5 / 24 )2797.4564516129050.022133843445255.9243726060973
Trimmed Mean ( 6 / 24 )2795.4733333333349.625908286478856.3309253141669
Trimmed Mean ( 7 / 24 )2792.9913793103449.195954729973556.7727853771819
Trimmed Mean ( 8 / 24 )2790.6767857142948.719004798060657.2810712632902
Trimmed Mean ( 9 / 24 )2788.3740740740748.210898653965857.8370068163977
Trimmed Mean ( 10 / 24 )2786.2769230769247.640279690455258.4857381438748
Trimmed Mean ( 11 / 24 )2783.85646.969505535886959.2694338217591
Trimmed Mean ( 12 / 24 )2780.9812546.26752846451860.1065443150416
Trimmed Mean ( 13 / 24 )2778.7456521739145.592447538235860.9474990313591
Trimmed Mean ( 14 / 24 )2776.4909090909144.726819479389362.07664531949
Trimmed Mean ( 15 / 24 )2774.6547619047643.835630875922663.2967909087122
Trimmed Mean ( 16 / 24 )2771.89542.839087404091464.7048097419383
Trimmed Mean ( 17 / 24 )2768.8815789473742.221890807672465.5792889892136
Trimmed Mean ( 18 / 24 )2766.6388888888941.743859215301966.2765479976209
Trimmed Mean ( 19 / 24 )2764.1352941176540.990762596269967.4331268569563
Trimmed Mean ( 20 / 24 )2762.71562540.33566072842668.4931292833146
Trimmed Mean ( 21 / 24 )2761.2133333333339.650723561206369.6384097271522
Trimmed Mean ( 22 / 24 )2760.1392857142939.180142679734970.4474026109637
Trimmed Mean ( 23 / 24 )2758.8538.3431832272771.9515117888773
Trimmed Mean ( 24 / 24 )2758.1458333333337.527525636585673.4966077977818
Median2738.35
Midrange2907.65
Midmean - Weighted Average at Xnp2757.19459459459
Midmean - Weighted Average at X(n+1)p2766.63888888889
Midmean - Empirical Distribution Function2757.19459459459
Midmean - Empirical Distribution Function - Averaging2766.63888888889
Midmean - Empirical Distribution Function - Interpolation2766.63888888889
Midmean - Closest Observation2757.19459459459
Midmean - True Basic - Statistics Graphics Toolkit2766.63888888889
Midmean - MS Excel (old versions)2768.88157894737
Number of observations72

\begin{tabular}{lllllllll}
\hline
Central Tendency - Ungrouped Data \tabularnewline
Measure & Value & S.E. & Value/S.E. \tabularnewline
Arithmetic Mean & 2811.22361111111 & 57.2314766451724 & 49.1202355050233 \tabularnewline
Geometric Mean & 2770.32235615996 &  &  \tabularnewline
Harmonic Mean & 2730.10637172916 &  &  \tabularnewline
Quadratic Mean & 2852.28584961547 &  &  \tabularnewline
Winsorized Mean ( 1 / 24 ) & 2811.19861111111 & 57.0397973693117 & 49.2848632141807 \tabularnewline
Winsorized Mean ( 2 / 24 ) & 2812.70694444444 & 55.1792890232757 & 50.9739613219371 \tabularnewline
Winsorized Mean ( 3 / 24 ) & 2805.40277777778 & 52.875311368511 & 53.0569504967206 \tabularnewline
Winsorized Mean ( 4 / 24 ) & 2810.08055555556 & 51.8134375504441 & 54.2345902608708 \tabularnewline
Winsorized Mean ( 5 / 24 ) & 2805.71944444444 & 50.7837762991974 & 55.2483420672438 \tabularnewline
Winsorized Mean ( 6 / 24 ) & 2807.46944444444 & 50.4402449672751 & 55.6593142294588 \tabularnewline
Winsorized Mean ( 7 / 24 ) & 2805.59305555556 & 50.0849676456175 & 56.0166690214693 \tabularnewline
Winsorized Mean ( 8 / 24 ) & 2804.49305555556 & 49.5708750800965 & 56.5754195588451 \tabularnewline
Winsorized Mean ( 9 / 24 ) & 2802.00555555556 & 49.1218679445664 & 57.0419178423263 \tabularnewline
Winsorized Mean ( 10 / 24 ) & 2803.08888888889 & 48.7221030310657 & 57.5321817923502 \tabularnewline
Winsorized Mean ( 11 / 24 ) & 2804.9375 & 47.8422754821288 & 58.6288480581942 \tabularnewline
Winsorized Mean ( 12 / 24 ) & 2798.12083333333 & 46.6479707241583 & 59.9837632783505 \tabularnewline
Winsorized Mean ( 13 / 24 ) & 2796.65833333333 & 46.4083036586577 & 60.262024526975 \tabularnewline
Winsorized Mean ( 14 / 24 ) & 2791.48611111111 & 45.1710767949661 & 61.7980865008335 \tabularnewline
Winsorized Mean ( 15 / 24 ) & 2797.65277777778 & 44.1332240281073 & 63.391080968751 \tabularnewline
Winsorized Mean ( 16 / 24 ) & 2797.34166666667 & 40.8096750352989 & 68.5460412082935 \tabularnewline
Winsorized Mean ( 17 / 24 ) & 2787.94444444444 & 38.9655227048116 & 71.549006683803 \tabularnewline
Winsorized Mean ( 18 / 24 ) & 2787.91944444444 & 38.9263675134102 & 71.6203340443723 \tabularnewline
Winsorized Mean ( 19 / 24 ) & 2776.12361111111 & 37.0784202839779 & 74.8716798032173 \tabularnewline
Winsorized Mean ( 20 / 24 ) & 2775.23472222222 & 35.7251544906274 & 77.6829313068558 \tabularnewline
Winsorized Mean ( 21 / 24 ) & 2769.98472222222 & 33.4338805521922 & 82.8496326622366 \tabularnewline
Winsorized Mean ( 22 / 24 ) & 2770.38194444444 & 33.2736352349189 & 83.2605732702473 \tabularnewline
Winsorized Mean ( 23 / 24 ) & 2764.24861111111 & 31.4390561054101 & 87.9240331466388 \tabularnewline
Winsorized Mean ( 24 / 24 ) & 2748.61527777778 & 29.3427808129386 & 93.6726241217663 \tabularnewline
Trimmed Mean ( 1 / 24 ) & 2808.46857142857 & 55.1341387609006 & 50.9388309048957 \tabularnewline
Trimmed Mean ( 2 / 24 ) & 2805.57794117647 & 52.8615235814649 & 53.0741028841667 \tabularnewline
Trimmed Mean ( 3 / 24 ) & 2801.68939393939 & 51.3484951481576 & 54.5622493094604 \tabularnewline
Trimmed Mean ( 4 / 24 ) & 2800.296875 & 50.5849830067914 & 55.3582646182572 \tabularnewline
Trimmed Mean ( 5 / 24 ) & 2797.45645161290 & 50.0221338434452 & 55.9243726060973 \tabularnewline
Trimmed Mean ( 6 / 24 ) & 2795.47333333333 & 49.6259082864788 & 56.3309253141669 \tabularnewline
Trimmed Mean ( 7 / 24 ) & 2792.99137931034 & 49.1959547299735 & 56.7727853771819 \tabularnewline
Trimmed Mean ( 8 / 24 ) & 2790.67678571429 & 48.7190047980606 & 57.2810712632902 \tabularnewline
Trimmed Mean ( 9 / 24 ) & 2788.37407407407 & 48.2108986539658 & 57.8370068163977 \tabularnewline
Trimmed Mean ( 10 / 24 ) & 2786.27692307692 & 47.6402796904552 & 58.4857381438748 \tabularnewline
Trimmed Mean ( 11 / 24 ) & 2783.856 & 46.9695055358869 & 59.2694338217591 \tabularnewline
Trimmed Mean ( 12 / 24 ) & 2780.98125 & 46.267528464518 & 60.1065443150416 \tabularnewline
Trimmed Mean ( 13 / 24 ) & 2778.74565217391 & 45.5924475382358 & 60.9474990313591 \tabularnewline
Trimmed Mean ( 14 / 24 ) & 2776.49090909091 & 44.7268194793893 & 62.07664531949 \tabularnewline
Trimmed Mean ( 15 / 24 ) & 2774.65476190476 & 43.8356308759226 & 63.2967909087122 \tabularnewline
Trimmed Mean ( 16 / 24 ) & 2771.895 & 42.8390874040914 & 64.7048097419383 \tabularnewline
Trimmed Mean ( 17 / 24 ) & 2768.88157894737 & 42.2218908076724 & 65.5792889892136 \tabularnewline
Trimmed Mean ( 18 / 24 ) & 2766.63888888889 & 41.7438592153019 & 66.2765479976209 \tabularnewline
Trimmed Mean ( 19 / 24 ) & 2764.13529411765 & 40.9907625962699 & 67.4331268569563 \tabularnewline
Trimmed Mean ( 20 / 24 ) & 2762.715625 & 40.335660728426 & 68.4931292833146 \tabularnewline
Trimmed Mean ( 21 / 24 ) & 2761.21333333333 & 39.6507235612063 & 69.6384097271522 \tabularnewline
Trimmed Mean ( 22 / 24 ) & 2760.13928571429 & 39.1801426797349 & 70.4474026109637 \tabularnewline
Trimmed Mean ( 23 / 24 ) & 2758.85 & 38.34318322727 & 71.9515117888773 \tabularnewline
Trimmed Mean ( 24 / 24 ) & 2758.14583333333 & 37.5275256365856 & 73.4966077977818 \tabularnewline
Median & 2738.35 &  &  \tabularnewline
Midrange & 2907.65 &  &  \tabularnewline
Midmean - Weighted Average at Xnp & 2757.19459459459 &  &  \tabularnewline
Midmean - Weighted Average at X(n+1)p & 2766.63888888889 &  &  \tabularnewline
Midmean - Empirical Distribution Function & 2757.19459459459 &  &  \tabularnewline
Midmean - Empirical Distribution Function - Averaging & 2766.63888888889 &  &  \tabularnewline
Midmean - Empirical Distribution Function - Interpolation & 2766.63888888889 &  &  \tabularnewline
Midmean - Closest Observation & 2757.19459459459 &  &  \tabularnewline
Midmean - True Basic - Statistics Graphics Toolkit & 2766.63888888889 &  &  \tabularnewline
Midmean - MS Excel (old versions) & 2768.88157894737 &  &  \tabularnewline
Number of observations & 72 &  &  \tabularnewline
\hline
\end{tabular}
%Source: https://freestatistics.org/blog/index.php?pk=30204&T=1

[TABLE]
[ROW][C]Central Tendency - Ungrouped Data[/C][/ROW]
[ROW][C]Measure[/C][C]Value[/C][C]S.E.[/C][C]Value/S.E.[/C][/ROW]
[ROW][C]Arithmetic Mean[/C][C]2811.22361111111[/C][C]57.2314766451724[/C][C]49.1202355050233[/C][/ROW]
[ROW][C]Geometric Mean[/C][C]2770.32235615996[/C][C][/C][C][/C][/ROW]
[ROW][C]Harmonic Mean[/C][C]2730.10637172916[/C][C][/C][C][/C][/ROW]
[ROW][C]Quadratic Mean[/C][C]2852.28584961547[/C][C][/C][C][/C][/ROW]
[ROW][C]Winsorized Mean ( 1 / 24 )[/C][C]2811.19861111111[/C][C]57.0397973693117[/C][C]49.2848632141807[/C][/ROW]
[ROW][C]Winsorized Mean ( 2 / 24 )[/C][C]2812.70694444444[/C][C]55.1792890232757[/C][C]50.9739613219371[/C][/ROW]
[ROW][C]Winsorized Mean ( 3 / 24 )[/C][C]2805.40277777778[/C][C]52.875311368511[/C][C]53.0569504967206[/C][/ROW]
[ROW][C]Winsorized Mean ( 4 / 24 )[/C][C]2810.08055555556[/C][C]51.8134375504441[/C][C]54.2345902608708[/C][/ROW]
[ROW][C]Winsorized Mean ( 5 / 24 )[/C][C]2805.71944444444[/C][C]50.7837762991974[/C][C]55.2483420672438[/C][/ROW]
[ROW][C]Winsorized Mean ( 6 / 24 )[/C][C]2807.46944444444[/C][C]50.4402449672751[/C][C]55.6593142294588[/C][/ROW]
[ROW][C]Winsorized Mean ( 7 / 24 )[/C][C]2805.59305555556[/C][C]50.0849676456175[/C][C]56.0166690214693[/C][/ROW]
[ROW][C]Winsorized Mean ( 8 / 24 )[/C][C]2804.49305555556[/C][C]49.5708750800965[/C][C]56.5754195588451[/C][/ROW]
[ROW][C]Winsorized Mean ( 9 / 24 )[/C][C]2802.00555555556[/C][C]49.1218679445664[/C][C]57.0419178423263[/C][/ROW]
[ROW][C]Winsorized Mean ( 10 / 24 )[/C][C]2803.08888888889[/C][C]48.7221030310657[/C][C]57.5321817923502[/C][/ROW]
[ROW][C]Winsorized Mean ( 11 / 24 )[/C][C]2804.9375[/C][C]47.8422754821288[/C][C]58.6288480581942[/C][/ROW]
[ROW][C]Winsorized Mean ( 12 / 24 )[/C][C]2798.12083333333[/C][C]46.6479707241583[/C][C]59.9837632783505[/C][/ROW]
[ROW][C]Winsorized Mean ( 13 / 24 )[/C][C]2796.65833333333[/C][C]46.4083036586577[/C][C]60.262024526975[/C][/ROW]
[ROW][C]Winsorized Mean ( 14 / 24 )[/C][C]2791.48611111111[/C][C]45.1710767949661[/C][C]61.7980865008335[/C][/ROW]
[ROW][C]Winsorized Mean ( 15 / 24 )[/C][C]2797.65277777778[/C][C]44.1332240281073[/C][C]63.391080968751[/C][/ROW]
[ROW][C]Winsorized Mean ( 16 / 24 )[/C][C]2797.34166666667[/C][C]40.8096750352989[/C][C]68.5460412082935[/C][/ROW]
[ROW][C]Winsorized Mean ( 17 / 24 )[/C][C]2787.94444444444[/C][C]38.9655227048116[/C][C]71.549006683803[/C][/ROW]
[ROW][C]Winsorized Mean ( 18 / 24 )[/C][C]2787.91944444444[/C][C]38.9263675134102[/C][C]71.6203340443723[/C][/ROW]
[ROW][C]Winsorized Mean ( 19 / 24 )[/C][C]2776.12361111111[/C][C]37.0784202839779[/C][C]74.8716798032173[/C][/ROW]
[ROW][C]Winsorized Mean ( 20 / 24 )[/C][C]2775.23472222222[/C][C]35.7251544906274[/C][C]77.6829313068558[/C][/ROW]
[ROW][C]Winsorized Mean ( 21 / 24 )[/C][C]2769.98472222222[/C][C]33.4338805521922[/C][C]82.8496326622366[/C][/ROW]
[ROW][C]Winsorized Mean ( 22 / 24 )[/C][C]2770.38194444444[/C][C]33.2736352349189[/C][C]83.2605732702473[/C][/ROW]
[ROW][C]Winsorized Mean ( 23 / 24 )[/C][C]2764.24861111111[/C][C]31.4390561054101[/C][C]87.9240331466388[/C][/ROW]
[ROW][C]Winsorized Mean ( 24 / 24 )[/C][C]2748.61527777778[/C][C]29.3427808129386[/C][C]93.6726241217663[/C][/ROW]
[ROW][C]Trimmed Mean ( 1 / 24 )[/C][C]2808.46857142857[/C][C]55.1341387609006[/C][C]50.9388309048957[/C][/ROW]
[ROW][C]Trimmed Mean ( 2 / 24 )[/C][C]2805.57794117647[/C][C]52.8615235814649[/C][C]53.0741028841667[/C][/ROW]
[ROW][C]Trimmed Mean ( 3 / 24 )[/C][C]2801.68939393939[/C][C]51.3484951481576[/C][C]54.5622493094604[/C][/ROW]
[ROW][C]Trimmed Mean ( 4 / 24 )[/C][C]2800.296875[/C][C]50.5849830067914[/C][C]55.3582646182572[/C][/ROW]
[ROW][C]Trimmed Mean ( 5 / 24 )[/C][C]2797.45645161290[/C][C]50.0221338434452[/C][C]55.9243726060973[/C][/ROW]
[ROW][C]Trimmed Mean ( 6 / 24 )[/C][C]2795.47333333333[/C][C]49.6259082864788[/C][C]56.3309253141669[/C][/ROW]
[ROW][C]Trimmed Mean ( 7 / 24 )[/C][C]2792.99137931034[/C][C]49.1959547299735[/C][C]56.7727853771819[/C][/ROW]
[ROW][C]Trimmed Mean ( 8 / 24 )[/C][C]2790.67678571429[/C][C]48.7190047980606[/C][C]57.2810712632902[/C][/ROW]
[ROW][C]Trimmed Mean ( 9 / 24 )[/C][C]2788.37407407407[/C][C]48.2108986539658[/C][C]57.8370068163977[/C][/ROW]
[ROW][C]Trimmed Mean ( 10 / 24 )[/C][C]2786.27692307692[/C][C]47.6402796904552[/C][C]58.4857381438748[/C][/ROW]
[ROW][C]Trimmed Mean ( 11 / 24 )[/C][C]2783.856[/C][C]46.9695055358869[/C][C]59.2694338217591[/C][/ROW]
[ROW][C]Trimmed Mean ( 12 / 24 )[/C][C]2780.98125[/C][C]46.267528464518[/C][C]60.1065443150416[/C][/ROW]
[ROW][C]Trimmed Mean ( 13 / 24 )[/C][C]2778.74565217391[/C][C]45.5924475382358[/C][C]60.9474990313591[/C][/ROW]
[ROW][C]Trimmed Mean ( 14 / 24 )[/C][C]2776.49090909091[/C][C]44.7268194793893[/C][C]62.07664531949[/C][/ROW]
[ROW][C]Trimmed Mean ( 15 / 24 )[/C][C]2774.65476190476[/C][C]43.8356308759226[/C][C]63.2967909087122[/C][/ROW]
[ROW][C]Trimmed Mean ( 16 / 24 )[/C][C]2771.895[/C][C]42.8390874040914[/C][C]64.7048097419383[/C][/ROW]
[ROW][C]Trimmed Mean ( 17 / 24 )[/C][C]2768.88157894737[/C][C]42.2218908076724[/C][C]65.5792889892136[/C][/ROW]
[ROW][C]Trimmed Mean ( 18 / 24 )[/C][C]2766.63888888889[/C][C]41.7438592153019[/C][C]66.2765479976209[/C][/ROW]
[ROW][C]Trimmed Mean ( 19 / 24 )[/C][C]2764.13529411765[/C][C]40.9907625962699[/C][C]67.4331268569563[/C][/ROW]
[ROW][C]Trimmed Mean ( 20 / 24 )[/C][C]2762.715625[/C][C]40.335660728426[/C][C]68.4931292833146[/C][/ROW]
[ROW][C]Trimmed Mean ( 21 / 24 )[/C][C]2761.21333333333[/C][C]39.6507235612063[/C][C]69.6384097271522[/C][/ROW]
[ROW][C]Trimmed Mean ( 22 / 24 )[/C][C]2760.13928571429[/C][C]39.1801426797349[/C][C]70.4474026109637[/C][/ROW]
[ROW][C]Trimmed Mean ( 23 / 24 )[/C][C]2758.85[/C][C]38.34318322727[/C][C]71.9515117888773[/C][/ROW]
[ROW][C]Trimmed Mean ( 24 / 24 )[/C][C]2758.14583333333[/C][C]37.5275256365856[/C][C]73.4966077977818[/C][/ROW]
[ROW][C]Median[/C][C]2738.35[/C][C][/C][C][/C][/ROW]
[ROW][C]Midrange[/C][C]2907.65[/C][C][/C][C][/C][/ROW]
[ROW][C]Midmean - Weighted Average at Xnp[/C][C]2757.19459459459[/C][C][/C][C][/C][/ROW]
[ROW][C]Midmean - Weighted Average at X(n+1)p[/C][C]2766.63888888889[/C][C][/C][C][/C][/ROW]
[ROW][C]Midmean - Empirical Distribution Function[/C][C]2757.19459459459[/C][C][/C][C][/C][/ROW]
[ROW][C]Midmean - Empirical Distribution Function - Averaging[/C][C]2766.63888888889[/C][C][/C][C][/C][/ROW]
[ROW][C]Midmean - Empirical Distribution Function - Interpolation[/C][C]2766.63888888889[/C][C][/C][C][/C][/ROW]
[ROW][C]Midmean - Closest Observation[/C][C]2757.19459459459[/C][C][/C][C][/C][/ROW]
[ROW][C]Midmean - True Basic - Statistics Graphics Toolkit[/C][C]2766.63888888889[/C][C][/C][C][/C][/ROW]
[ROW][C]Midmean - MS Excel (old versions)[/C][C]2768.88157894737[/C][C][/C][C][/C][/ROW]
[ROW][C]Number of observations[/C][C]72[/C][C][/C][C][/C][/ROW]
[/TABLE]
Source: https://freestatistics.org/blog/index.php?pk=30204&T=1

Globally Unique Identifier (entire table): ba.freestatistics.org/blog/index.php?pk=30204&T=1

As an alternative you can also use a QR Code:  

The GUIDs for individual cells are displayed in the table below:

Central Tendency - Ungrouped Data
MeasureValueS.E.Value/S.E.
Arithmetic Mean2811.2236111111157.231476645172449.1202355050233
Geometric Mean2770.32235615996
Harmonic Mean2730.10637172916
Quadratic Mean2852.28584961547
Winsorized Mean ( 1 / 24 )2811.1986111111157.039797369311749.2848632141807
Winsorized Mean ( 2 / 24 )2812.7069444444455.179289023275750.9739613219371
Winsorized Mean ( 3 / 24 )2805.4027777777852.87531136851153.0569504967206
Winsorized Mean ( 4 / 24 )2810.0805555555651.813437550444154.2345902608708
Winsorized Mean ( 5 / 24 )2805.7194444444450.783776299197455.2483420672438
Winsorized Mean ( 6 / 24 )2807.4694444444450.440244967275155.6593142294588
Winsorized Mean ( 7 / 24 )2805.5930555555650.084967645617556.0166690214693
Winsorized Mean ( 8 / 24 )2804.4930555555649.570875080096556.5754195588451
Winsorized Mean ( 9 / 24 )2802.0055555555649.121867944566457.0419178423263
Winsorized Mean ( 10 / 24 )2803.0888888888948.722103031065757.5321817923502
Winsorized Mean ( 11 / 24 )2804.937547.842275482128858.6288480581942
Winsorized Mean ( 12 / 24 )2798.1208333333346.647970724158359.9837632783505
Winsorized Mean ( 13 / 24 )2796.6583333333346.408303658657760.262024526975
Winsorized Mean ( 14 / 24 )2791.4861111111145.171076794966161.7980865008335
Winsorized Mean ( 15 / 24 )2797.6527777777844.133224028107363.391080968751
Winsorized Mean ( 16 / 24 )2797.3416666666740.809675035298968.5460412082935
Winsorized Mean ( 17 / 24 )2787.9444444444438.965522704811671.549006683803
Winsorized Mean ( 18 / 24 )2787.9194444444438.926367513410271.6203340443723
Winsorized Mean ( 19 / 24 )2776.1236111111137.078420283977974.8716798032173
Winsorized Mean ( 20 / 24 )2775.2347222222235.725154490627477.6829313068558
Winsorized Mean ( 21 / 24 )2769.9847222222233.433880552192282.8496326622366
Winsorized Mean ( 22 / 24 )2770.3819444444433.273635234918983.2605732702473
Winsorized Mean ( 23 / 24 )2764.2486111111131.439056105410187.9240331466388
Winsorized Mean ( 24 / 24 )2748.6152777777829.342780812938693.6726241217663
Trimmed Mean ( 1 / 24 )2808.4685714285755.134138760900650.9388309048957
Trimmed Mean ( 2 / 24 )2805.5779411764752.861523581464953.0741028841667
Trimmed Mean ( 3 / 24 )2801.6893939393951.348495148157654.5622493094604
Trimmed Mean ( 4 / 24 )2800.29687550.584983006791455.3582646182572
Trimmed Mean ( 5 / 24 )2797.4564516129050.022133843445255.9243726060973
Trimmed Mean ( 6 / 24 )2795.4733333333349.625908286478856.3309253141669
Trimmed Mean ( 7 / 24 )2792.9913793103449.195954729973556.7727853771819
Trimmed Mean ( 8 / 24 )2790.6767857142948.719004798060657.2810712632902
Trimmed Mean ( 9 / 24 )2788.3740740740748.210898653965857.8370068163977
Trimmed Mean ( 10 / 24 )2786.2769230769247.640279690455258.4857381438748
Trimmed Mean ( 11 / 24 )2783.85646.969505535886959.2694338217591
Trimmed Mean ( 12 / 24 )2780.9812546.26752846451860.1065443150416
Trimmed Mean ( 13 / 24 )2778.7456521739145.592447538235860.9474990313591
Trimmed Mean ( 14 / 24 )2776.4909090909144.726819479389362.07664531949
Trimmed Mean ( 15 / 24 )2774.6547619047643.835630875922663.2967909087122
Trimmed Mean ( 16 / 24 )2771.89542.839087404091464.7048097419383
Trimmed Mean ( 17 / 24 )2768.8815789473742.221890807672465.5792889892136
Trimmed Mean ( 18 / 24 )2766.6388888888941.743859215301966.2765479976209
Trimmed Mean ( 19 / 24 )2764.1352941176540.990762596269967.4331268569563
Trimmed Mean ( 20 / 24 )2762.71562540.33566072842668.4931292833146
Trimmed Mean ( 21 / 24 )2761.2133333333339.650723561206369.6384097271522
Trimmed Mean ( 22 / 24 )2760.1392857142939.180142679734970.4474026109637
Trimmed Mean ( 23 / 24 )2758.8538.3431832272771.9515117888773
Trimmed Mean ( 24 / 24 )2758.1458333333337.527525636585673.4966077977818
Median2738.35
Midrange2907.65
Midmean - Weighted Average at Xnp2757.19459459459
Midmean - Weighted Average at X(n+1)p2766.63888888889
Midmean - Empirical Distribution Function2757.19459459459
Midmean - Empirical Distribution Function - Averaging2766.63888888889
Midmean - Empirical Distribution Function - Interpolation2766.63888888889
Midmean - Closest Observation2757.19459459459
Midmean - True Basic - Statistics Graphics Toolkit2766.63888888889
Midmean - MS Excel (old versions)2768.88157894737
Number of observations72


Parameters (Session):
Parameters (R input):
R code (references can be found in the software module):
geomean <- function(x) {
return(exp(mean(log(x))))
}
harmean <- function(x) {
return(1/mean(1/x))
}
quamean <- function(x) {
return(sqrt(mean(x*x)))
}
winmean <- function(x) {
x <-sort(x[!is.na(x)])
n<-length(x)
denom <- 3
nodenom <- n/denom
if (nodenom>40) denom <- n/40
sqrtn = sqrt(n)
roundnodenom = floor(nodenom)
win <- array(NA,dim=c(roundnodenom,2))
for (j in 1:roundnodenom) {
win[j,1] <- (j*x[j+1]+sum(x[(j+1):(n-j)])+j*x[n-j])/n
win[j,2] <- sd(c(rep(x[j+1],j),x[(j+1):(n-j)],rep(x[n-j],j)))/sqrtn
}
return(win)
}
trimean <- function(x) {
x <-sort(x[!is.na(x)])
n<-length(x)
denom <- 3
nodenom <- n/denom
if (nodenom>40) denom <- n/40
sqrtn = sqrt(n)
roundnodenom = floor(nodenom)
tri <- array(NA,dim=c(roundnodenom,2))
for (j in 1:roundnodenom) {
tri[j,1] <- mean(x,trim=j/n)
tri[j,2] <- sd(x[(j+1):(n-j)]) / sqrt(n-j*2)
}
return(tri)
}
midrange <- function(x) {
return((max(x)+min(x))/2)
}
q1 <- function(data,n,p,i,f) {
np <- n*p;
i <<- floor(np)
f <<- np - i
qvalue <- (1-f)*data[i] + f*data[i+1]
}
q2 <- function(data,n,p,i,f) {
np <- (n+1)*p
i <<- floor(np)
f <<- np - i
qvalue <- (1-f)*data[i] + f*data[i+1]
}
q3 <- function(data,n,p,i,f) {
np <- n*p
i <<- floor(np)
f <<- np - i
if (f==0) {
qvalue <- data[i]
} else {
qvalue <- data[i+1]
}
}
q4 <- function(data,n,p,i,f) {
np <- n*p
i <<- floor(np)
f <<- np - i
if (f==0) {
qvalue <- (data[i]+data[i+1])/2
} else {
qvalue <- data[i+1]
}
}
q5 <- function(data,n,p,i,f) {
np <- (n-1)*p
i <<- floor(np)
f <<- np - i
if (f==0) {
qvalue <- data[i+1]
} else {
qvalue <- data[i+1] + f*(data[i+2]-data[i+1])
}
}
q6 <- function(data,n,p,i,f) {
np <- n*p+0.5
i <<- floor(np)
f <<- np - i
qvalue <- data[i]
}
q7 <- function(data,n,p,i,f) {
np <- (n+1)*p
i <<- floor(np)
f <<- np - i
if (f==0) {
qvalue <- data[i]
} else {
qvalue <- f*data[i] + (1-f)*data[i+1]
}
}
q8 <- function(data,n,p,i,f) {
np <- (n+1)*p
i <<- floor(np)
f <<- np - i
if (f==0) {
qvalue <- data[i]
} else {
if (f == 0.5) {
qvalue <- (data[i]+data[i+1])/2
} else {
if (f < 0.5) {
qvalue <- data[i]
} else {
qvalue <- data[i+1]
}
}
}
}
midmean <- function(x,def) {
x <-sort(x[!is.na(x)])
n<-length(x)
if (def==1) {
qvalue1 <- q1(x,n,0.25,i,f)
qvalue3 <- q1(x,n,0.75,i,f)
}
if (def==2) {
qvalue1 <- q2(x,n,0.25,i,f)
qvalue3 <- q2(x,n,0.75,i,f)
}
if (def==3) {
qvalue1 <- q3(x,n,0.25,i,f)
qvalue3 <- q3(x,n,0.75,i,f)
}
if (def==4) {
qvalue1 <- q4(x,n,0.25,i,f)
qvalue3 <- q4(x,n,0.75,i,f)
}
if (def==5) {
qvalue1 <- q5(x,n,0.25,i,f)
qvalue3 <- q5(x,n,0.75,i,f)
}
if (def==6) {
qvalue1 <- q6(x,n,0.25,i,f)
qvalue3 <- q6(x,n,0.75,i,f)
}
if (def==7) {
qvalue1 <- q7(x,n,0.25,i,f)
qvalue3 <- q7(x,n,0.75,i,f)
}
if (def==8) {
qvalue1 <- q8(x,n,0.25,i,f)
qvalue3 <- q8(x,n,0.75,i,f)
}
midm <- 0
myn <- 0
roundno4 <- round(n/4)
round3no4 <- round(3*n/4)
for (i in 1:n) {
if ((x[i]>=qvalue1) & (x[i]<=qvalue3)){
midm = midm + x[i]
myn = myn + 1
}
}
midm = midm / myn
return(midm)
}
(arm <- mean(x))
sqrtn <- sqrt(length(x))
(armse <- sd(x) / sqrtn)
(armose <- arm / armse)
(geo <- geomean(x))
(har <- harmean(x))
(qua <- quamean(x))
(win <- winmean(x))
(tri <- trimean(x))
(midr <- midrange(x))
midm <- array(NA,dim=8)
for (j in 1:8) midm[j] <- midmean(x,j)
midm
bitmap(file='test1.png')
lb <- win[,1] - 2*win[,2]
ub <- win[,1] + 2*win[,2]
if ((ylimmin == '') | (ylimmax == '')) plot(win[,1],type='b',main=main, xlab='j', pch=19, ylab='Winsorized Mean(j/n)', ylim=c(min(lb),max(ub))) else plot(win[,1],type='l',main=main, xlab='j', pch=19, ylab='Winsorized Mean(j/n)', ylim=c(ylimmin,ylimmax))
lines(ub,lty=3)
lines(lb,lty=3)
grid()
dev.off()
bitmap(file='test2.png')
lb <- tri[,1] - 2*tri[,2]
ub <- tri[,1] + 2*tri[,2]
if ((ylimmin == '') | (ylimmax == '')) plot(tri[,1],type='b',main=main, xlab='j', pch=19, ylab='Trimmed Mean(j/n)', ylim=c(min(lb),max(ub))) else plot(tri[,1],type='l',main=main, xlab='j', pch=19, ylab='Trimmed Mean(j/n)', ylim=c(ylimmin,ylimmax))
lines(ub,lty=3)
lines(lb,lty=3)
grid()
dev.off()
load(file='createtable')
a<-table.start()
a<-table.row.start(a)
a<-table.element(a,'Central Tendency - Ungrouped Data',4,TRUE)
a<-table.row.end(a)
a<-table.row.start(a)
a<-table.element(a,'Measure',header=TRUE)
a<-table.element(a,'Value',header=TRUE)
a<-table.element(a,'S.E.',header=TRUE)
a<-table.element(a,'Value/S.E.',header=TRUE)
a<-table.row.end(a)
a<-table.row.start(a)
a<-table.element(a,hyperlink('arithmetic_mean.htm', 'Arithmetic Mean', 'click to view the definition of the Arithmetic Mean'),header=TRUE)
a<-table.element(a,arm)
a<-table.element(a,hyperlink('arithmetic_mean_standard_error.htm', armse, 'click to view the definition of the Standard Error of the Arithmetic Mean'))
a<-table.element(a,armose)
a<-table.row.end(a)
a<-table.row.start(a)
a<-table.element(a,hyperlink('geometric_mean.htm', 'Geometric Mean', 'click to view the definition of the Geometric Mean'),header=TRUE)
a<-table.element(a,geo)
a<-table.element(a,'')
a<-table.row.end(a)
a<-table.row.start(a)
a<-table.element(a,hyperlink('harmonic_mean.htm', 'Harmonic Mean', 'click to view the definition of the Harmonic Mean'),header=TRUE)
a<-table.element(a,har)
a<-table.element(a,'')
a<-table.row.end(a)
a<-table.row.start(a)
a<-table.element(a,hyperlink('quadratic_mean.htm', 'Quadratic Mean', 'click to view the definition of the Quadratic Mean'),header=TRUE)
a<-table.element(a,qua)
a<-table.element(a,'')
a<-table.row.end(a)
for (j in 1:length(win[,1])) {
a<-table.row.start(a)
mylabel <- paste('Winsorized Mean (',j)
mylabel <- paste(mylabel,'/')
mylabel <- paste(mylabel,length(win[,1]))
mylabel <- paste(mylabel,')')
a<-table.element(a,hyperlink('winsorized_mean.htm', mylabel, 'click to view the definition of the Winsorized Mean'),header=TRUE)
a<-table.element(a,win[j,1])
a<-table.element(a,win[j,2])
a<-table.element(a,win[j,1]/win[j,2])
a<-table.row.end(a)
}
for (j in 1:length(tri[,1])) {
a<-table.row.start(a)
mylabel <- paste('Trimmed Mean (',j)
mylabel <- paste(mylabel,'/')
mylabel <- paste(mylabel,length(tri[,1]))
mylabel <- paste(mylabel,')')
a<-table.element(a,hyperlink('arithmetic_mean.htm', mylabel, 'click to view the definition of the Trimmed Mean'),header=TRUE)
a<-table.element(a,tri[j,1])
a<-table.element(a,tri[j,2])
a<-table.element(a,tri[j,1]/tri[j,2])
a<-table.row.end(a)
}
a<-table.row.start(a)
a<-table.element(a,hyperlink('median_1.htm', 'Median', 'click to view the definition of the Median'),header=TRUE)
a<-table.element(a,median(x))
a<-table.element(a,'')
a<-table.row.end(a)
a<-table.row.start(a)
a<-table.element(a,hyperlink('midrange.htm', 'Midrange', 'click to view the definition of the Midrange'),header=TRUE)
a<-table.element(a,midr)
a<-table.element(a,'')
a<-table.row.end(a)
a<-table.row.start(a)
mymid <- hyperlink('midmean.htm', 'Midmean', 'click to view the definition of the Midmean')
mylabel <- paste(mymid,hyperlink('method_1.htm','Weighted Average at Xnp',''),sep=' - ')
a<-table.element(a,mylabel,header=TRUE)
a<-table.element(a,midm[1])
a<-table.element(a,'')
a<-table.row.end(a)
a<-table.row.start(a)
mymid <- hyperlink('midmean.htm', 'Midmean', 'click to view the definition of the Midmean')
mylabel <- paste(mymid,hyperlink('method_2.htm','Weighted Average at X(n+1)p',''),sep=' - ')
a<-table.element(a,mylabel,header=TRUE)
a<-table.element(a,midm[2])
a<-table.element(a,'')
a<-table.row.end(a)
a<-table.row.start(a)
mymid <- hyperlink('midmean.htm', 'Midmean', 'click to view the definition of the Midmean')
mylabel <- paste(mymid,hyperlink('method_3.htm','Empirical Distribution Function',''),sep=' - ')
a<-table.element(a,mylabel,header=TRUE)
a<-table.element(a,midm[3])
a<-table.element(a,'')
a<-table.row.end(a)
a<-table.row.start(a)
mymid <- hyperlink('midmean.htm', 'Midmean', 'click to view the definition of the Midmean')
mylabel <- paste(mymid,hyperlink('method_4.htm','Empirical Distribution Function - Averaging',''),sep=' - ')
a<-table.element(a,mylabel,header=TRUE)
a<-table.element(a,midm[4])
a<-table.element(a,'')
a<-table.row.end(a)
a<-table.row.start(a)
mymid <- hyperlink('midmean.htm', 'Midmean', 'click to view the definition of the Midmean')
mylabel <- paste(mymid,hyperlink('method_5.htm','Empirical Distribution Function - Interpolation',''),sep=' - ')
a<-table.element(a,mylabel,header=TRUE)
a<-table.element(a,midm[5])
a<-table.element(a,'')
a<-table.row.end(a)
a<-table.row.start(a)
mymid <- hyperlink('midmean.htm', 'Midmean', 'click to view the definition of the Midmean')
mylabel <- paste(mymid,hyperlink('method_6.htm','Closest Observation',''),sep=' - ')
a<-table.element(a,mylabel,header=TRUE)
a<-table.element(a,midm[6])
a<-table.element(a,'')
a<-table.row.end(a)
a<-table.row.start(a)
mymid <- hyperlink('midmean.htm', 'Midmean', 'click to view the definition of the Midmean')
mylabel <- paste(mymid,hyperlink('method_7.htm','True Basic - Statistics Graphics Toolkit',''),sep=' - ')
a<-table.element(a,mylabel,header=TRUE)
a<-table.element(a,midm[7])
a<-table.element(a,'')
a<-table.row.end(a)
a<-table.row.start(a)
mymid <- hyperlink('midmean.htm', 'Midmean', 'click to view the definition of the Midmean')
mylabel <- paste(mymid,hyperlink('method_8.htm','MS Excel (old versions)',''),sep=' - ')
a<-table.element(a,mylabel,header=TRUE)
a<-table.element(a,midm[8])
a<-table.element(a,'')
a<-table.row.end(a)
a<-table.row.start(a)
a<-table.element(a,'Number of observations',header=TRUE)
a<-table.element(a,length(x))
a<-table.element(a,'')
a<-table.row.end(a)
a<-table.end(a)
table.save(a,file='mytable.tab')