Free Statistics

of Irreproducible Research!

Author's title

Author*The author of this computation has been verified*
R Software Modulerwasp_multipleregression.wasp
Title produced by softwareMultiple Regression
Date of computationSun, 07 Dec 2008 10:13:04 -0700
Cite this page as followsStatistical Computations at FreeStatistics.org, Office for Research Development and Education, URL https://freestatistics.org/blog/index.php?v=date/2008/Dec/07/t12286700648ilmh4ccuyvmiv2.htm/, Retrieved Sun, 19 May 2024 10:48:24 +0000
Statistical Computations at FreeStatistics.org, Office for Research Development and Education, URL https://freestatistics.org/blog/index.php?pk=30177, Retrieved Sun, 19 May 2024 10:48:24 +0000
QR Codes:

Original text written by user:
IsPrivate?No (this computation is public)
User-defined keywords
Estimated Impact189
Family? (F = Feedback message, R = changed R code, M = changed R Module, P = changed Parameters, D = changed Data)
-     [Multiple Regression] [Paper - Multiple ...] [2008-12-05 17:15:56] [fce9014b1ad8484790f3b34d6ba09f7b]
-   PD    [Multiple Regression] [Paper - Multiple ...] [2008-12-07 17:13:04] [7957bb37a64ed417bbed8444b0b0ea8a] [Current]
Feedback Forum

Post a new message
Dataseries X:
41	0
35	0
34	0
36	0
39	0
40	0
30	0
33	0
30	0
32	0
41	0
40	0
41	0
40	0
39	0
34	0
34	0
46	0
45	0
44	0
40	0
39	0
37	0
39	0
35	0
26	0
26	0
33	0
27	0
30	0
26	0
27	0
18	0
19	0
13	0
14	0
41	0
21	0
16	0
17	0
9	0
14	0
14	0
16	0
11	0
10	0
6	0
9	0
5	0
7	0
2	0
0	0
8	0
13	0
11	0
19	1
23	1
23	1
43	1
59	1


Summary of computational transaction
Raw Inputview raw input (R code)
Raw Outputview raw output of R engine
Computing time4 seconds
R Server'Gwilym Jenkins' @ 72.249.127.135

\begin{tabular}{lllllllll}
\hline
Summary of computational transaction \tabularnewline
Raw Input & view raw input (R code)  \tabularnewline
Raw Output & view raw output of R engine  \tabularnewline
Computing time & 4 seconds \tabularnewline
R Server & 'Gwilym Jenkins' @ 72.249.127.135 \tabularnewline
\hline
\end{tabular}
%Source: https://freestatistics.org/blog/index.php?pk=30177&T=0

[TABLE]
[ROW][C]Summary of computational transaction[/C][/ROW]
[ROW][C]Raw Input[/C][C]view raw input (R code) [/C][/ROW]
[ROW][C]Raw Output[/C][C]view raw output of R engine [/C][/ROW]
[ROW][C]Computing time[/C][C]4 seconds[/C][/ROW]
[ROW][C]R Server[/C][C]'Gwilym Jenkins' @ 72.249.127.135[/C][/ROW]
[/TABLE]
Source: https://freestatistics.org/blog/index.php?pk=30177&T=0

Globally Unique Identifier (entire table): ba.freestatistics.org/blog/index.php?pk=30177&T=0

As an alternative you can also use a QR Code:  

The GUIDs for individual cells are displayed in the table below:

Summary of computational transaction
Raw Inputview raw input (R code)
Raw Outputview raw output of R engine
Computing time4 seconds
R Server'Gwilym Jenkins' @ 72.249.127.135


Multiple Linear Regression - Estimated Regression Equation
Wer[t] = + 30.7 + 7.5Val[t] + 1.89999999999999M1[t] -4.89999999999998M2[t] -7.3M3[t] -6.7M4[t] -7.29999999999999M5[t] -2.09999999999999M6[t] -5.49999999999999M7[t] -4.4M8[t] -7.8M9[t] -7.6M10[t] -4.19999999999999M11[t] + e[t]

\begin{tabular}{lllllllll}
\hline
Multiple Linear Regression - Estimated Regression Equation \tabularnewline
Wer[t] =  +  30.7 +  7.5Val[t] +  1.89999999999999M1[t] -4.89999999999998M2[t] -7.3M3[t] -6.7M4[t] -7.29999999999999M5[t] -2.09999999999999M6[t] -5.49999999999999M7[t] -4.4M8[t] -7.8M9[t] -7.6M10[t] -4.19999999999999M11[t]  + e[t] \tabularnewline
\hline
\end{tabular}
%Source: https://freestatistics.org/blog/index.php?pk=30177&T=1

[TABLE]
[ROW][C]Multiple Linear Regression - Estimated Regression Equation[/C][/ROW]
[ROW][C]Wer[t] =  +  30.7 +  7.5Val[t] +  1.89999999999999M1[t] -4.89999999999998M2[t] -7.3M3[t] -6.7M4[t] -7.29999999999999M5[t] -2.09999999999999M6[t] -5.49999999999999M7[t] -4.4M8[t] -7.8M9[t] -7.6M10[t] -4.19999999999999M11[t]  + e[t][/C][/ROW]
[/TABLE]
Source: https://freestatistics.org/blog/index.php?pk=30177&T=1

Globally Unique Identifier (entire table): ba.freestatistics.org/blog/index.php?pk=30177&T=1

As an alternative you can also use a QR Code:  

The GUIDs for individual cells are displayed in the table below:

Multiple Linear Regression - Estimated Regression Equation
Wer[t] = + 30.7 + 7.5Val[t] + 1.89999999999999M1[t] -4.89999999999998M2[t] -7.3M3[t] -6.7M4[t] -7.29999999999999M5[t] -2.09999999999999M6[t] -5.49999999999999M7[t] -4.4M8[t] -7.8M9[t] -7.6M10[t] -4.19999999999999M11[t] + e[t]


Multiple Linear Regression - Ordinary Least Squares
VariableParameterS.D.T-STATH0: parameter = 02-tail p-value1-tail p-value
(Intercept)30.76.7115244.57423.5e-051.7e-05
Val7.57.3228731.02420.3109890.155495
M11.899999999999999.3778530.20260.8403180.420159
M2-4.899999999999989.377853-0.52250.6037710.301886
M3-7.39.377853-0.77840.4402170.220109
M4-6.79.377853-0.71440.4784830.239242
M5-7.299999999999999.377853-0.77840.4402170.220109
M6-2.099999999999999.377853-0.22390.8237810.41189
M7-5.499999999999999.377853-0.58650.5603540.280177
M8-4.49.262783-0.4750.6369730.318487
M9-7.89.262783-0.84210.4040080.202004
M10-7.69.262783-0.82050.416080.20804
M11-4.199999999999999.262783-0.45340.6523280.326164

\begin{tabular}{lllllllll}
\hline
Multiple Linear Regression - Ordinary Least Squares \tabularnewline
Variable & Parameter & S.D. & T-STATH0: parameter = 0 & 2-tail p-value & 1-tail p-value \tabularnewline
(Intercept) & 30.7 & 6.711524 & 4.5742 & 3.5e-05 & 1.7e-05 \tabularnewline
Val & 7.5 & 7.322873 & 1.0242 & 0.310989 & 0.155495 \tabularnewline
M1 & 1.89999999999999 & 9.377853 & 0.2026 & 0.840318 & 0.420159 \tabularnewline
M2 & -4.89999999999998 & 9.377853 & -0.5225 & 0.603771 & 0.301886 \tabularnewline
M3 & -7.3 & 9.377853 & -0.7784 & 0.440217 & 0.220109 \tabularnewline
M4 & -6.7 & 9.377853 & -0.7144 & 0.478483 & 0.239242 \tabularnewline
M5 & -7.29999999999999 & 9.377853 & -0.7784 & 0.440217 & 0.220109 \tabularnewline
M6 & -2.09999999999999 & 9.377853 & -0.2239 & 0.823781 & 0.41189 \tabularnewline
M7 & -5.49999999999999 & 9.377853 & -0.5865 & 0.560354 & 0.280177 \tabularnewline
M8 & -4.4 & 9.262783 & -0.475 & 0.636973 & 0.318487 \tabularnewline
M9 & -7.8 & 9.262783 & -0.8421 & 0.404008 & 0.202004 \tabularnewline
M10 & -7.6 & 9.262783 & -0.8205 & 0.41608 & 0.20804 \tabularnewline
M11 & -4.19999999999999 & 9.262783 & -0.4534 & 0.652328 & 0.326164 \tabularnewline
\hline
\end{tabular}
%Source: https://freestatistics.org/blog/index.php?pk=30177&T=2

[TABLE]
[ROW][C]Multiple Linear Regression - Ordinary Least Squares[/C][/ROW]
[ROW][C]Variable[/C][C]Parameter[/C][C]S.D.[/C][C]T-STATH0: parameter = 0[/C][C]2-tail p-value[/C][C]1-tail p-value[/C][/ROW]
[ROW][C](Intercept)[/C][C]30.7[/C][C]6.711524[/C][C]4.5742[/C][C]3.5e-05[/C][C]1.7e-05[/C][/ROW]
[ROW][C]Val[/C][C]7.5[/C][C]7.322873[/C][C]1.0242[/C][C]0.310989[/C][C]0.155495[/C][/ROW]
[ROW][C]M1[/C][C]1.89999999999999[/C][C]9.377853[/C][C]0.2026[/C][C]0.840318[/C][C]0.420159[/C][/ROW]
[ROW][C]M2[/C][C]-4.89999999999998[/C][C]9.377853[/C][C]-0.5225[/C][C]0.603771[/C][C]0.301886[/C][/ROW]
[ROW][C]M3[/C][C]-7.3[/C][C]9.377853[/C][C]-0.7784[/C][C]0.440217[/C][C]0.220109[/C][/ROW]
[ROW][C]M4[/C][C]-6.7[/C][C]9.377853[/C][C]-0.7144[/C][C]0.478483[/C][C]0.239242[/C][/ROW]
[ROW][C]M5[/C][C]-7.29999999999999[/C][C]9.377853[/C][C]-0.7784[/C][C]0.440217[/C][C]0.220109[/C][/ROW]
[ROW][C]M6[/C][C]-2.09999999999999[/C][C]9.377853[/C][C]-0.2239[/C][C]0.823781[/C][C]0.41189[/C][/ROW]
[ROW][C]M7[/C][C]-5.49999999999999[/C][C]9.377853[/C][C]-0.5865[/C][C]0.560354[/C][C]0.280177[/C][/ROW]
[ROW][C]M8[/C][C]-4.4[/C][C]9.262783[/C][C]-0.475[/C][C]0.636973[/C][C]0.318487[/C][/ROW]
[ROW][C]M9[/C][C]-7.8[/C][C]9.262783[/C][C]-0.8421[/C][C]0.404008[/C][C]0.202004[/C][/ROW]
[ROW][C]M10[/C][C]-7.6[/C][C]9.262783[/C][C]-0.8205[/C][C]0.41608[/C][C]0.20804[/C][/ROW]
[ROW][C]M11[/C][C]-4.19999999999999[/C][C]9.262783[/C][C]-0.4534[/C][C]0.652328[/C][C]0.326164[/C][/ROW]
[/TABLE]
Source: https://freestatistics.org/blog/index.php?pk=30177&T=2

Globally Unique Identifier (entire table): ba.freestatistics.org/blog/index.php?pk=30177&T=2

As an alternative you can also use a QR Code:  

The GUIDs for individual cells are displayed in the table below:

Multiple Linear Regression - Ordinary Least Squares
VariableParameterS.D.T-STATH0: parameter = 02-tail p-value1-tail p-value
(Intercept)30.76.7115244.57423.5e-051.7e-05
Val7.57.3228731.02420.3109890.155495
M11.899999999999999.3778530.20260.8403180.420159
M2-4.899999999999989.377853-0.52250.6037710.301886
M3-7.39.377853-0.77840.4402170.220109
M4-6.79.377853-0.71440.4784830.239242
M5-7.299999999999999.377853-0.77840.4402170.220109
M6-2.099999999999999.377853-0.22390.8237810.41189
M7-5.499999999999999.377853-0.58650.5603540.280177
M8-4.49.262783-0.4750.6369730.318487
M9-7.89.262783-0.84210.4040080.202004
M10-7.69.262783-0.82050.416080.20804
M11-4.199999999999999.262783-0.45340.6523280.326164


Multiple Linear Regression - Regression Statistics
Multiple R0.269875189718787
R-squared0.0728326180257511
Adjusted R-squared-0.163890968861291
F-TEST (value)0.307669459488651
F-TEST (DF numerator)12
F-TEST (DF denominator)47
p-value0.984813072470602
Multiple Linear Regression - Residual Statistics
Residual Standard Deviation14.6457458785965
Sum Squared Residuals10081.4

\begin{tabular}{lllllllll}
\hline
Multiple Linear Regression - Regression Statistics \tabularnewline
Multiple R & 0.269875189718787 \tabularnewline
R-squared & 0.0728326180257511 \tabularnewline
Adjusted R-squared & -0.163890968861291 \tabularnewline
F-TEST (value) & 0.307669459488651 \tabularnewline
F-TEST (DF numerator) & 12 \tabularnewline
F-TEST (DF denominator) & 47 \tabularnewline
p-value & 0.984813072470602 \tabularnewline
Multiple Linear Regression - Residual Statistics \tabularnewline
Residual Standard Deviation & 14.6457458785965 \tabularnewline
Sum Squared Residuals & 10081.4 \tabularnewline
\hline
\end{tabular}
%Source: https://freestatistics.org/blog/index.php?pk=30177&T=3

[TABLE]
[ROW][C]Multiple Linear Regression - Regression Statistics[/C][/ROW]
[ROW][C]Multiple R[/C][C]0.269875189718787[/C][/ROW]
[ROW][C]R-squared[/C][C]0.0728326180257511[/C][/ROW]
[ROW][C]Adjusted R-squared[/C][C]-0.163890968861291[/C][/ROW]
[ROW][C]F-TEST (value)[/C][C]0.307669459488651[/C][/ROW]
[ROW][C]F-TEST (DF numerator)[/C][C]12[/C][/ROW]
[ROW][C]F-TEST (DF denominator)[/C][C]47[/C][/ROW]
[ROW][C]p-value[/C][C]0.984813072470602[/C][/ROW]
[ROW][C]Multiple Linear Regression - Residual Statistics[/C][/ROW]
[ROW][C]Residual Standard Deviation[/C][C]14.6457458785965[/C][/ROW]
[ROW][C]Sum Squared Residuals[/C][C]10081.4[/C][/ROW]
[/TABLE]
Source: https://freestatistics.org/blog/index.php?pk=30177&T=3

Globally Unique Identifier (entire table): ba.freestatistics.org/blog/index.php?pk=30177&T=3

As an alternative you can also use a QR Code:  

The GUIDs for individual cells are displayed in the table below:

Multiple Linear Regression - Regression Statistics
Multiple R0.269875189718787
R-squared0.0728326180257511
Adjusted R-squared-0.163890968861291
F-TEST (value)0.307669459488651
F-TEST (DF numerator)12
F-TEST (DF denominator)47
p-value0.984813072470602
Multiple Linear Regression - Residual Statistics
Residual Standard Deviation14.6457458785965
Sum Squared Residuals10081.4


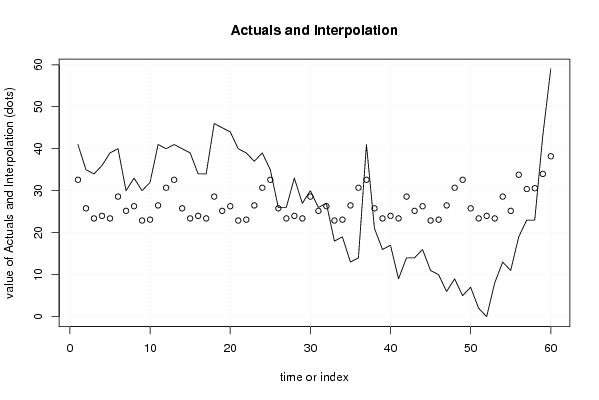
Multiple Linear Regression - Actuals, Interpolation, and Residuals
Time or IndexActualsInterpolationForecastResidualsPrediction Error
14132.60000000000008.39999999999996
23525.89.2
33423.410.6
4362412
53923.415.6
64028.611.4
73025.24.8
83326.36.7
93022.97.09999999999999
103223.18.9
114126.514.5
124030.79.30000000000001
134132.68.4
144025.814.2
153923.415.6
16342410
173423.410.6
184628.617.4
194525.219.8
204426.317.7
214022.917.1
223923.115.9
233726.510.5
243930.78.3
253532.62.40000000000000
262625.80.199999999999997
272623.42.6
2833249
292723.43.59999999999999
303028.61.4
312625.20.8
322726.30.7
331822.9-4.9
341923.1-4.1
351326.5-13.5
361430.7-16.7
374132.68.4
382125.8-4.8
391623.4-7.4
401724-7.00
41923.4-14.4
421428.6-14.6
431425.2-11.2
441626.3-10.3
451122.9-11.9
461023.1-13.1
47626.5-20.5
48930.7-21.7
49532.6-27.6
50725.8-18.8
51223.4-21.4
52024-24
53823.4-15.4
541328.6-15.6
551125.2-14.2
561933.8-14.8
572330.4-7.4
582330.6-7.6
5943349
605938.220.8

\begin{tabular}{lllllllll}
\hline
Multiple Linear Regression - Actuals, Interpolation, and Residuals \tabularnewline
Time or Index & Actuals & InterpolationForecast & ResidualsPrediction Error \tabularnewline
1 & 41 & 32.6000000000000 & 8.39999999999996 \tabularnewline
2 & 35 & 25.8 & 9.2 \tabularnewline
3 & 34 & 23.4 & 10.6 \tabularnewline
4 & 36 & 24 & 12 \tabularnewline
5 & 39 & 23.4 & 15.6 \tabularnewline
6 & 40 & 28.6 & 11.4 \tabularnewline
7 & 30 & 25.2 & 4.8 \tabularnewline
8 & 33 & 26.3 & 6.7 \tabularnewline
9 & 30 & 22.9 & 7.09999999999999 \tabularnewline
10 & 32 & 23.1 & 8.9 \tabularnewline
11 & 41 & 26.5 & 14.5 \tabularnewline
12 & 40 & 30.7 & 9.30000000000001 \tabularnewline
13 & 41 & 32.6 & 8.4 \tabularnewline
14 & 40 & 25.8 & 14.2 \tabularnewline
15 & 39 & 23.4 & 15.6 \tabularnewline
16 & 34 & 24 & 10 \tabularnewline
17 & 34 & 23.4 & 10.6 \tabularnewline
18 & 46 & 28.6 & 17.4 \tabularnewline
19 & 45 & 25.2 & 19.8 \tabularnewline
20 & 44 & 26.3 & 17.7 \tabularnewline
21 & 40 & 22.9 & 17.1 \tabularnewline
22 & 39 & 23.1 & 15.9 \tabularnewline
23 & 37 & 26.5 & 10.5 \tabularnewline
24 & 39 & 30.7 & 8.3 \tabularnewline
25 & 35 & 32.6 & 2.40000000000000 \tabularnewline
26 & 26 & 25.8 & 0.199999999999997 \tabularnewline
27 & 26 & 23.4 & 2.6 \tabularnewline
28 & 33 & 24 & 9 \tabularnewline
29 & 27 & 23.4 & 3.59999999999999 \tabularnewline
30 & 30 & 28.6 & 1.4 \tabularnewline
31 & 26 & 25.2 & 0.8 \tabularnewline
32 & 27 & 26.3 & 0.7 \tabularnewline
33 & 18 & 22.9 & -4.9 \tabularnewline
34 & 19 & 23.1 & -4.1 \tabularnewline
35 & 13 & 26.5 & -13.5 \tabularnewline
36 & 14 & 30.7 & -16.7 \tabularnewline
37 & 41 & 32.6 & 8.4 \tabularnewline
38 & 21 & 25.8 & -4.8 \tabularnewline
39 & 16 & 23.4 & -7.4 \tabularnewline
40 & 17 & 24 & -7.00 \tabularnewline
41 & 9 & 23.4 & -14.4 \tabularnewline
42 & 14 & 28.6 & -14.6 \tabularnewline
43 & 14 & 25.2 & -11.2 \tabularnewline
44 & 16 & 26.3 & -10.3 \tabularnewline
45 & 11 & 22.9 & -11.9 \tabularnewline
46 & 10 & 23.1 & -13.1 \tabularnewline
47 & 6 & 26.5 & -20.5 \tabularnewline
48 & 9 & 30.7 & -21.7 \tabularnewline
49 & 5 & 32.6 & -27.6 \tabularnewline
50 & 7 & 25.8 & -18.8 \tabularnewline
51 & 2 & 23.4 & -21.4 \tabularnewline
52 & 0 & 24 & -24 \tabularnewline
53 & 8 & 23.4 & -15.4 \tabularnewline
54 & 13 & 28.6 & -15.6 \tabularnewline
55 & 11 & 25.2 & -14.2 \tabularnewline
56 & 19 & 33.8 & -14.8 \tabularnewline
57 & 23 & 30.4 & -7.4 \tabularnewline
58 & 23 & 30.6 & -7.6 \tabularnewline
59 & 43 & 34 & 9 \tabularnewline
60 & 59 & 38.2 & 20.8 \tabularnewline
\hline
\end{tabular}
%Source: https://freestatistics.org/blog/index.php?pk=30177&T=4

[TABLE]
[ROW][C]Multiple Linear Regression - Actuals, Interpolation, and Residuals[/C][/ROW]
[ROW][C]Time or Index[/C][C]Actuals[/C][C]InterpolationForecast[/C][C]ResidualsPrediction Error[/C][/ROW]
[ROW][C]1[/C][C]41[/C][C]32.6000000000000[/C][C]8.39999999999996[/C][/ROW]
[ROW][C]2[/C][C]35[/C][C]25.8[/C][C]9.2[/C][/ROW]
[ROW][C]3[/C][C]34[/C][C]23.4[/C][C]10.6[/C][/ROW]
[ROW][C]4[/C][C]36[/C][C]24[/C][C]12[/C][/ROW]
[ROW][C]5[/C][C]39[/C][C]23.4[/C][C]15.6[/C][/ROW]
[ROW][C]6[/C][C]40[/C][C]28.6[/C][C]11.4[/C][/ROW]
[ROW][C]7[/C][C]30[/C][C]25.2[/C][C]4.8[/C][/ROW]
[ROW][C]8[/C][C]33[/C][C]26.3[/C][C]6.7[/C][/ROW]
[ROW][C]9[/C][C]30[/C][C]22.9[/C][C]7.09999999999999[/C][/ROW]
[ROW][C]10[/C][C]32[/C][C]23.1[/C][C]8.9[/C][/ROW]
[ROW][C]11[/C][C]41[/C][C]26.5[/C][C]14.5[/C][/ROW]
[ROW][C]12[/C][C]40[/C][C]30.7[/C][C]9.30000000000001[/C][/ROW]
[ROW][C]13[/C][C]41[/C][C]32.6[/C][C]8.4[/C][/ROW]
[ROW][C]14[/C][C]40[/C][C]25.8[/C][C]14.2[/C][/ROW]
[ROW][C]15[/C][C]39[/C][C]23.4[/C][C]15.6[/C][/ROW]
[ROW][C]16[/C][C]34[/C][C]24[/C][C]10[/C][/ROW]
[ROW][C]17[/C][C]34[/C][C]23.4[/C][C]10.6[/C][/ROW]
[ROW][C]18[/C][C]46[/C][C]28.6[/C][C]17.4[/C][/ROW]
[ROW][C]19[/C][C]45[/C][C]25.2[/C][C]19.8[/C][/ROW]
[ROW][C]20[/C][C]44[/C][C]26.3[/C][C]17.7[/C][/ROW]
[ROW][C]21[/C][C]40[/C][C]22.9[/C][C]17.1[/C][/ROW]
[ROW][C]22[/C][C]39[/C][C]23.1[/C][C]15.9[/C][/ROW]
[ROW][C]23[/C][C]37[/C][C]26.5[/C][C]10.5[/C][/ROW]
[ROW][C]24[/C][C]39[/C][C]30.7[/C][C]8.3[/C][/ROW]
[ROW][C]25[/C][C]35[/C][C]32.6[/C][C]2.40000000000000[/C][/ROW]
[ROW][C]26[/C][C]26[/C][C]25.8[/C][C]0.199999999999997[/C][/ROW]
[ROW][C]27[/C][C]26[/C][C]23.4[/C][C]2.6[/C][/ROW]
[ROW][C]28[/C][C]33[/C][C]24[/C][C]9[/C][/ROW]
[ROW][C]29[/C][C]27[/C][C]23.4[/C][C]3.59999999999999[/C][/ROW]
[ROW][C]30[/C][C]30[/C][C]28.6[/C][C]1.4[/C][/ROW]
[ROW][C]31[/C][C]26[/C][C]25.2[/C][C]0.8[/C][/ROW]
[ROW][C]32[/C][C]27[/C][C]26.3[/C][C]0.7[/C][/ROW]
[ROW][C]33[/C][C]18[/C][C]22.9[/C][C]-4.9[/C][/ROW]
[ROW][C]34[/C][C]19[/C][C]23.1[/C][C]-4.1[/C][/ROW]
[ROW][C]35[/C][C]13[/C][C]26.5[/C][C]-13.5[/C][/ROW]
[ROW][C]36[/C][C]14[/C][C]30.7[/C][C]-16.7[/C][/ROW]
[ROW][C]37[/C][C]41[/C][C]32.6[/C][C]8.4[/C][/ROW]
[ROW][C]38[/C][C]21[/C][C]25.8[/C][C]-4.8[/C][/ROW]
[ROW][C]39[/C][C]16[/C][C]23.4[/C][C]-7.4[/C][/ROW]
[ROW][C]40[/C][C]17[/C][C]24[/C][C]-7.00[/C][/ROW]
[ROW][C]41[/C][C]9[/C][C]23.4[/C][C]-14.4[/C][/ROW]
[ROW][C]42[/C][C]14[/C][C]28.6[/C][C]-14.6[/C][/ROW]
[ROW][C]43[/C][C]14[/C][C]25.2[/C][C]-11.2[/C][/ROW]
[ROW][C]44[/C][C]16[/C][C]26.3[/C][C]-10.3[/C][/ROW]
[ROW][C]45[/C][C]11[/C][C]22.9[/C][C]-11.9[/C][/ROW]
[ROW][C]46[/C][C]10[/C][C]23.1[/C][C]-13.1[/C][/ROW]
[ROW][C]47[/C][C]6[/C][C]26.5[/C][C]-20.5[/C][/ROW]
[ROW][C]48[/C][C]9[/C][C]30.7[/C][C]-21.7[/C][/ROW]
[ROW][C]49[/C][C]5[/C][C]32.6[/C][C]-27.6[/C][/ROW]
[ROW][C]50[/C][C]7[/C][C]25.8[/C][C]-18.8[/C][/ROW]
[ROW][C]51[/C][C]2[/C][C]23.4[/C][C]-21.4[/C][/ROW]
[ROW][C]52[/C][C]0[/C][C]24[/C][C]-24[/C][/ROW]
[ROW][C]53[/C][C]8[/C][C]23.4[/C][C]-15.4[/C][/ROW]
[ROW][C]54[/C][C]13[/C][C]28.6[/C][C]-15.6[/C][/ROW]
[ROW][C]55[/C][C]11[/C][C]25.2[/C][C]-14.2[/C][/ROW]
[ROW][C]56[/C][C]19[/C][C]33.8[/C][C]-14.8[/C][/ROW]
[ROW][C]57[/C][C]23[/C][C]30.4[/C][C]-7.4[/C][/ROW]
[ROW][C]58[/C][C]23[/C][C]30.6[/C][C]-7.6[/C][/ROW]
[ROW][C]59[/C][C]43[/C][C]34[/C][C]9[/C][/ROW]
[ROW][C]60[/C][C]59[/C][C]38.2[/C][C]20.8[/C][/ROW]
[/TABLE]
Source: https://freestatistics.org/blog/index.php?pk=30177&T=4

Globally Unique Identifier (entire table): ba.freestatistics.org/blog/index.php?pk=30177&T=4

As an alternative you can also use a QR Code:  

The GUIDs for individual cells are displayed in the table below:

Multiple Linear Regression - Actuals, Interpolation, and Residuals
Time or IndexActualsInterpolationForecastResidualsPrediction Error
14132.60000000000008.39999999999996
23525.89.2
33423.410.6
4362412
53923.415.6
64028.611.4
73025.24.8
83326.36.7
93022.97.09999999999999
103223.18.9
114126.514.5
124030.79.30000000000001
134132.68.4
144025.814.2
153923.415.6
16342410
173423.410.6
184628.617.4
194525.219.8
204426.317.7
214022.917.1
223923.115.9
233726.510.5
243930.78.3
253532.62.40000000000000
262625.80.199999999999997
272623.42.6
2833249
292723.43.59999999999999
303028.61.4
312625.20.8
322726.30.7
331822.9-4.9
341923.1-4.1
351326.5-13.5
361430.7-16.7
374132.68.4
382125.8-4.8
391623.4-7.4
401724-7.00
41923.4-14.4
421428.6-14.6
431425.2-11.2
441626.3-10.3
451122.9-11.9
461023.1-13.1
47626.5-20.5
48930.7-21.7
49532.6-27.6
50725.8-18.8
51223.4-21.4
52024-24
53823.4-15.4
541328.6-15.6
551125.2-14.2
561933.8-14.8
572330.4-7.4
582330.6-7.6
5943349
605938.220.8


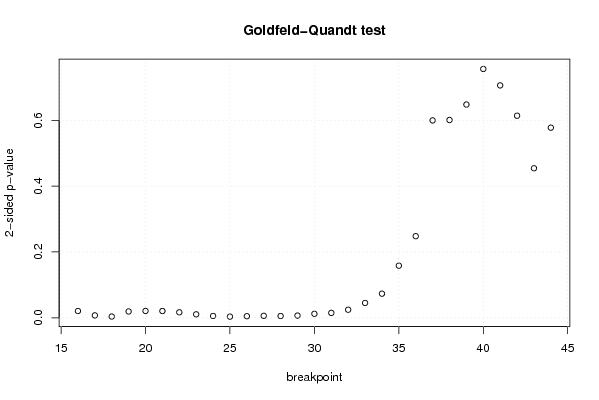
Goldfeld-Quandt test for Heteroskedasticity
p-valuesAlternative Hypothesis
breakpoint indexgreater2-sidedless
160.01025143554386970.02050287108773930.98974856445613
170.003598986371360230.007197972742720460.99640101362864
180.001844379282155070.003688758564310140.998155620717845
190.009562862405398760.01912572481079750.990437137594601
200.01034943626012850.02069887252025690.989650563739872
210.01026228303640590.02052456607281190.989737716963594
220.008281998503150720.01656399700630140.99171800149685
230.005203114305867140.01040622861173430.994796885694133
240.002716354440345410.005432708880690810.997283645559655
250.001672982825292420.003345965650584840.998327017174708
260.002344946627645470.004689893255290940.997655053372354
270.002925554011442310.005851108022884630.997074445988558
280.002592889335079040.005185778670158090.99740711066492
290.003306058038366250.00661211607673250.996693941961634
300.006017511806463520.01203502361292700.993982488193536
310.00738774313740790.01477548627481580.992612256862592
320.01218528415271930.02437056830543870.98781471584728
330.02249718077311730.04499436154623460.977502819226883
340.03660121252921480.07320242505842970.963398787470785
350.07912338596746950.1582467719349390.920876614032531
360.1239819845096060.2479639690192120.876018015490394
370.2999352884950150.5998705769900290.700064711504985
380.3005496275321190.6010992550642390.69945037246788
390.324043561654130.648087123308260.67595643834587
400.3781384920196300.7562769840392610.62186150798037
410.3531407965513030.7062815931026070.646859203448697
420.3070751253257600.6141502506515190.69292487467424
430.2271971387255320.4543942774510640.772802861274468
440.2888749989220520.5777499978441030.711125001077948

\begin{tabular}{lllllllll}
\hline
Goldfeld-Quandt test for Heteroskedasticity \tabularnewline
p-values & Alternative Hypothesis \tabularnewline
breakpoint index & greater & 2-sided & less \tabularnewline
16 & 0.0102514355438697 & 0.0205028710877393 & 0.98974856445613 \tabularnewline
17 & 0.00359898637136023 & 0.00719797274272046 & 0.99640101362864 \tabularnewline
18 & 0.00184437928215507 & 0.00368875856431014 & 0.998155620717845 \tabularnewline
19 & 0.00956286240539876 & 0.0191257248107975 & 0.990437137594601 \tabularnewline
20 & 0.0103494362601285 & 0.0206988725202569 & 0.989650563739872 \tabularnewline
21 & 0.0102622830364059 & 0.0205245660728119 & 0.989737716963594 \tabularnewline
22 & 0.00828199850315072 & 0.0165639970063014 & 0.99171800149685 \tabularnewline
23 & 0.00520311430586714 & 0.0104062286117343 & 0.994796885694133 \tabularnewline
24 & 0.00271635444034541 & 0.00543270888069081 & 0.997283645559655 \tabularnewline
25 & 0.00167298282529242 & 0.00334596565058484 & 0.998327017174708 \tabularnewline
26 & 0.00234494662764547 & 0.00468989325529094 & 0.997655053372354 \tabularnewline
27 & 0.00292555401144231 & 0.00585110802288463 & 0.997074445988558 \tabularnewline
28 & 0.00259288933507904 & 0.00518577867015809 & 0.99740711066492 \tabularnewline
29 & 0.00330605803836625 & 0.0066121160767325 & 0.996693941961634 \tabularnewline
30 & 0.00601751180646352 & 0.0120350236129270 & 0.993982488193536 \tabularnewline
31 & 0.0073877431374079 & 0.0147754862748158 & 0.992612256862592 \tabularnewline
32 & 0.0121852841527193 & 0.0243705683054387 & 0.98781471584728 \tabularnewline
33 & 0.0224971807731173 & 0.0449943615462346 & 0.977502819226883 \tabularnewline
34 & 0.0366012125292148 & 0.0732024250584297 & 0.963398787470785 \tabularnewline
35 & 0.0791233859674695 & 0.158246771934939 & 0.920876614032531 \tabularnewline
36 & 0.123981984509606 & 0.247963969019212 & 0.876018015490394 \tabularnewline
37 & 0.299935288495015 & 0.599870576990029 & 0.700064711504985 \tabularnewline
38 & 0.300549627532119 & 0.601099255064239 & 0.69945037246788 \tabularnewline
39 & 0.32404356165413 & 0.64808712330826 & 0.67595643834587 \tabularnewline
40 & 0.378138492019630 & 0.756276984039261 & 0.62186150798037 \tabularnewline
41 & 0.353140796551303 & 0.706281593102607 & 0.646859203448697 \tabularnewline
42 & 0.307075125325760 & 0.614150250651519 & 0.69292487467424 \tabularnewline
43 & 0.227197138725532 & 0.454394277451064 & 0.772802861274468 \tabularnewline
44 & 0.288874998922052 & 0.577749997844103 & 0.711125001077948 \tabularnewline
\hline
\end{tabular}
%Source: https://freestatistics.org/blog/index.php?pk=30177&T=5

[TABLE]
[ROW][C]Goldfeld-Quandt test for Heteroskedasticity[/C][/ROW]
[ROW][C]p-values[/C][C]Alternative Hypothesis[/C][/ROW]
[ROW][C]breakpoint index[/C][C]greater[/C][C]2-sided[/C][C]less[/C][/ROW]
[ROW][C]16[/C][C]0.0102514355438697[/C][C]0.0205028710877393[/C][C]0.98974856445613[/C][/ROW]
[ROW][C]17[/C][C]0.00359898637136023[/C][C]0.00719797274272046[/C][C]0.99640101362864[/C][/ROW]
[ROW][C]18[/C][C]0.00184437928215507[/C][C]0.00368875856431014[/C][C]0.998155620717845[/C][/ROW]
[ROW][C]19[/C][C]0.00956286240539876[/C][C]0.0191257248107975[/C][C]0.990437137594601[/C][/ROW]
[ROW][C]20[/C][C]0.0103494362601285[/C][C]0.0206988725202569[/C][C]0.989650563739872[/C][/ROW]
[ROW][C]21[/C][C]0.0102622830364059[/C][C]0.0205245660728119[/C][C]0.989737716963594[/C][/ROW]
[ROW][C]22[/C][C]0.00828199850315072[/C][C]0.0165639970063014[/C][C]0.99171800149685[/C][/ROW]
[ROW][C]23[/C][C]0.00520311430586714[/C][C]0.0104062286117343[/C][C]0.994796885694133[/C][/ROW]
[ROW][C]24[/C][C]0.00271635444034541[/C][C]0.00543270888069081[/C][C]0.997283645559655[/C][/ROW]
[ROW][C]25[/C][C]0.00167298282529242[/C][C]0.00334596565058484[/C][C]0.998327017174708[/C][/ROW]
[ROW][C]26[/C][C]0.00234494662764547[/C][C]0.00468989325529094[/C][C]0.997655053372354[/C][/ROW]
[ROW][C]27[/C][C]0.00292555401144231[/C][C]0.00585110802288463[/C][C]0.997074445988558[/C][/ROW]
[ROW][C]28[/C][C]0.00259288933507904[/C][C]0.00518577867015809[/C][C]0.99740711066492[/C][/ROW]
[ROW][C]29[/C][C]0.00330605803836625[/C][C]0.0066121160767325[/C][C]0.996693941961634[/C][/ROW]
[ROW][C]30[/C][C]0.00601751180646352[/C][C]0.0120350236129270[/C][C]0.993982488193536[/C][/ROW]
[ROW][C]31[/C][C]0.0073877431374079[/C][C]0.0147754862748158[/C][C]0.992612256862592[/C][/ROW]
[ROW][C]32[/C][C]0.0121852841527193[/C][C]0.0243705683054387[/C][C]0.98781471584728[/C][/ROW]
[ROW][C]33[/C][C]0.0224971807731173[/C][C]0.0449943615462346[/C][C]0.977502819226883[/C][/ROW]
[ROW][C]34[/C][C]0.0366012125292148[/C][C]0.0732024250584297[/C][C]0.963398787470785[/C][/ROW]
[ROW][C]35[/C][C]0.0791233859674695[/C][C]0.158246771934939[/C][C]0.920876614032531[/C][/ROW]
[ROW][C]36[/C][C]0.123981984509606[/C][C]0.247963969019212[/C][C]0.876018015490394[/C][/ROW]
[ROW][C]37[/C][C]0.299935288495015[/C][C]0.599870576990029[/C][C]0.700064711504985[/C][/ROW]
[ROW][C]38[/C][C]0.300549627532119[/C][C]0.601099255064239[/C][C]0.69945037246788[/C][/ROW]
[ROW][C]39[/C][C]0.32404356165413[/C][C]0.64808712330826[/C][C]0.67595643834587[/C][/ROW]
[ROW][C]40[/C][C]0.378138492019630[/C][C]0.756276984039261[/C][C]0.62186150798037[/C][/ROW]
[ROW][C]41[/C][C]0.353140796551303[/C][C]0.706281593102607[/C][C]0.646859203448697[/C][/ROW]
[ROW][C]42[/C][C]0.307075125325760[/C][C]0.614150250651519[/C][C]0.69292487467424[/C][/ROW]
[ROW][C]43[/C][C]0.227197138725532[/C][C]0.454394277451064[/C][C]0.772802861274468[/C][/ROW]
[ROW][C]44[/C][C]0.288874998922052[/C][C]0.577749997844103[/C][C]0.711125001077948[/C][/ROW]
[/TABLE]
Source: https://freestatistics.org/blog/index.php?pk=30177&T=5

Globally Unique Identifier (entire table): ba.freestatistics.org/blog/index.php?pk=30177&T=5

As an alternative you can also use a QR Code:  

The GUIDs for individual cells are displayed in the table below:

Goldfeld-Quandt test for Heteroskedasticity
p-valuesAlternative Hypothesis
breakpoint indexgreater2-sidedless
160.01025143554386970.02050287108773930.98974856445613
170.003598986371360230.007197972742720460.99640101362864
180.001844379282155070.003688758564310140.998155620717845
190.009562862405398760.01912572481079750.990437137594601
200.01034943626012850.02069887252025690.989650563739872
210.01026228303640590.02052456607281190.989737716963594
220.008281998503150720.01656399700630140.99171800149685
230.005203114305867140.01040622861173430.994796885694133
240.002716354440345410.005432708880690810.997283645559655
250.001672982825292420.003345965650584840.998327017174708
260.002344946627645470.004689893255290940.997655053372354
270.002925554011442310.005851108022884630.997074445988558
280.002592889335079040.005185778670158090.99740711066492
290.003306058038366250.00661211607673250.996693941961634
300.006017511806463520.01203502361292700.993982488193536
310.00738774313740790.01477548627481580.992612256862592
320.01218528415271930.02437056830543870.98781471584728
330.02249718077311730.04499436154623460.977502819226883
340.03660121252921480.07320242505842970.963398787470785
350.07912338596746950.1582467719349390.920876614032531
360.1239819845096060.2479639690192120.876018015490394
370.2999352884950150.5998705769900290.700064711504985
380.3005496275321190.6010992550642390.69945037246788
390.324043561654130.648087123308260.67595643834587
400.3781384920196300.7562769840392610.62186150798037
410.3531407965513030.7062815931026070.646859203448697
420.3070751253257600.6141502506515190.69292487467424
430.2271971387255320.4543942774510640.772802861274468
440.2888749989220520.5777499978441030.711125001077948


Meta Analysis of Goldfeld-Quandt test for Heteroskedasticity
Description# significant tests% significant testsOK/NOK
1% type I error level80.275862068965517NOK
5% type I error level180.620689655172414NOK
10% type I error level190.655172413793103NOK

\begin{tabular}{lllllllll}
\hline
Meta Analysis of Goldfeld-Quandt test for Heteroskedasticity \tabularnewline
Description & # significant tests & % significant tests & OK/NOK \tabularnewline
1% type I error level & 8 & 0.275862068965517 & NOK \tabularnewline
5% type I error level & 18 & 0.620689655172414 & NOK \tabularnewline
10% type I error level & 19 & 0.655172413793103 & NOK \tabularnewline
\hline
\end{tabular}
%Source: https://freestatistics.org/blog/index.php?pk=30177&T=6

[TABLE]
[ROW][C]Meta Analysis of Goldfeld-Quandt test for Heteroskedasticity[/C][/ROW]
[ROW][C]Description[/C][C]# significant tests[/C][C]% significant tests[/C][C]OK/NOK[/C][/ROW]
[ROW][C]1% type I error level[/C][C]8[/C][C]0.275862068965517[/C][C]NOK[/C][/ROW]
[ROW][C]5% type I error level[/C][C]18[/C][C]0.620689655172414[/C][C]NOK[/C][/ROW]
[ROW][C]10% type I error level[/C][C]19[/C][C]0.655172413793103[/C][C]NOK[/C][/ROW]
[/TABLE]
Source: https://freestatistics.org/blog/index.php?pk=30177&T=6

Globally Unique Identifier (entire table): ba.freestatistics.org/blog/index.php?pk=30177&T=6

As an alternative you can also use a QR Code:  

The GUIDs for individual cells are displayed in the table below:

Meta Analysis of Goldfeld-Quandt test for Heteroskedasticity
Description# significant tests% significant testsOK/NOK
1% type I error level80.275862068965517NOK
5% type I error level180.620689655172414NOK
10% type I error level190.655172413793103NOK


Parameters (Session):
par1 = 1 ; par2 = Include Monthly Dummies ; par3 = No Linear Trend ;
Parameters (R input):
par1 = 1 ; par2 = Include Monthly Dummies ; par3 = No Linear Trend ;
R code (references can be found in the software module):
library(lattice)
library(lmtest)
n25 <- 25 #minimum number of obs. for Goldfeld-Quandt test
par1 <- as.numeric(par1)
x <- t(y)
k <- length(x[1,])
n <- length(x[,1])
x1 <- cbind(x[,par1], x[,1:k!=par1])
mycolnames <- c(colnames(x)[par1], colnames(x)[1:k!=par1])
colnames(x1) <- mycolnames #colnames(x)[par1]
x <- x1
if (par3 == 'First Differences'){
x2 <- array(0, dim=c(n-1,k), dimnames=list(1:(n-1), paste('(1-B)',colnames(x),sep='')))
for (i in 1:n-1) {
for (j in 1:k) {
x2[i,j] <- x[i+1,j] - x[i,j]
}
}
x <- x2
}
if (par2 == 'Include Monthly Dummies'){
x2 <- array(0, dim=c(n,11), dimnames=list(1:n, paste('M', seq(1:11), sep ='')))
for (i in 1:11){
x2[seq(i,n,12),i] <- 1
}
x <- cbind(x, x2)
}
if (par2 == 'Include Quarterly Dummies'){
x2 <- array(0, dim=c(n,3), dimnames=list(1:n, paste('Q', seq(1:3), sep ='')))
for (i in 1:3){
x2[seq(i,n,4),i] <- 1
}
x <- cbind(x, x2)
}
k <- length(x[1,])
if (par3 == 'Linear Trend'){
x <- cbind(x, c(1:n))
colnames(x)[k+1] <- 't'
}
x
k <- length(x[1,])
df <- as.data.frame(x)
(mylm <- lm(df))
(mysum <- summary(mylm))
if (n > n25) {
kp3 <- k + 3
nmkm3 <- n - k - 3
gqarr <- array(NA, dim=c(nmkm3-kp3+1,3))
numgqtests <- 0
numsignificant1 <- 0
numsignificant5 <- 0
numsignificant10 <- 0
for (mypoint in kp3:nmkm3) {
j <- 0
numgqtests <- numgqtests + 1
for (myalt in c('greater', 'two.sided', 'less')) {
j <- j + 1
gqarr[mypoint-kp3+1,j] <- gqtest(mylm, point=mypoint, alternative=myalt)$p.value
}
if (gqarr[mypoint-kp3+1,2] < 0.01) numsignificant1 <- numsignificant1 + 1
if (gqarr[mypoint-kp3+1,2] < 0.05) numsignificant5 <- numsignificant5 + 1
if (gqarr[mypoint-kp3+1,2] < 0.10) numsignificant10 <- numsignificant10 + 1
}
gqarr
}
bitmap(file='test0.png')
plot(x[,1], type='l', main='Actuals and Interpolation', ylab='value of Actuals and Interpolation (dots)', xlab='time or index')
points(x[,1]-mysum$resid)
grid()
dev.off()
bitmap(file='test1.png')
plot(mysum$resid, type='b', pch=19, main='Residuals', ylab='value of Residuals', xlab='time or index')
grid()
dev.off()
bitmap(file='test2.png')
hist(mysum$resid, main='Residual Histogram', xlab='values of Residuals')
grid()
dev.off()
bitmap(file='test3.png')
densityplot(~mysum$resid,col='black',main='Residual Density Plot', xlab='values of Residuals')
dev.off()
bitmap(file='test4.png')
qqnorm(mysum$resid, main='Residual Normal Q-Q Plot')
qqline(mysum$resid)
grid()
dev.off()
(myerror <- as.ts(mysum$resid))
bitmap(file='test5.png')
dum <- cbind(lag(myerror,k=1),myerror)
dum
dum1 <- dum[2:length(myerror),]
dum1
z <- as.data.frame(dum1)
z
plot(z,main=paste('Residual Lag plot, lowess, and regression line'), ylab='values of Residuals', xlab='lagged values of Residuals')
lines(lowess(z))
abline(lm(z))
grid()
dev.off()
bitmap(file='test6.png')
acf(mysum$resid, lag.max=length(mysum$resid)/2, main='Residual Autocorrelation Function')
grid()
dev.off()
bitmap(file='test7.png')
pacf(mysum$resid, lag.max=length(mysum$resid)/2, main='Residual Partial Autocorrelation Function')
grid()
dev.off()
bitmap(file='test8.png')
opar <- par(mfrow = c(2,2), oma = c(0, 0, 1.1, 0))
plot(mylm, las = 1, sub='Residual Diagnostics')
par(opar)
dev.off()
if (n > n25) {
bitmap(file='test9.png')
plot(kp3:nmkm3,gqarr[,2], main='Goldfeld-Quandt test',ylab='2-sided p-value',xlab='breakpoint')
grid()
dev.off()
}
load(file='createtable')
a<-table.start()
a<-table.row.start(a)
a<-table.element(a, 'Multiple Linear Regression - Estimated Regression Equation', 1, TRUE)
a<-table.row.end(a)
myeq <- colnames(x)[1]
myeq <- paste(myeq, '[t] = ', sep='')
for (i in 1:k){
if (mysum$coefficients[i,1] > 0) myeq <- paste(myeq, '+', '')
myeq <- paste(myeq, mysum$coefficients[i,1], sep=' ')
if (rownames(mysum$coefficients)[i] != '(Intercept)') {
myeq <- paste(myeq, rownames(mysum$coefficients)[i], sep='')
if (rownames(mysum$coefficients)[i] != 't') myeq <- paste(myeq, '[t]', sep='')
}
}
myeq <- paste(myeq, ' + e[t]')
a<-table.row.start(a)
a<-table.element(a, myeq)
a<-table.row.end(a)
a<-table.end(a)
table.save(a,file='mytable1.tab')
a<-table.start()
a<-table.row.start(a)
a<-table.element(a,hyperlink('ols1.htm','Multiple Linear Regression - Ordinary Least Squares',''), 6, TRUE)
a<-table.row.end(a)
a<-table.row.start(a)
a<-table.element(a,'Variable',header=TRUE)
a<-table.element(a,'Parameter',header=TRUE)
a<-table.element(a,'S.D.',header=TRUE)
a<-table.element(a,'T-STAT
H0: parameter = 0',header=TRUE)
a<-table.element(a,'2-tail p-value',header=TRUE)
a<-table.element(a,'1-tail p-value',header=TRUE)
a<-table.row.end(a)
for (i in 1:k){
a<-table.row.start(a)
a<-table.element(a,rownames(mysum$coefficients)[i],header=TRUE)
a<-table.element(a,mysum$coefficients[i,1])
a<-table.element(a, round(mysum$coefficients[i,2],6))
a<-table.element(a, round(mysum$coefficients[i,3],4))
a<-table.element(a, round(mysum$coefficients[i,4],6))
a<-table.element(a, round(mysum$coefficients[i,4]/2,6))
a<-table.row.end(a)
}
a<-table.end(a)
table.save(a,file='mytable2.tab')
a<-table.start()
a<-table.row.start(a)
a<-table.element(a, 'Multiple Linear Regression - Regression Statistics', 2, TRUE)
a<-table.row.end(a)
a<-table.row.start(a)
a<-table.element(a, 'Multiple R',1,TRUE)
a<-table.element(a, sqrt(mysum$r.squared))
a<-table.row.end(a)
a<-table.row.start(a)
a<-table.element(a, 'R-squared',1,TRUE)
a<-table.element(a, mysum$r.squared)
a<-table.row.end(a)
a<-table.row.start(a)
a<-table.element(a, 'Adjusted R-squared',1,TRUE)
a<-table.element(a, mysum$adj.r.squared)
a<-table.row.end(a)
a<-table.row.start(a)
a<-table.element(a, 'F-TEST (value)',1,TRUE)
a<-table.element(a, mysum$fstatistic[1])
a<-table.row.end(a)
a<-table.row.start(a)
a<-table.element(a, 'F-TEST (DF numerator)',1,TRUE)
a<-table.element(a, mysum$fstatistic[2])
a<-table.row.end(a)
a<-table.row.start(a)
a<-table.element(a, 'F-TEST (DF denominator)',1,TRUE)
a<-table.element(a, mysum$fstatistic[3])
a<-table.row.end(a)
a<-table.row.start(a)
a<-table.element(a, 'p-value',1,TRUE)
a<-table.element(a, 1-pf(mysum$fstatistic[1],mysum$fstatistic[2],mysum$fstatistic[3]))
a<-table.row.end(a)
a<-table.row.start(a)
a<-table.element(a, 'Multiple Linear Regression - Residual Statistics', 2, TRUE)
a<-table.row.end(a)
a<-table.row.start(a)
a<-table.element(a, 'Residual Standard Deviation',1,TRUE)
a<-table.element(a, mysum$sigma)
a<-table.row.end(a)
a<-table.row.start(a)
a<-table.element(a, 'Sum Squared Residuals',1,TRUE)
a<-table.element(a, sum(myerror*myerror))
a<-table.row.end(a)
a<-table.end(a)
table.save(a,file='mytable3.tab')
a<-table.start()
a<-table.row.start(a)
a<-table.element(a, 'Multiple Linear Regression - Actuals, Interpolation, and Residuals', 4, TRUE)
a<-table.row.end(a)
a<-table.row.start(a)
a<-table.element(a, 'Time or Index', 1, TRUE)
a<-table.element(a, 'Actuals', 1, TRUE)
a<-table.element(a, 'Interpolation
Forecast', 1, TRUE)
a<-table.element(a, 'Residuals
Prediction Error', 1, TRUE)
a<-table.row.end(a)
for (i in 1:n) {
a<-table.row.start(a)
a<-table.element(a,i, 1, TRUE)
a<-table.element(a,x[i])
a<-table.element(a,x[i]-mysum$resid[i])
a<-table.element(a,mysum$resid[i])
a<-table.row.end(a)
}
a<-table.end(a)
table.save(a,file='mytable4.tab')
if (n > n25) {
a<-table.start()
a<-table.row.start(a)
a<-table.element(a,'Goldfeld-Quandt test for Heteroskedasticity',4,TRUE)
a<-table.row.end(a)
a<-table.row.start(a)
a<-table.element(a,'p-values',header=TRUE)
a<-table.element(a,'Alternative Hypothesis',3,header=TRUE)
a<-table.row.end(a)
a<-table.row.start(a)
a<-table.element(a,'breakpoint index',header=TRUE)
a<-table.element(a,'greater',header=TRUE)
a<-table.element(a,'2-sided',header=TRUE)
a<-table.element(a,'less',header=TRUE)
a<-table.row.end(a)
for (mypoint in kp3:nmkm3) {
a<-table.row.start(a)
a<-table.element(a,mypoint,header=TRUE)
a<-table.element(a,gqarr[mypoint-kp3+1,1])
a<-table.element(a,gqarr[mypoint-kp3+1,2])
a<-table.element(a,gqarr[mypoint-kp3+1,3])
a<-table.row.end(a)
}
a<-table.end(a)
table.save(a,file='mytable5.tab')
a<-table.start()
a<-table.row.start(a)
a<-table.element(a,'Meta Analysis of Goldfeld-Quandt test for Heteroskedasticity',4,TRUE)
a<-table.row.end(a)
a<-table.row.start(a)
a<-table.element(a,'Description',header=TRUE)
a<-table.element(a,'# significant tests',header=TRUE)
a<-table.element(a,'% significant tests',header=TRUE)
a<-table.element(a,'OK/NOK',header=TRUE)
a<-table.row.end(a)
a<-table.row.start(a)
a<-table.element(a,'1% type I error level',header=TRUE)
a<-table.element(a,numsignificant1)
a<-table.element(a,numsignificant1/numgqtests)
if (numsignificant1/numgqtests < 0.01) dum <- 'OK' else dum <- 'NOK'
a<-table.element(a,dum)
a<-table.row.end(a)
a<-table.row.start(a)
a<-table.element(a,'5% type I error level',header=TRUE)
a<-table.element(a,numsignificant5)
a<-table.element(a,numsignificant5/numgqtests)
if (numsignificant5/numgqtests < 0.05) dum <- 'OK' else dum <- 'NOK'
a<-table.element(a,dum)
a<-table.row.end(a)
a<-table.row.start(a)
a<-table.element(a,'10% type I error level',header=TRUE)
a<-table.element(a,numsignificant10)
a<-table.element(a,numsignificant10/numgqtests)
if (numsignificant10/numgqtests < 0.1) dum <- 'OK' else dum <- 'NOK'
a<-table.element(a,dum)
a<-table.row.end(a)
a<-table.end(a)
table.save(a,file='mytable6.tab')
}