Free Statistics

of Irreproducible Research!

Author's title

Author*The author of this computation has been verified*
R Software Modulerwasp_spectrum.wasp
Title produced by softwareSpectral Analysis
Date of computationSun, 07 Dec 2008 09:35:43 -0700
Cite this page as followsStatistical Computations at FreeStatistics.org, Office for Research Development and Education, URL https://freestatistics.org/blog/index.php?v=date/2008/Dec/07/t1228667855ylfmbbzpw544ul0.htm/, Retrieved Sun, 19 May 2024 11:31:29 +0000
Statistical Computations at FreeStatistics.org, Office for Research Development and Education, URL https://freestatistics.org/blog/index.php?pk=30154, Retrieved Sun, 19 May 2024 11:31:29 +0000
QR Codes:

Original text written by user:
IsPrivate?No (this computation is public)
User-defined keywords
Estimated Impact177
Family? (F = Feedback message, R = changed R code, M = changed R Module, P = changed Parameters, D = changed Data)
-     [Univariate Data Series] [data set] [2008-12-01 19:54:57] [b98453cac15ba1066b407e146608df68]
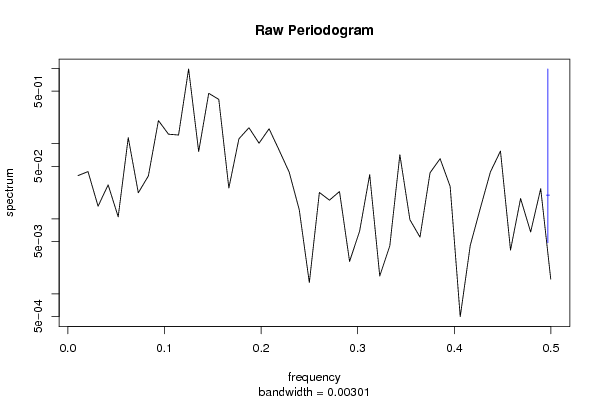
F RMPD    [Spectral Analysis] [workshop8, step3,...] [2008-12-07 16:35:43] [a16dfd7e948381d8b6391003c5d09447] [Current]
Feedback Forum
2008-12-15 19:40:25 [Lana Van Wesemael] [reply
In deze stap moeten we de gevonden differentiaties (d, D step 2 en lamda step 1) toepassen op de tijdreeks. Als de spreiding van het raw periodogram vrij constant blijft, als het niveau gelijk blijft en de uitgesproken seizoenaliteit verdwenen is dan is de tijdreeks stationair. Wanneer het cumultatief periodogram geen steil stijgend verloop (lange termijn trend meer heeft en ook geen trapjes (seizoenaliteit) meer vertoont dan is de tijdreeks stationair. Wanneer het cumulatief periodogram zoals hier links van de diagonaal het 95% betrouwbaarheidsinterval overschrijdt dan wijst dit op een AR proces.
2008-12-15 19:57:55 [Peter Van Doninck] [reply
In het raw periodogram zijn er toch nog enkele schokken waar te nemen. Eveneens ligt het cumulatieve periodogram voor een groot stuk buiten het 95% betrouwbaarheidsinterval. Dit kan te maken hebben doordat de student zowel d en D gelijk gesteld heef aan 1.

Post a new message
Dataseries X:
7.5
7.2
6.9
6.7
6.4
6.3
6.8
7.3
7.1
7.1
6.8
6.5
6.3
6.1
6.1
6.3
6.3
6
6.2
6.4
6.8
7.5
7.5
7.6
7.6
7.4
7.3
7.1
6.9
6.8
7.5
7.6
7.8
8
8.1
8.2
8.3
8.2
8
7.9
7.6
7.6
8.2
8.3
8.4
8.4
8.4
8.6
8.9
8.8
8.3
7.5
7.2
7.5
8.8
9.3
9.3
8.7
8.2
8.3
8.5
8.6
8.6
8.2
8.1
8
8.6
8.7
8.8
8.5
8.4
8.5
8.7
8.7
8.6
8.5
8.3
8.1
8.2
8.1
8.1
7.9
7.9
7.9
8
8
7.9
8
7.7
7.2
7.5
7.3
7
7
7
7.2
7.3
7.1
6.8
6.6
6.2
6.2
6.8
6.9
6.8
6.7


Summary of computational transaction
Raw Inputview raw input (R code)
Raw Outputview raw output of R engine
Computing time1 seconds
R Server'Gwilym Jenkins' @ 72.249.127.135

\begin{tabular}{lllllllll}
\hline
Summary of computational transaction \tabularnewline
Raw Input & view raw input (R code)  \tabularnewline
Raw Output & view raw output of R engine  \tabularnewline
Computing time & 1 seconds \tabularnewline
R Server & 'Gwilym Jenkins' @ 72.249.127.135 \tabularnewline
\hline
\end{tabular}
%Source: https://freestatistics.org/blog/index.php?pk=30154&T=0

[TABLE]
[ROW][C]Summary of computational transaction[/C][/ROW]
[ROW][C]Raw Input[/C][C]view raw input (R code) [/C][/ROW]
[ROW][C]Raw Output[/C][C]view raw output of R engine [/C][/ROW]
[ROW][C]Computing time[/C][C]1 seconds[/C][/ROW]
[ROW][C]R Server[/C][C]'Gwilym Jenkins' @ 72.249.127.135[/C][/ROW]
[/TABLE]
Source: https://freestatistics.org/blog/index.php?pk=30154&T=0

Globally Unique Identifier (entire table): ba.freestatistics.org/blog/index.php?pk=30154&T=0

As an alternative you can also use a QR Code:  

The GUIDs for individual cells are displayed in the table below:

Summary of computational transaction
Raw Inputview raw input (R code)
Raw Outputview raw output of R engine
Computing time1 seconds
R Server'Gwilym Jenkins' @ 72.249.127.135


Raw Periodogram
ParameterValue
Box-Cox transformation parameter (lambda)1
Degree of non-seasonal differencing (d)1
Degree of seasonal differencing (D)1
Seasonal Period (s)12
Frequency (Period)Spectrum
0.0104 (96)0.037527
0.0208 (48)0.042442
0.0312 (32)0.014685
0.0417 (24)0.028279
0.0521 (19.2)0.010615
0.0625 (16)0.120308
0.0729 (13.7143)0.022141
0.0833 (12)0.037181
0.0938 (10.6667)0.202909
0.1042 (9.6)0.13352
0.1146 (8.7273)0.130267
0.125 (8)0.986854
0.1354 (7.3846)0.078329
0.1458 (6.8571)0.468162
0.1562 (6.4)0.387891
0.1667 (6)0.025627
0.1771 (5.6471)0.115853
0.1875 (5.3333)0.162938
0.1979 (5.0526)0.101377
0.2083 (4.8)0.157611
0.2187 (4.5714)0.081695
0.2292 (4.3636)0.041602
0.2396 (4.1739)0.01314
0.25 (4)0.001414
0.2604 (3.84)0.022382
0.2708 (3.6923)0.017677
0.2812 (3.5556)0.023043
0.2917 (3.4286)0.002697
0.3021 (3.3103)0.006857
0.3125 (3.2)0.038643
0.3229 (3.0968)0.00173
0.3333 (3)0.004357
0.3438 (2.9091)0.071237
0.3542 (2.8235)0.009696
0.3646 (2.7429)0.005698
0.375 (2.6667)0.040967
0.3854 (2.5946)0.062989
0.3958 (2.5263)0.026908
0.4062 (2.4615)0.000497
0.4167 (2.4)0.004432
0.4271 (2.3415)0.013816
0.4375 (2.2857)0.041957
0.4479 (2.2326)0.079685
0.4583 (2.1818)0.003824
0.4688 (2.1333)0.018596
0.4792 (2.087)0.006663
0.4896 (2.0426)0.025139
0.5 (2)0.001569

\begin{tabular}{lllllllll}
\hline
Raw Periodogram \tabularnewline
Parameter & Value \tabularnewline
Box-Cox transformation parameter (lambda) & 1 \tabularnewline
Degree of non-seasonal differencing (d) & 1 \tabularnewline
Degree of seasonal differencing (D) & 1 \tabularnewline
Seasonal Period (s) & 12 \tabularnewline
Frequency (Period) & Spectrum \tabularnewline
0.0104 (96) & 0.037527 \tabularnewline
0.0208 (48) & 0.042442 \tabularnewline
0.0312 (32) & 0.014685 \tabularnewline
0.0417 (24) & 0.028279 \tabularnewline
0.0521 (19.2) & 0.010615 \tabularnewline
0.0625 (16) & 0.120308 \tabularnewline
0.0729 (13.7143) & 0.022141 \tabularnewline
0.0833 (12) & 0.037181 \tabularnewline
0.0938 (10.6667) & 0.202909 \tabularnewline
0.1042 (9.6) & 0.13352 \tabularnewline
0.1146 (8.7273) & 0.130267 \tabularnewline
0.125 (8) & 0.986854 \tabularnewline
0.1354 (7.3846) & 0.078329 \tabularnewline
0.1458 (6.8571) & 0.468162 \tabularnewline
0.1562 (6.4) & 0.387891 \tabularnewline
0.1667 (6) & 0.025627 \tabularnewline
0.1771 (5.6471) & 0.115853 \tabularnewline
0.1875 (5.3333) & 0.162938 \tabularnewline
0.1979 (5.0526) & 0.101377 \tabularnewline
0.2083 (4.8) & 0.157611 \tabularnewline
0.2187 (4.5714) & 0.081695 \tabularnewline
0.2292 (4.3636) & 0.041602 \tabularnewline
0.2396 (4.1739) & 0.01314 \tabularnewline
0.25 (4) & 0.001414 \tabularnewline
0.2604 (3.84) & 0.022382 \tabularnewline
0.2708 (3.6923) & 0.017677 \tabularnewline
0.2812 (3.5556) & 0.023043 \tabularnewline
0.2917 (3.4286) & 0.002697 \tabularnewline
0.3021 (3.3103) & 0.006857 \tabularnewline
0.3125 (3.2) & 0.038643 \tabularnewline
0.3229 (3.0968) & 0.00173 \tabularnewline
0.3333 (3) & 0.004357 \tabularnewline
0.3438 (2.9091) & 0.071237 \tabularnewline
0.3542 (2.8235) & 0.009696 \tabularnewline
0.3646 (2.7429) & 0.005698 \tabularnewline
0.375 (2.6667) & 0.040967 \tabularnewline
0.3854 (2.5946) & 0.062989 \tabularnewline
0.3958 (2.5263) & 0.026908 \tabularnewline
0.4062 (2.4615) & 0.000497 \tabularnewline
0.4167 (2.4) & 0.004432 \tabularnewline
0.4271 (2.3415) & 0.013816 \tabularnewline
0.4375 (2.2857) & 0.041957 \tabularnewline
0.4479 (2.2326) & 0.079685 \tabularnewline
0.4583 (2.1818) & 0.003824 \tabularnewline
0.4688 (2.1333) & 0.018596 \tabularnewline
0.4792 (2.087) & 0.006663 \tabularnewline
0.4896 (2.0426) & 0.025139 \tabularnewline
0.5 (2) & 0.001569 \tabularnewline
\hline
\end{tabular}
%Source: https://freestatistics.org/blog/index.php?pk=30154&T=1

[TABLE]
[ROW][C]Raw Periodogram[/C][/ROW]
[ROW][C]Parameter[/C][C]Value[/C][/ROW]
[ROW][C]Box-Cox transformation parameter (lambda)[/C][C]1[/C][/ROW]
[ROW][C]Degree of non-seasonal differencing (d)[/C][C]1[/C][/ROW]
[ROW][C]Degree of seasonal differencing (D)[/C][C]1[/C][/ROW]
[ROW][C]Seasonal Period (s)[/C][C]12[/C][/ROW]
[ROW][C]Frequency (Period)[/C][C]Spectrum[/C][/ROW]
[ROW][C]0.0104 (96)[/C][C]0.037527[/C][/ROW]
[ROW][C]0.0208 (48)[/C][C]0.042442[/C][/ROW]
[ROW][C]0.0312 (32)[/C][C]0.014685[/C][/ROW]
[ROW][C]0.0417 (24)[/C][C]0.028279[/C][/ROW]
[ROW][C]0.0521 (19.2)[/C][C]0.010615[/C][/ROW]
[ROW][C]0.0625 (16)[/C][C]0.120308[/C][/ROW]
[ROW][C]0.0729 (13.7143)[/C][C]0.022141[/C][/ROW]
[ROW][C]0.0833 (12)[/C][C]0.037181[/C][/ROW]
[ROW][C]0.0938 (10.6667)[/C][C]0.202909[/C][/ROW]
[ROW][C]0.1042 (9.6)[/C][C]0.13352[/C][/ROW]
[ROW][C]0.1146 (8.7273)[/C][C]0.130267[/C][/ROW]
[ROW][C]0.125 (8)[/C][C]0.986854[/C][/ROW]
[ROW][C]0.1354 (7.3846)[/C][C]0.078329[/C][/ROW]
[ROW][C]0.1458 (6.8571)[/C][C]0.468162[/C][/ROW]
[ROW][C]0.1562 (6.4)[/C][C]0.387891[/C][/ROW]
[ROW][C]0.1667 (6)[/C][C]0.025627[/C][/ROW]
[ROW][C]0.1771 (5.6471)[/C][C]0.115853[/C][/ROW]
[ROW][C]0.1875 (5.3333)[/C][C]0.162938[/C][/ROW]
[ROW][C]0.1979 (5.0526)[/C][C]0.101377[/C][/ROW]
[ROW][C]0.2083 (4.8)[/C][C]0.157611[/C][/ROW]
[ROW][C]0.2187 (4.5714)[/C][C]0.081695[/C][/ROW]
[ROW][C]0.2292 (4.3636)[/C][C]0.041602[/C][/ROW]
[ROW][C]0.2396 (4.1739)[/C][C]0.01314[/C][/ROW]
[ROW][C]0.25 (4)[/C][C]0.001414[/C][/ROW]
[ROW][C]0.2604 (3.84)[/C][C]0.022382[/C][/ROW]
[ROW][C]0.2708 (3.6923)[/C][C]0.017677[/C][/ROW]
[ROW][C]0.2812 (3.5556)[/C][C]0.023043[/C][/ROW]
[ROW][C]0.2917 (3.4286)[/C][C]0.002697[/C][/ROW]
[ROW][C]0.3021 (3.3103)[/C][C]0.006857[/C][/ROW]
[ROW][C]0.3125 (3.2)[/C][C]0.038643[/C][/ROW]
[ROW][C]0.3229 (3.0968)[/C][C]0.00173[/C][/ROW]
[ROW][C]0.3333 (3)[/C][C]0.004357[/C][/ROW]
[ROW][C]0.3438 (2.9091)[/C][C]0.071237[/C][/ROW]
[ROW][C]0.3542 (2.8235)[/C][C]0.009696[/C][/ROW]
[ROW][C]0.3646 (2.7429)[/C][C]0.005698[/C][/ROW]
[ROW][C]0.375 (2.6667)[/C][C]0.040967[/C][/ROW]
[ROW][C]0.3854 (2.5946)[/C][C]0.062989[/C][/ROW]
[ROW][C]0.3958 (2.5263)[/C][C]0.026908[/C][/ROW]
[ROW][C]0.4062 (2.4615)[/C][C]0.000497[/C][/ROW]
[ROW][C]0.4167 (2.4)[/C][C]0.004432[/C][/ROW]
[ROW][C]0.4271 (2.3415)[/C][C]0.013816[/C][/ROW]
[ROW][C]0.4375 (2.2857)[/C][C]0.041957[/C][/ROW]
[ROW][C]0.4479 (2.2326)[/C][C]0.079685[/C][/ROW]
[ROW][C]0.4583 (2.1818)[/C][C]0.003824[/C][/ROW]
[ROW][C]0.4688 (2.1333)[/C][C]0.018596[/C][/ROW]
[ROW][C]0.4792 (2.087)[/C][C]0.006663[/C][/ROW]
[ROW][C]0.4896 (2.0426)[/C][C]0.025139[/C][/ROW]
[ROW][C]0.5 (2)[/C][C]0.001569[/C][/ROW]
[/TABLE]
Source: https://freestatistics.org/blog/index.php?pk=30154&T=1

Globally Unique Identifier (entire table): ba.freestatistics.org/blog/index.php?pk=30154&T=1

As an alternative you can also use a QR Code:  

The GUIDs for individual cells are displayed in the table below:

Raw Periodogram
ParameterValue
Box-Cox transformation parameter (lambda)1
Degree of non-seasonal differencing (d)1
Degree of seasonal differencing (D)1
Seasonal Period (s)12
Frequency (Period)Spectrum
0.0104 (96)0.037527
0.0208 (48)0.042442
0.0312 (32)0.014685
0.0417 (24)0.028279
0.0521 (19.2)0.010615
0.0625 (16)0.120308
0.0729 (13.7143)0.022141
0.0833 (12)0.037181
0.0938 (10.6667)0.202909
0.1042 (9.6)0.13352
0.1146 (8.7273)0.130267
0.125 (8)0.986854
0.1354 (7.3846)0.078329
0.1458 (6.8571)0.468162
0.1562 (6.4)0.387891
0.1667 (6)0.025627
0.1771 (5.6471)0.115853
0.1875 (5.3333)0.162938
0.1979 (5.0526)0.101377
0.2083 (4.8)0.157611
0.2187 (4.5714)0.081695
0.2292 (4.3636)0.041602
0.2396 (4.1739)0.01314
0.25 (4)0.001414
0.2604 (3.84)0.022382
0.2708 (3.6923)0.017677
0.2812 (3.5556)0.023043
0.2917 (3.4286)0.002697
0.3021 (3.3103)0.006857
0.3125 (3.2)0.038643
0.3229 (3.0968)0.00173
0.3333 (3)0.004357
0.3438 (2.9091)0.071237
0.3542 (2.8235)0.009696
0.3646 (2.7429)0.005698
0.375 (2.6667)0.040967
0.3854 (2.5946)0.062989
0.3958 (2.5263)0.026908
0.4062 (2.4615)0.000497
0.4167 (2.4)0.004432
0.4271 (2.3415)0.013816
0.4375 (2.2857)0.041957
0.4479 (2.2326)0.079685
0.4583 (2.1818)0.003824
0.4688 (2.1333)0.018596
0.4792 (2.087)0.006663
0.4896 (2.0426)0.025139
0.5 (2)0.001569


Parameters (Session):
par1 = 60 ; par2 = 1 ; par3 = 1 ; par4 = 0 ; par5 = 12 ;
Parameters (R input):
par1 = 1 ; par2 = 1 ; par3 = 1 ; par4 = 12 ;
R code (references can be found in the software module):
par1 <- as.numeric(par1)
par2 <- as.numeric(par2)
par3 <- as.numeric(par3)
par4 <- as.numeric(par4)
if (par1 == 0) {
x <- log(x)
} else {
x <- (x ^ par1 - 1) / par1
}
if (par2 > 0) x <- diff(x,lag=1,difference=par2)
if (par3 > 0) x <- diff(x,lag=par4,difference=par3)
bitmap(file='test1.png')
r <- spectrum(x,main='Raw Periodogram')
dev.off()
bitmap(file='test2.png')
cpgram(x,main='Cumulative Periodogram')
dev.off()
load(file='createtable')
a<-table.start()
a<-table.row.start(a)
a<-table.element(a,'Raw Periodogram',2,TRUE)
a<-table.row.end(a)
a<-table.row.start(a)
a<-table.element(a,'Parameter',header=TRUE)
a<-table.element(a,'Value',header=TRUE)
a<-table.row.end(a)
a<-table.row.start(a)
a<-table.element(a,'Box-Cox transformation parameter (lambda)',header=TRUE)
a<-table.element(a,par1)
a<-table.row.end(a)
a<-table.row.start(a)
a<-table.element(a,'Degree of non-seasonal differencing (d)',header=TRUE)
a<-table.element(a,par2)
a<-table.row.end(a)
a<-table.row.start(a)
a<-table.element(a,'Degree of seasonal differencing (D)',header=TRUE)
a<-table.element(a,par3)
a<-table.row.end(a)
a<-table.row.start(a)
a<-table.element(a,'Seasonal Period (s)',header=TRUE)
a<-table.element(a,par4)
a<-table.row.end(a)
a<-table.row.start(a)
a<-table.element(a,'Frequency (Period)',header=TRUE)
a<-table.element(a,'Spectrum',header=TRUE)
a<-table.row.end(a)
for (i in 1:length(r$freq)) {
a<-table.row.start(a)
mylab <- round(r$freq[i],4)
mylab <- paste(mylab,' (',sep='')
mylab <- paste(mylab,round(1/r$freq[i],4),sep='')
mylab <- paste(mylab,')',sep='')
a<-table.element(a,mylab,header=TRUE)
a<-table.element(a,round(r$spec[i],6))
a<-table.row.end(a)
}
a<-table.end(a)
table.save(a,file='mytable.tab')