Free Statistics

of Irreproducible Research!

Author's title

Author*The author of this computation has been verified*
R Software Modulerwasp_autocorrelation.wasp
Title produced by software(Partial) Autocorrelation Function
Date of computationSun, 07 Dec 2008 09:31:47 -0700
Cite this page as followsStatistical Computations at FreeStatistics.org, Office for Research Development and Education, URL https://freestatistics.org/blog/index.php?v=date/2008/Dec/07/t12286675443nkt3zeu3a27o1c.htm/, Retrieved Sun, 19 May 2024 09:19:04 +0000
Statistical Computations at FreeStatistics.org, Office for Research Development and Education, URL https://freestatistics.org/blog/index.php?pk=30149, Retrieved Sun, 19 May 2024 09:19:04 +0000
QR Codes:

Original text written by user:
IsPrivate?No (this computation is public)
User-defined keywords
Estimated Impact169
Family? (F = Feedback message, R = changed R code, M = changed R Module, P = changed Parameters, D = changed Data)
-     [(Partial) Autocorrelation Function] [Paper: autocorrel...] [2008-12-07 16:29:33] [57850c80fd59ccfb28f882be994e814e]
-   P     [(Partial) Autocorrelation Function] [Paper: autocorrel...] [2008-12-07 16:31:47] [0831954c833179c36e9320daee0825b5] [Current]
-   P       [(Partial) Autocorrelation Function] [Paper: autocorrel...] [2008-12-07 16:35:18] [57850c80fd59ccfb28f882be994e814e]
Feedback Forum

Post a new message
Dataseries X:
15107
15024
12083
15761
16943
15070
13660
14769
14725
15998
15371
14957
15470
15102
11704
16284
16727
14969
14861
14583
15306
17904
16379
15420
17871
15913
13867
17823
17872
17422
16705
15991
16584
19124
17839
17209
18587
16258
15142
19202
17747
19090
18040
17516
17752
21073
17170
19440
19795
17575
16165
19465
19932
19961
17343
18924
18574
21351
18595
19823
20844
19640
17735
19814
22239
20682
17819
21872
22117
21866


Summary of computational transaction
Raw Inputview raw input (R code)
Raw Outputview raw output of R engine
Computing time1 seconds
R Server'Gwilym Jenkins' @ 72.249.127.135

\begin{tabular}{lllllllll}
\hline
Summary of computational transaction \tabularnewline
Raw Input & view raw input (R code)  \tabularnewline
Raw Output & view raw output of R engine  \tabularnewline
Computing time & 1 seconds \tabularnewline
R Server & 'Gwilym Jenkins' @ 72.249.127.135 \tabularnewline
\hline
\end{tabular}
%Source: https://freestatistics.org/blog/index.php?pk=30149&T=0

[TABLE]
[ROW][C]Summary of computational transaction[/C][/ROW]
[ROW][C]Raw Input[/C][C]view raw input (R code) [/C][/ROW]
[ROW][C]Raw Output[/C][C]view raw output of R engine [/C][/ROW]
[ROW][C]Computing time[/C][C]1 seconds[/C][/ROW]
[ROW][C]R Server[/C][C]'Gwilym Jenkins' @ 72.249.127.135[/C][/ROW]
[/TABLE]
Source: https://freestatistics.org/blog/index.php?pk=30149&T=0

Globally Unique Identifier (entire table): ba.freestatistics.org/blog/index.php?pk=30149&T=0

As an alternative you can also use a QR Code:  

The GUIDs for individual cells are displayed in the table below:

Summary of computational transaction
Raw Inputview raw input (R code)
Raw Outputview raw output of R engine
Computing time1 seconds
R Server'Gwilym Jenkins' @ 72.249.127.135


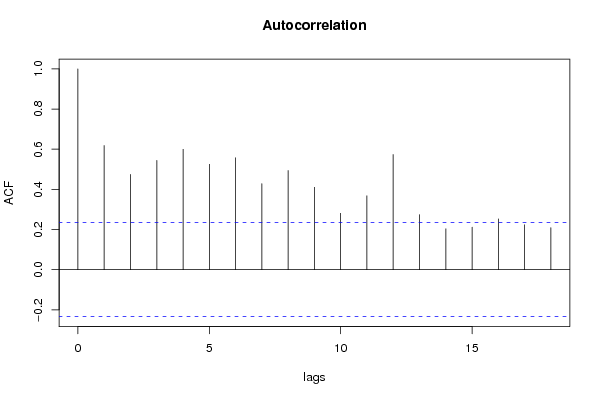
Autocorrelation Function
Time lag kACF(k)T-STATP-value
10.6182165.17241e-06
20.4742183.96768.7e-05
30.5441364.55261.1e-05
40.5995195.01592e-06
50.5248044.39082e-05
60.5574714.66417e-06
70.4285353.58540.000309
80.4936864.13054.9e-05
90.4099713.43010.000508
100.2805742.34750.010868
110.3681583.08020.001478
120.5732384.79614e-06
130.2737342.29020.012513
140.2032941.70090.046702
150.2117411.77160.040411
160.2525122.11270.019099
170.2231811.86730.033026
180.209111.74950.04229

\begin{tabular}{lllllllll}
\hline
Autocorrelation Function \tabularnewline
Time lag k & ACF(k) & T-STAT & P-value \tabularnewline
1 & 0.618216 & 5.1724 & 1e-06 \tabularnewline
2 & 0.474218 & 3.9676 & 8.7e-05 \tabularnewline
3 & 0.544136 & 4.5526 & 1.1e-05 \tabularnewline
4 & 0.599519 & 5.0159 & 2e-06 \tabularnewline
5 & 0.524804 & 4.3908 & 2e-05 \tabularnewline
6 & 0.557471 & 4.6641 & 7e-06 \tabularnewline
7 & 0.428535 & 3.5854 & 0.000309 \tabularnewline
8 & 0.493686 & 4.1305 & 4.9e-05 \tabularnewline
9 & 0.409971 & 3.4301 & 0.000508 \tabularnewline
10 & 0.280574 & 2.3475 & 0.010868 \tabularnewline
11 & 0.368158 & 3.0802 & 0.001478 \tabularnewline
12 & 0.573238 & 4.7961 & 4e-06 \tabularnewline
13 & 0.273734 & 2.2902 & 0.012513 \tabularnewline
14 & 0.203294 & 1.7009 & 0.046702 \tabularnewline
15 & 0.211741 & 1.7716 & 0.040411 \tabularnewline
16 & 0.252512 & 2.1127 & 0.019099 \tabularnewline
17 & 0.223181 & 1.8673 & 0.033026 \tabularnewline
18 & 0.20911 & 1.7495 & 0.04229 \tabularnewline
\hline
\end{tabular}
%Source: https://freestatistics.org/blog/index.php?pk=30149&T=1

[TABLE]
[ROW][C]Autocorrelation Function[/C][/ROW]
[ROW][C]Time lag k[/C][C]ACF(k)[/C][C]T-STAT[/C][C]P-value[/C][/ROW]
[ROW][C]1[/C][C]0.618216[/C][C]5.1724[/C][C]1e-06[/C][/ROW]
[ROW][C]2[/C][C]0.474218[/C][C]3.9676[/C][C]8.7e-05[/C][/ROW]
[ROW][C]3[/C][C]0.544136[/C][C]4.5526[/C][C]1.1e-05[/C][/ROW]
[ROW][C]4[/C][C]0.599519[/C][C]5.0159[/C][C]2e-06[/C][/ROW]
[ROW][C]5[/C][C]0.524804[/C][C]4.3908[/C][C]2e-05[/C][/ROW]
[ROW][C]6[/C][C]0.557471[/C][C]4.6641[/C][C]7e-06[/C][/ROW]
[ROW][C]7[/C][C]0.428535[/C][C]3.5854[/C][C]0.000309[/C][/ROW]
[ROW][C]8[/C][C]0.493686[/C][C]4.1305[/C][C]4.9e-05[/C][/ROW]
[ROW][C]9[/C][C]0.409971[/C][C]3.4301[/C][C]0.000508[/C][/ROW]
[ROW][C]10[/C][C]0.280574[/C][C]2.3475[/C][C]0.010868[/C][/ROW]
[ROW][C]11[/C][C]0.368158[/C][C]3.0802[/C][C]0.001478[/C][/ROW]
[ROW][C]12[/C][C]0.573238[/C][C]4.7961[/C][C]4e-06[/C][/ROW]
[ROW][C]13[/C][C]0.273734[/C][C]2.2902[/C][C]0.012513[/C][/ROW]
[ROW][C]14[/C][C]0.203294[/C][C]1.7009[/C][C]0.046702[/C][/ROW]
[ROW][C]15[/C][C]0.211741[/C][C]1.7716[/C][C]0.040411[/C][/ROW]
[ROW][C]16[/C][C]0.252512[/C][C]2.1127[/C][C]0.019099[/C][/ROW]
[ROW][C]17[/C][C]0.223181[/C][C]1.8673[/C][C]0.033026[/C][/ROW]
[ROW][C]18[/C][C]0.20911[/C][C]1.7495[/C][C]0.04229[/C][/ROW]
[/TABLE]
Source: https://freestatistics.org/blog/index.php?pk=30149&T=1

Globally Unique Identifier (entire table): ba.freestatistics.org/blog/index.php?pk=30149&T=1

As an alternative you can also use a QR Code:  

The GUIDs for individual cells are displayed in the table below:

Autocorrelation Function
Time lag kACF(k)T-STATP-value
10.6182165.17241e-06
20.4742183.96768.7e-05
30.5441364.55261.1e-05
40.5995195.01592e-06
50.5248044.39082e-05
60.5574714.66417e-06
70.4285353.58540.000309
80.4936864.13054.9e-05
90.4099713.43010.000508
100.2805742.34750.010868
110.3681583.08020.001478
120.5732384.79614e-06
130.2737342.29020.012513
140.2032941.70090.046702
150.2117411.77160.040411
160.2525122.11270.019099
170.2231811.86730.033026
180.209111.74950.04229


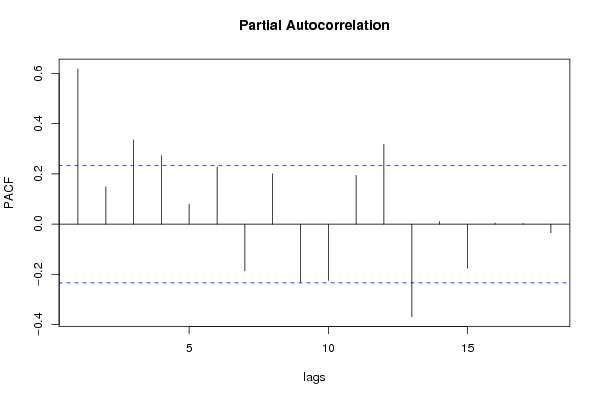
Partial Autocorrelation Function
Time lag kPACF(k)T-STATP-value
10.6182165.17241e-06
20.1489561.24630.108412
30.335292.80520.003252
40.2725622.28040.012816
50.0786160.65770.256429
60.2275471.90380.030524
7-0.186271-1.55850.061817
80.2003681.67640.04906
9-0.232394-1.94430.027937
10-0.22411-1.8750.032479
110.1939611.62280.054565
120.3187342.66670.004753
13-0.368531-3.08330.001464
140.0103830.08690.465513
15-0.175301-1.46670.073472
160.0043640.03650.485491
170.0023270.01950.492262
18-0.033937-0.28390.388648

\begin{tabular}{lllllllll}
\hline
Partial Autocorrelation Function \tabularnewline
Time lag k & PACF(k) & T-STAT & P-value \tabularnewline
1 & 0.618216 & 5.1724 & 1e-06 \tabularnewline
2 & 0.148956 & 1.2463 & 0.108412 \tabularnewline
3 & 0.33529 & 2.8052 & 0.003252 \tabularnewline
4 & 0.272562 & 2.2804 & 0.012816 \tabularnewline
5 & 0.078616 & 0.6577 & 0.256429 \tabularnewline
6 & 0.227547 & 1.9038 & 0.030524 \tabularnewline
7 & -0.186271 & -1.5585 & 0.061817 \tabularnewline
8 & 0.200368 & 1.6764 & 0.04906 \tabularnewline
9 & -0.232394 & -1.9443 & 0.027937 \tabularnewline
10 & -0.22411 & -1.875 & 0.032479 \tabularnewline
11 & 0.193961 & 1.6228 & 0.054565 \tabularnewline
12 & 0.318734 & 2.6667 & 0.004753 \tabularnewline
13 & -0.368531 & -3.0833 & 0.001464 \tabularnewline
14 & 0.010383 & 0.0869 & 0.465513 \tabularnewline
15 & -0.175301 & -1.4667 & 0.073472 \tabularnewline
16 & 0.004364 & 0.0365 & 0.485491 \tabularnewline
17 & 0.002327 & 0.0195 & 0.492262 \tabularnewline
18 & -0.033937 & -0.2839 & 0.388648 \tabularnewline
\hline
\end{tabular}
%Source: https://freestatistics.org/blog/index.php?pk=30149&T=2

[TABLE]
[ROW][C]Partial Autocorrelation Function[/C][/ROW]
[ROW][C]Time lag k[/C][C]PACF(k)[/C][C]T-STAT[/C][C]P-value[/C][/ROW]
[ROW][C]1[/C][C]0.618216[/C][C]5.1724[/C][C]1e-06[/C][/ROW]
[ROW][C]2[/C][C]0.148956[/C][C]1.2463[/C][C]0.108412[/C][/ROW]
[ROW][C]3[/C][C]0.33529[/C][C]2.8052[/C][C]0.003252[/C][/ROW]
[ROW][C]4[/C][C]0.272562[/C][C]2.2804[/C][C]0.012816[/C][/ROW]
[ROW][C]5[/C][C]0.078616[/C][C]0.6577[/C][C]0.256429[/C][/ROW]
[ROW][C]6[/C][C]0.227547[/C][C]1.9038[/C][C]0.030524[/C][/ROW]
[ROW][C]7[/C][C]-0.186271[/C][C]-1.5585[/C][C]0.061817[/C][/ROW]
[ROW][C]8[/C][C]0.200368[/C][C]1.6764[/C][C]0.04906[/C][/ROW]
[ROW][C]9[/C][C]-0.232394[/C][C]-1.9443[/C][C]0.027937[/C][/ROW]
[ROW][C]10[/C][C]-0.22411[/C][C]-1.875[/C][C]0.032479[/C][/ROW]
[ROW][C]11[/C][C]0.193961[/C][C]1.6228[/C][C]0.054565[/C][/ROW]
[ROW][C]12[/C][C]0.318734[/C][C]2.6667[/C][C]0.004753[/C][/ROW]
[ROW][C]13[/C][C]-0.368531[/C][C]-3.0833[/C][C]0.001464[/C][/ROW]
[ROW][C]14[/C][C]0.010383[/C][C]0.0869[/C][C]0.465513[/C][/ROW]
[ROW][C]15[/C][C]-0.175301[/C][C]-1.4667[/C][C]0.073472[/C][/ROW]
[ROW][C]16[/C][C]0.004364[/C][C]0.0365[/C][C]0.485491[/C][/ROW]
[ROW][C]17[/C][C]0.002327[/C][C]0.0195[/C][C]0.492262[/C][/ROW]
[ROW][C]18[/C][C]-0.033937[/C][C]-0.2839[/C][C]0.388648[/C][/ROW]
[/TABLE]
Source: https://freestatistics.org/blog/index.php?pk=30149&T=2

Globally Unique Identifier (entire table): ba.freestatistics.org/blog/index.php?pk=30149&T=2

As an alternative you can also use a QR Code:  

The GUIDs for individual cells are displayed in the table below:

Partial Autocorrelation Function
Time lag kPACF(k)T-STATP-value
10.6182165.17241e-06
20.1489561.24630.108412
30.335292.80520.003252
40.2725622.28040.012816
50.0786160.65770.256429
60.2275471.90380.030524
7-0.186271-1.55850.061817
80.2003681.67640.04906
9-0.232394-1.94430.027937
10-0.22411-1.8750.032479
110.1939611.62280.054565
120.3187342.66670.004753
13-0.368531-3.08330.001464
140.0103830.08690.465513
15-0.175301-1.46670.073472
160.0043640.03650.485491
170.0023270.01950.492262
18-0.033937-0.28390.388648


Parameters (Session):
par1 = Default ; par2 = 1 ; par3 = 0 ; par4 = 0 ; par5 = 12 ;
Parameters (R input):
par1 = Default ; par2 = 1 ; par3 = 0 ; par4 = 0 ; par5 = 12 ;
R code (references can be found in the software module):
if (par1 == 'Default') {
par1 = 10*log10(length(x))
} else {
par1 <- as.numeric(par1)
}
par2 <- as.numeric(par2)
par3 <- as.numeric(par3)
par4 <- as.numeric(par4)
par5 <- as.numeric(par5)
if (par2 == 0) {
x <- log(x)
} else {
x <- (x ^ par2 - 1) / par2
}
if (par3 > 0) x <- diff(x,lag=1,difference=par3)
if (par4 > 0) x <- diff(x,lag=par5,difference=par4)
bitmap(file='pic1.png')
racf <- acf(x,par1,main='Autocorrelation',xlab='lags',ylab='ACF')
dev.off()
bitmap(file='pic2.png')
rpacf <- pacf(x,par1,main='Partial Autocorrelation',xlab='lags',ylab='PACF')
dev.off()
(myacf <- c(racf$acf))
(mypacf <- c(rpacf$acf))
lengthx <- length(x)
sqrtn <- sqrt(lengthx)
load(file='createtable')
a<-table.start()
a<-table.row.start(a)
a<-table.element(a,'Autocorrelation Function',4,TRUE)
a<-table.row.end(a)
a<-table.row.start(a)
a<-table.element(a,'Time lag k',header=TRUE)
a<-table.element(a,hyperlink('basics.htm','ACF(k)','click here for more information about the Autocorrelation Function'),header=TRUE)
a<-table.element(a,'T-STAT',header=TRUE)
a<-table.element(a,'P-value',header=TRUE)
a<-table.row.end(a)
for (i in 2:(par1+1)) {
a<-table.row.start(a)
a<-table.element(a,i-1,header=TRUE)
a<-table.element(a,round(myacf[i],6))
mytstat <- myacf[i]*sqrtn
a<-table.element(a,round(mytstat,4))
a<-table.element(a,round(1-pt(abs(mytstat),lengthx),6))
a<-table.row.end(a)
}
a<-table.end(a)
table.save(a,file='mytable.tab')
a<-table.start()
a<-table.row.start(a)
a<-table.element(a,'Partial Autocorrelation Function',4,TRUE)
a<-table.row.end(a)
a<-table.row.start(a)
a<-table.element(a,'Time lag k',header=TRUE)
a<-table.element(a,hyperlink('basics.htm','PACF(k)','click here for more information about the Partial Autocorrelation Function'),header=TRUE)
a<-table.element(a,'T-STAT',header=TRUE)
a<-table.element(a,'P-value',header=TRUE)
a<-table.row.end(a)
for (i in 1:par1) {
a<-table.row.start(a)
a<-table.element(a,i,header=TRUE)
a<-table.element(a,round(mypacf[i],6))
mytstat <- mypacf[i]*sqrtn
a<-table.element(a,round(mytstat,4))
a<-table.element(a,round(1-pt(abs(mytstat),lengthx),6))
a<-table.row.end(a)
}
a<-table.end(a)
table.save(a,file='mytable1.tab')