Free Statistics

of Irreproducible Research!

Author's title

Author*Unverified author*
R Software Modulerwasp_autocorrelation.wasp
Title produced by software(Partial) Autocorrelation Function
Date of computationSun, 07 Dec 2008 08:14:25 -0700
Cite this page as followsStatistical Computations at FreeStatistics.org, Office for Research Development and Education, URL https://freestatistics.org/blog/index.php?v=date/2008/Dec/07/t1228662942bo9sx7ptl7fsxp8.htm/, Retrieved Sun, 19 May 2024 09:21:08 +0000
Statistical Computations at FreeStatistics.org, Office for Research Development and Education, URL https://freestatistics.org/blog/index.php?pk=30062, Retrieved Sun, 19 May 2024 09:21:08 +0000
QR Codes:

Original text written by user:
IsPrivate?No (this computation is public)
User-defined keywords
Estimated Impact204
Family? (F = Feedback message, R = changed R code, M = changed R Module, P = changed Parameters, D = changed Data)
F     [(Partial) Autocorrelation Function] [paper bel20 autoc...] [2008-12-03 13:05:59] [f58cc3b532da25682c394745f1a82535]
-   PD  [(Partial) Autocorrelation Function] [paper autocorrela...] [2008-12-03 14:02:03] [f58cc3b532da25682c394745f1a82535]
-   P       [(Partial) Autocorrelation Function] [] [2008-12-07 15:14:25] [d41d8cd98f00b204e9800998ecf8427e] [Current]
Feedback Forum

Post a new message
Dataseries X:
2659.81
2638.53
2720.25
2745.88
2735.7
2811.7
2799.43
2555.28
2304.98
2214.95
2065.81
1940.49
2042
1995.37
1946.81
1765.9
1635.25
1833.42
1910.43
1959.67
1969.6
2061.41
2093.48
2120.88
2174.56
2196.72
2350.44
2440.25
2408.64
2472.81
2407.6
2454.62
2448.05
2497.84
2645.64
2756.76
2849.27
2921.44
2981.85
3080.58
3106.22
3119.31
3061.26
3097.31
3161.69
3257.16
3277.01
3295.32
3363.99
3494.17
3667.03
3813.06
3917.96
3895.51
3801.06
3570.12
3701.61
3862.27
3970.1
4138.52
4199.75
4290.89
4443.91
4502.64
4356.98
4591.27
4696.96
4621.4
4562.84
4202.52
4296.49
4435.23
4105.18
4116.68
3844.49
3720.98
3674.4
3857.62
3801.06
3504.37
3032.6
3047.03


Summary of computational transaction
Raw Inputview raw input (R code)
Raw Outputview raw output of R engine
Computing time1 seconds
R Server'Gwilym Jenkins' @ 72.249.127.135

\begin{tabular}{lllllllll}
\hline
Summary of computational transaction \tabularnewline
Raw Input & view raw input (R code)  \tabularnewline
Raw Output & view raw output of R engine  \tabularnewline
Computing time & 1 seconds \tabularnewline
R Server & 'Gwilym Jenkins' @ 72.249.127.135 \tabularnewline
\hline
\end{tabular}
%Source: https://freestatistics.org/blog/index.php?pk=30062&T=0

[TABLE]
[ROW][C]Summary of computational transaction[/C][/ROW]
[ROW][C]Raw Input[/C][C]view raw input (R code) [/C][/ROW]
[ROW][C]Raw Output[/C][C]view raw output of R engine [/C][/ROW]
[ROW][C]Computing time[/C][C]1 seconds[/C][/ROW]
[ROW][C]R Server[/C][C]'Gwilym Jenkins' @ 72.249.127.135[/C][/ROW]
[/TABLE]
Source: https://freestatistics.org/blog/index.php?pk=30062&T=0

Globally Unique Identifier (entire table): ba.freestatistics.org/blog/index.php?pk=30062&T=0

As an alternative you can also use a QR Code:  

The GUIDs for individual cells are displayed in the table below:

Summary of computational transaction
Raw Inputview raw input (R code)
Raw Outputview raw output of R engine
Computing time1 seconds
R Server'Gwilym Jenkins' @ 72.249.127.135


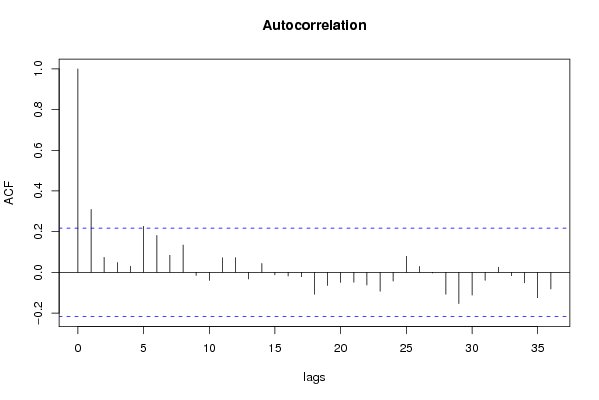
Autocorrelation Function
Time lag kACF(k)T-STATP-value
10.309232.78310.003349
20.0736540.66290.254642
30.0482830.43450.332523
40.0305020.27450.392193
50.2263512.03720.02245
60.1816591.63490.052972
70.0837890.75410.226487
80.1339691.20570.115717
9-0.015315-0.13780.445357
10-0.039656-0.35690.361047
110.0716810.64510.260333
120.071860.64670.259814
13-0.032541-0.29290.385185
140.0433640.39030.348678
15-0.011944-0.10750.457332
16-0.017475-0.15730.437708
17-0.021577-0.19420.423254
18-0.107256-0.96530.168634
19-0.064496-0.58050.281607
20-0.049432-0.44490.328793
21-0.048306-0.43480.332449
22-0.061658-0.55490.290239
23-0.092439-0.8320.203942
24-0.042787-0.38510.350591
250.0786810.70810.240448
260.028990.26090.397411
27-0.002862-0.02580.489757
28-0.107213-0.96490.168729
29-0.153601-1.38240.085323
30-0.111514-1.00360.159273
31-0.039096-0.35190.362927
320.0256080.23050.409151
33-0.016102-0.14490.442569
34-0.051555-0.4640.321949
35-0.124784-1.12310.132365
36-0.081439-0.7330.232852

\begin{tabular}{lllllllll}
\hline
Autocorrelation Function \tabularnewline
Time lag k & ACF(k) & T-STAT & P-value \tabularnewline
1 & 0.30923 & 2.7831 & 0.003349 \tabularnewline
2 & 0.073654 & 0.6629 & 0.254642 \tabularnewline
3 & 0.048283 & 0.4345 & 0.332523 \tabularnewline
4 & 0.030502 & 0.2745 & 0.392193 \tabularnewline
5 & 0.226351 & 2.0372 & 0.02245 \tabularnewline
6 & 0.181659 & 1.6349 & 0.052972 \tabularnewline
7 & 0.083789 & 0.7541 & 0.226487 \tabularnewline
8 & 0.133969 & 1.2057 & 0.115717 \tabularnewline
9 & -0.015315 & -0.1378 & 0.445357 \tabularnewline
10 & -0.039656 & -0.3569 & 0.361047 \tabularnewline
11 & 0.071681 & 0.6451 & 0.260333 \tabularnewline
12 & 0.07186 & 0.6467 & 0.259814 \tabularnewline
13 & -0.032541 & -0.2929 & 0.385185 \tabularnewline
14 & 0.043364 & 0.3903 & 0.348678 \tabularnewline
15 & -0.011944 & -0.1075 & 0.457332 \tabularnewline
16 & -0.017475 & -0.1573 & 0.437708 \tabularnewline
17 & -0.021577 & -0.1942 & 0.423254 \tabularnewline
18 & -0.107256 & -0.9653 & 0.168634 \tabularnewline
19 & -0.064496 & -0.5805 & 0.281607 \tabularnewline
20 & -0.049432 & -0.4449 & 0.328793 \tabularnewline
21 & -0.048306 & -0.4348 & 0.332449 \tabularnewline
22 & -0.061658 & -0.5549 & 0.290239 \tabularnewline
23 & -0.092439 & -0.832 & 0.203942 \tabularnewline
24 & -0.042787 & -0.3851 & 0.350591 \tabularnewline
25 & 0.078681 & 0.7081 & 0.240448 \tabularnewline
26 & 0.02899 & 0.2609 & 0.397411 \tabularnewline
27 & -0.002862 & -0.0258 & 0.489757 \tabularnewline
28 & -0.107213 & -0.9649 & 0.168729 \tabularnewline
29 & -0.153601 & -1.3824 & 0.085323 \tabularnewline
30 & -0.111514 & -1.0036 & 0.159273 \tabularnewline
31 & -0.039096 & -0.3519 & 0.362927 \tabularnewline
32 & 0.025608 & 0.2305 & 0.409151 \tabularnewline
33 & -0.016102 & -0.1449 & 0.442569 \tabularnewline
34 & -0.051555 & -0.464 & 0.321949 \tabularnewline
35 & -0.124784 & -1.1231 & 0.132365 \tabularnewline
36 & -0.081439 & -0.733 & 0.232852 \tabularnewline
\hline
\end{tabular}
%Source: https://freestatistics.org/blog/index.php?pk=30062&T=1

[TABLE]
[ROW][C]Autocorrelation Function[/C][/ROW]
[ROW][C]Time lag k[/C][C]ACF(k)[/C][C]T-STAT[/C][C]P-value[/C][/ROW]
[ROW][C]1[/C][C]0.30923[/C][C]2.7831[/C][C]0.003349[/C][/ROW]
[ROW][C]2[/C][C]0.073654[/C][C]0.6629[/C][C]0.254642[/C][/ROW]
[ROW][C]3[/C][C]0.048283[/C][C]0.4345[/C][C]0.332523[/C][/ROW]
[ROW][C]4[/C][C]0.030502[/C][C]0.2745[/C][C]0.392193[/C][/ROW]
[ROW][C]5[/C][C]0.226351[/C][C]2.0372[/C][C]0.02245[/C][/ROW]
[ROW][C]6[/C][C]0.181659[/C][C]1.6349[/C][C]0.052972[/C][/ROW]
[ROW][C]7[/C][C]0.083789[/C][C]0.7541[/C][C]0.226487[/C][/ROW]
[ROW][C]8[/C][C]0.133969[/C][C]1.2057[/C][C]0.115717[/C][/ROW]
[ROW][C]9[/C][C]-0.015315[/C][C]-0.1378[/C][C]0.445357[/C][/ROW]
[ROW][C]10[/C][C]-0.039656[/C][C]-0.3569[/C][C]0.361047[/C][/ROW]
[ROW][C]11[/C][C]0.071681[/C][C]0.6451[/C][C]0.260333[/C][/ROW]
[ROW][C]12[/C][C]0.07186[/C][C]0.6467[/C][C]0.259814[/C][/ROW]
[ROW][C]13[/C][C]-0.032541[/C][C]-0.2929[/C][C]0.385185[/C][/ROW]
[ROW][C]14[/C][C]0.043364[/C][C]0.3903[/C][C]0.348678[/C][/ROW]
[ROW][C]15[/C][C]-0.011944[/C][C]-0.1075[/C][C]0.457332[/C][/ROW]
[ROW][C]16[/C][C]-0.017475[/C][C]-0.1573[/C][C]0.437708[/C][/ROW]
[ROW][C]17[/C][C]-0.021577[/C][C]-0.1942[/C][C]0.423254[/C][/ROW]
[ROW][C]18[/C][C]-0.107256[/C][C]-0.9653[/C][C]0.168634[/C][/ROW]
[ROW][C]19[/C][C]-0.064496[/C][C]-0.5805[/C][C]0.281607[/C][/ROW]
[ROW][C]20[/C][C]-0.049432[/C][C]-0.4449[/C][C]0.328793[/C][/ROW]
[ROW][C]21[/C][C]-0.048306[/C][C]-0.4348[/C][C]0.332449[/C][/ROW]
[ROW][C]22[/C][C]-0.061658[/C][C]-0.5549[/C][C]0.290239[/C][/ROW]
[ROW][C]23[/C][C]-0.092439[/C][C]-0.832[/C][C]0.203942[/C][/ROW]
[ROW][C]24[/C][C]-0.042787[/C][C]-0.3851[/C][C]0.350591[/C][/ROW]
[ROW][C]25[/C][C]0.078681[/C][C]0.7081[/C][C]0.240448[/C][/ROW]
[ROW][C]26[/C][C]0.02899[/C][C]0.2609[/C][C]0.397411[/C][/ROW]
[ROW][C]27[/C][C]-0.002862[/C][C]-0.0258[/C][C]0.489757[/C][/ROW]
[ROW][C]28[/C][C]-0.107213[/C][C]-0.9649[/C][C]0.168729[/C][/ROW]
[ROW][C]29[/C][C]-0.153601[/C][C]-1.3824[/C][C]0.085323[/C][/ROW]
[ROW][C]30[/C][C]-0.111514[/C][C]-1.0036[/C][C]0.159273[/C][/ROW]
[ROW][C]31[/C][C]-0.039096[/C][C]-0.3519[/C][C]0.362927[/C][/ROW]
[ROW][C]32[/C][C]0.025608[/C][C]0.2305[/C][C]0.409151[/C][/ROW]
[ROW][C]33[/C][C]-0.016102[/C][C]-0.1449[/C][C]0.442569[/C][/ROW]
[ROW][C]34[/C][C]-0.051555[/C][C]-0.464[/C][C]0.321949[/C][/ROW]
[ROW][C]35[/C][C]-0.124784[/C][C]-1.1231[/C][C]0.132365[/C][/ROW]
[ROW][C]36[/C][C]-0.081439[/C][C]-0.733[/C][C]0.232852[/C][/ROW]
[/TABLE]
Source: https://freestatistics.org/blog/index.php?pk=30062&T=1

Globally Unique Identifier (entire table): ba.freestatistics.org/blog/index.php?pk=30062&T=1

As an alternative you can also use a QR Code:  

The GUIDs for individual cells are displayed in the table below:

Autocorrelation Function
Time lag kACF(k)T-STATP-value
10.309232.78310.003349
20.0736540.66290.254642
30.0482830.43450.332523
40.0305020.27450.392193
50.2263512.03720.02245
60.1816591.63490.052972
70.0837890.75410.226487
80.1339691.20570.115717
9-0.015315-0.13780.445357
10-0.039656-0.35690.361047
110.0716810.64510.260333
120.071860.64670.259814
13-0.032541-0.29290.385185
140.0433640.39030.348678
15-0.011944-0.10750.457332
16-0.017475-0.15730.437708
17-0.021577-0.19420.423254
18-0.107256-0.96530.168634
19-0.064496-0.58050.281607
20-0.049432-0.44490.328793
21-0.048306-0.43480.332449
22-0.061658-0.55490.290239
23-0.092439-0.8320.203942
24-0.042787-0.38510.350591
250.0786810.70810.240448
260.028990.26090.397411
27-0.002862-0.02580.489757
28-0.107213-0.96490.168729
29-0.153601-1.38240.085323
30-0.111514-1.00360.159273
31-0.039096-0.35190.362927
320.0256080.23050.409151
33-0.016102-0.14490.442569
34-0.051555-0.4640.321949
35-0.124784-1.12310.132365
36-0.081439-0.7330.232852


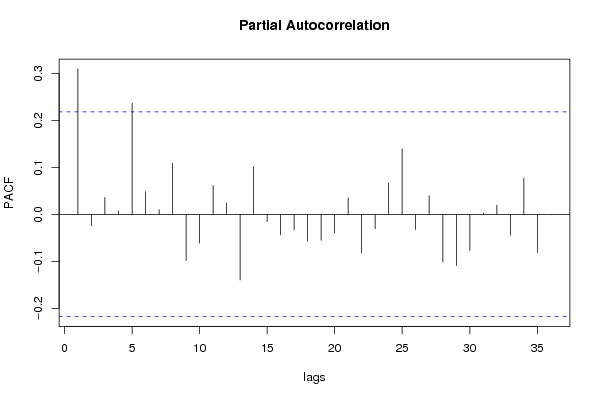
Partial Autocorrelation Function
Time lag kPACF(k)T-STATP-value
10.309232.78310.003349
2-0.024291-0.21860.413747
30.0359190.32330.37366
40.0074070.06670.473506
50.2366622.130.018105
60.0484980.43650.331823
70.0097180.08750.465259
80.1081950.97380.166539
9-0.098084-0.88280.189991
10-0.061514-0.55360.290681
110.0610510.54950.2921
120.0239770.21580.414844
13-0.139671-1.2570.106176
140.1010570.90950.182888
15-0.015631-0.14070.444235
16-0.043585-0.39230.347948
17-0.032949-0.29650.383789
18-0.057134-0.51420.304253
19-0.055257-0.49730.310158
20-0.039932-0.35940.360121
210.0348240.31340.377384
22-0.082044-0.73840.231205
23-0.031008-0.27910.390449
240.0667720.60090.274777
250.1392671.25340.106832
26-0.032458-0.29210.38547
270.0394080.35470.36188
28-0.101418-0.91280.182038
29-0.108946-0.98050.164877
30-0.076868-0.69180.245516
310.0027450.02470.490177
320.0192690.17340.431378
33-0.044354-0.39920.345405
340.0769720.69280.245224
35-0.081361-0.73230.233064
360.0002950.00270.498943

\begin{tabular}{lllllllll}
\hline
Partial Autocorrelation Function \tabularnewline
Time lag k & PACF(k) & T-STAT & P-value \tabularnewline
1 & 0.30923 & 2.7831 & 0.003349 \tabularnewline
2 & -0.024291 & -0.2186 & 0.413747 \tabularnewline
3 & 0.035919 & 0.3233 & 0.37366 \tabularnewline
4 & 0.007407 & 0.0667 & 0.473506 \tabularnewline
5 & 0.236662 & 2.13 & 0.018105 \tabularnewline
6 & 0.048498 & 0.4365 & 0.331823 \tabularnewline
7 & 0.009718 & 0.0875 & 0.465259 \tabularnewline
8 & 0.108195 & 0.9738 & 0.166539 \tabularnewline
9 & -0.098084 & -0.8828 & 0.189991 \tabularnewline
10 & -0.061514 & -0.5536 & 0.290681 \tabularnewline
11 & 0.061051 & 0.5495 & 0.2921 \tabularnewline
12 & 0.023977 & 0.2158 & 0.414844 \tabularnewline
13 & -0.139671 & -1.257 & 0.106176 \tabularnewline
14 & 0.101057 & 0.9095 & 0.182888 \tabularnewline
15 & -0.015631 & -0.1407 & 0.444235 \tabularnewline
16 & -0.043585 & -0.3923 & 0.347948 \tabularnewline
17 & -0.032949 & -0.2965 & 0.383789 \tabularnewline
18 & -0.057134 & -0.5142 & 0.304253 \tabularnewline
19 & -0.055257 & -0.4973 & 0.310158 \tabularnewline
20 & -0.039932 & -0.3594 & 0.360121 \tabularnewline
21 & 0.034824 & 0.3134 & 0.377384 \tabularnewline
22 & -0.082044 & -0.7384 & 0.231205 \tabularnewline
23 & -0.031008 & -0.2791 & 0.390449 \tabularnewline
24 & 0.066772 & 0.6009 & 0.274777 \tabularnewline
25 & 0.139267 & 1.2534 & 0.106832 \tabularnewline
26 & -0.032458 & -0.2921 & 0.38547 \tabularnewline
27 & 0.039408 & 0.3547 & 0.36188 \tabularnewline
28 & -0.101418 & -0.9128 & 0.182038 \tabularnewline
29 & -0.108946 & -0.9805 & 0.164877 \tabularnewline
30 & -0.076868 & -0.6918 & 0.245516 \tabularnewline
31 & 0.002745 & 0.0247 & 0.490177 \tabularnewline
32 & 0.019269 & 0.1734 & 0.431378 \tabularnewline
33 & -0.044354 & -0.3992 & 0.345405 \tabularnewline
34 & 0.076972 & 0.6928 & 0.245224 \tabularnewline
35 & -0.081361 & -0.7323 & 0.233064 \tabularnewline
36 & 0.000295 & 0.0027 & 0.498943 \tabularnewline
\hline
\end{tabular}
%Source: https://freestatistics.org/blog/index.php?pk=30062&T=2

[TABLE]
[ROW][C]Partial Autocorrelation Function[/C][/ROW]
[ROW][C]Time lag k[/C][C]PACF(k)[/C][C]T-STAT[/C][C]P-value[/C][/ROW]
[ROW][C]1[/C][C]0.30923[/C][C]2.7831[/C][C]0.003349[/C][/ROW]
[ROW][C]2[/C][C]-0.024291[/C][C]-0.2186[/C][C]0.413747[/C][/ROW]
[ROW][C]3[/C][C]0.035919[/C][C]0.3233[/C][C]0.37366[/C][/ROW]
[ROW][C]4[/C][C]0.007407[/C][C]0.0667[/C][C]0.473506[/C][/ROW]
[ROW][C]5[/C][C]0.236662[/C][C]2.13[/C][C]0.018105[/C][/ROW]
[ROW][C]6[/C][C]0.048498[/C][C]0.4365[/C][C]0.331823[/C][/ROW]
[ROW][C]7[/C][C]0.009718[/C][C]0.0875[/C][C]0.465259[/C][/ROW]
[ROW][C]8[/C][C]0.108195[/C][C]0.9738[/C][C]0.166539[/C][/ROW]
[ROW][C]9[/C][C]-0.098084[/C][C]-0.8828[/C][C]0.189991[/C][/ROW]
[ROW][C]10[/C][C]-0.061514[/C][C]-0.5536[/C][C]0.290681[/C][/ROW]
[ROW][C]11[/C][C]0.061051[/C][C]0.5495[/C][C]0.2921[/C][/ROW]
[ROW][C]12[/C][C]0.023977[/C][C]0.2158[/C][C]0.414844[/C][/ROW]
[ROW][C]13[/C][C]-0.139671[/C][C]-1.257[/C][C]0.106176[/C][/ROW]
[ROW][C]14[/C][C]0.101057[/C][C]0.9095[/C][C]0.182888[/C][/ROW]
[ROW][C]15[/C][C]-0.015631[/C][C]-0.1407[/C][C]0.444235[/C][/ROW]
[ROW][C]16[/C][C]-0.043585[/C][C]-0.3923[/C][C]0.347948[/C][/ROW]
[ROW][C]17[/C][C]-0.032949[/C][C]-0.2965[/C][C]0.383789[/C][/ROW]
[ROW][C]18[/C][C]-0.057134[/C][C]-0.5142[/C][C]0.304253[/C][/ROW]
[ROW][C]19[/C][C]-0.055257[/C][C]-0.4973[/C][C]0.310158[/C][/ROW]
[ROW][C]20[/C][C]-0.039932[/C][C]-0.3594[/C][C]0.360121[/C][/ROW]
[ROW][C]21[/C][C]0.034824[/C][C]0.3134[/C][C]0.377384[/C][/ROW]
[ROW][C]22[/C][C]-0.082044[/C][C]-0.7384[/C][C]0.231205[/C][/ROW]
[ROW][C]23[/C][C]-0.031008[/C][C]-0.2791[/C][C]0.390449[/C][/ROW]
[ROW][C]24[/C][C]0.066772[/C][C]0.6009[/C][C]0.274777[/C][/ROW]
[ROW][C]25[/C][C]0.139267[/C][C]1.2534[/C][C]0.106832[/C][/ROW]
[ROW][C]26[/C][C]-0.032458[/C][C]-0.2921[/C][C]0.38547[/C][/ROW]
[ROW][C]27[/C][C]0.039408[/C][C]0.3547[/C][C]0.36188[/C][/ROW]
[ROW][C]28[/C][C]-0.101418[/C][C]-0.9128[/C][C]0.182038[/C][/ROW]
[ROW][C]29[/C][C]-0.108946[/C][C]-0.9805[/C][C]0.164877[/C][/ROW]
[ROW][C]30[/C][C]-0.076868[/C][C]-0.6918[/C][C]0.245516[/C][/ROW]
[ROW][C]31[/C][C]0.002745[/C][C]0.0247[/C][C]0.490177[/C][/ROW]
[ROW][C]32[/C][C]0.019269[/C][C]0.1734[/C][C]0.431378[/C][/ROW]
[ROW][C]33[/C][C]-0.044354[/C][C]-0.3992[/C][C]0.345405[/C][/ROW]
[ROW][C]34[/C][C]0.076972[/C][C]0.6928[/C][C]0.245224[/C][/ROW]
[ROW][C]35[/C][C]-0.081361[/C][C]-0.7323[/C][C]0.233064[/C][/ROW]
[ROW][C]36[/C][C]0.000295[/C][C]0.0027[/C][C]0.498943[/C][/ROW]
[/TABLE]
Source: https://freestatistics.org/blog/index.php?pk=30062&T=2

Globally Unique Identifier (entire table): ba.freestatistics.org/blog/index.php?pk=30062&T=2

As an alternative you can also use a QR Code:  

The GUIDs for individual cells are displayed in the table below:

Partial Autocorrelation Function
Time lag kPACF(k)T-STATP-value
10.309232.78310.003349
2-0.024291-0.21860.413747
30.0359190.32330.37366
40.0074070.06670.473506
50.2366622.130.018105
60.0484980.43650.331823
70.0097180.08750.465259
80.1081950.97380.166539
9-0.098084-0.88280.189991
10-0.061514-0.55360.290681
110.0610510.54950.2921
120.0239770.21580.414844
13-0.139671-1.2570.106176
140.1010570.90950.182888
15-0.015631-0.14070.444235
16-0.043585-0.39230.347948
17-0.032949-0.29650.383789
18-0.057134-0.51420.304253
19-0.055257-0.49730.310158
20-0.039932-0.35940.360121
210.0348240.31340.377384
22-0.082044-0.73840.231205
23-0.031008-0.27910.390449
240.0667720.60090.274777
250.1392671.25340.106832
26-0.032458-0.29210.38547
270.0394080.35470.36188
28-0.101418-0.91280.182038
29-0.108946-0.98050.164877
30-0.076868-0.69180.245516
310.0027450.02470.490177
320.0192690.17340.431378
33-0.044354-0.39920.345405
340.0769720.69280.245224
35-0.081361-0.73230.233064
360.0002950.00270.498943


Parameters (Session):
par1 = 36 ; par2 = 0.9 ; par3 = 1 ; par4 = 0 ; par5 = 12 ;
Parameters (R input):
par1 = 36 ; par2 = 0.9 ; par3 = 1 ; par4 = 0 ; par5 = 12 ;
R code (references can be found in the software module):
if (par1 == 'Default') {
par1 = 10*log10(length(x))
} else {
par1 <- as.numeric(par1)
}
par2 <- as.numeric(par2)
par3 <- as.numeric(par3)
par4 <- as.numeric(par4)
par5 <- as.numeric(par5)
if (par2 == 0) {
x <- log(x)
} else {
x <- (x ^ par2 - 1) / par2
}
if (par3 > 0) x <- diff(x,lag=1,difference=par3)
if (par4 > 0) x <- diff(x,lag=par5,difference=par4)
bitmap(file='pic1.png')
racf <- acf(x,par1,main='Autocorrelation',xlab='lags',ylab='ACF')
dev.off()
bitmap(file='pic2.png')
rpacf <- pacf(x,par1,main='Partial Autocorrelation',xlab='lags',ylab='PACF')
dev.off()
(myacf <- c(racf$acf))
(mypacf <- c(rpacf$acf))
lengthx <- length(x)
sqrtn <- sqrt(lengthx)
load(file='createtable')
a<-table.start()
a<-table.row.start(a)
a<-table.element(a,'Autocorrelation Function',4,TRUE)
a<-table.row.end(a)
a<-table.row.start(a)
a<-table.element(a,'Time lag k',header=TRUE)
a<-table.element(a,hyperlink('basics.htm','ACF(k)','click here for more information about the Autocorrelation Function'),header=TRUE)
a<-table.element(a,'T-STAT',header=TRUE)
a<-table.element(a,'P-value',header=TRUE)
a<-table.row.end(a)
for (i in 2:(par1+1)) {
a<-table.row.start(a)
a<-table.element(a,i-1,header=TRUE)
a<-table.element(a,round(myacf[i],6))
mytstat <- myacf[i]*sqrtn
a<-table.element(a,round(mytstat,4))
a<-table.element(a,round(1-pt(abs(mytstat),lengthx),6))
a<-table.row.end(a)
}
a<-table.end(a)
table.save(a,file='mytable.tab')
a<-table.start()
a<-table.row.start(a)
a<-table.element(a,'Partial Autocorrelation Function',4,TRUE)
a<-table.row.end(a)
a<-table.row.start(a)
a<-table.element(a,'Time lag k',header=TRUE)
a<-table.element(a,hyperlink('basics.htm','PACF(k)','click here for more information about the Partial Autocorrelation Function'),header=TRUE)
a<-table.element(a,'T-STAT',header=TRUE)
a<-table.element(a,'P-value',header=TRUE)
a<-table.row.end(a)
for (i in 1:par1) {
a<-table.row.start(a)
a<-table.element(a,i,header=TRUE)
a<-table.element(a,round(mypacf[i],6))
mytstat <- mypacf[i]*sqrtn
a<-table.element(a,round(mytstat,4))
a<-table.element(a,round(1-pt(abs(mytstat),lengthx),6))
a<-table.row.end(a)
}
a<-table.end(a)
table.save(a,file='mytable1.tab')