Free Statistics

of Irreproducible Research!

Author's title

Author*The author of this computation has been verified*
R Software Modulerwasp_edauni.wasp
Title produced by softwareUnivariate Explorative Data Analysis
Date of computationSun, 07 Dec 2008 07:53:02 -0700
Cite this page as followsStatistical Computations at FreeStatistics.org, Office for Research Development and Education, URL https://freestatistics.org/blog/index.php?v=date/2008/Dec/07/t1228661665798t4n3t5vglp0c.htm/, Retrieved Sun, 19 May 2024 11:31:08 +0000
Statistical Computations at FreeStatistics.org, Office for Research Development and Education, URL https://freestatistics.org/blog/index.php?pk=30034, Retrieved Sun, 19 May 2024 11:31:08 +0000
QR Codes:

Original text written by user:
IsPrivate?No (this computation is public)
User-defined keywords
Estimated Impact155
Family? (F = Feedback message, R = changed R code, M = changed R Module, P = changed Parameters, D = changed Data)
F       [Univariate Explorative Data Analysis] [1: VS --> Belgi] [2008-12-07 14:53:02] [5040d663c8831657aab853d3d80c5057] [Current]
Feedback Forum
2009-01-24 18:23:24 [Ellen Van Ham] [reply
2009-01-24 18:27:16 [Ellen Van Ham] [reply
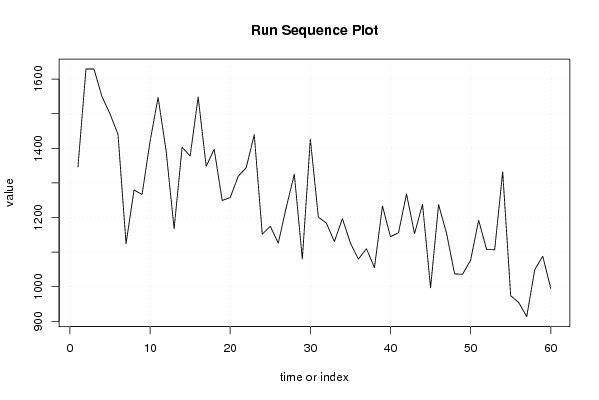
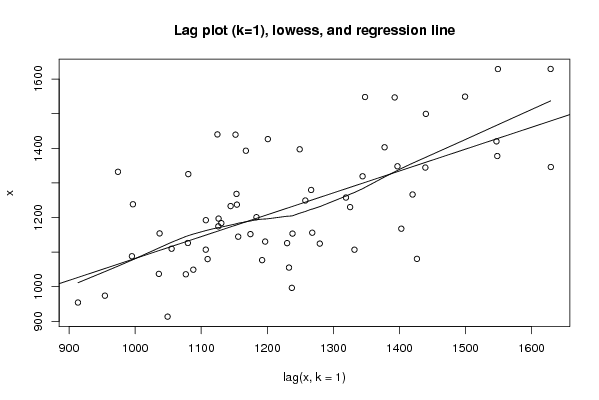
Met de Run Sequence Plot kunnen we nagaan of er verschuivingen zijn in locatie en of er vaste variaties zijn. Ook outliers zijn makkelijk te zien bij deze grafiek. Als de Run Sequence Plot vlak is, en bijgevolg weinig schommelingen vertoont, kunnen we spreken van een fixed-location. De voorwaarde van vaste variantie wordt voldaan als de verticale spreiding van deze plot ongeveer over de volledige horizontale as loopt.
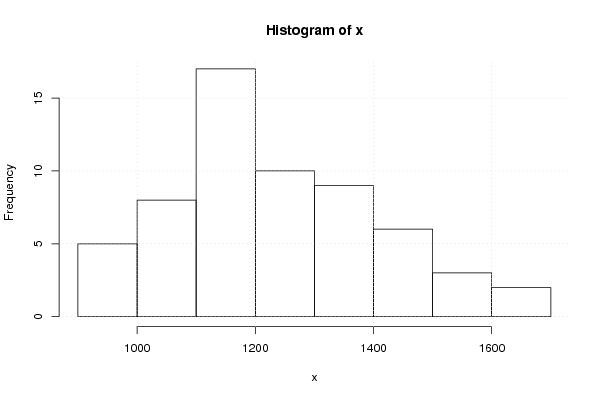
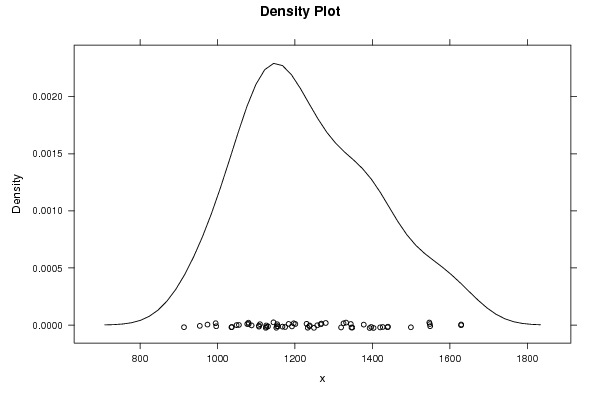
Vervolgens kijken we naar het Histogram en de Density Plot. Als deze “bell-shaped” is, is er sprake van een normaalverdeling. Dit betekent dat er een gelijke spreiding is van de gegevens.
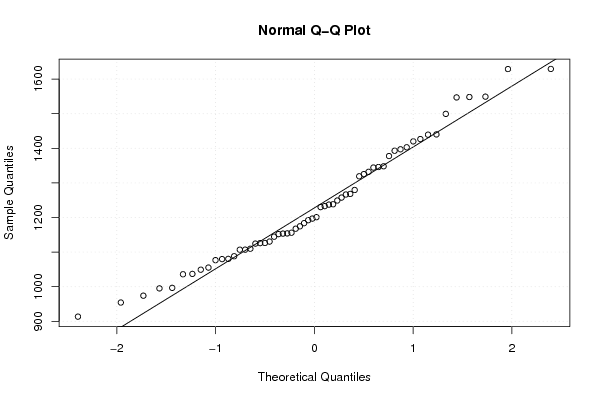
De Normal Q-Q Plot zegt ons iets meer over de spreiding. Je moet een denkbeeldige 45°-lijn. Als deze plot heeft een lineair verband heeft, wil dit zeggen dat de verdeling bijna normaal is.

Post a new message
Dataseries X:
1345,9
1629,3
1629
1549,2
1499,4
1440,1
1124,5
1279,5
1266,4
1420
1547
1392,9
1167,6
1402,9
1377,6
1548,2
1348
1397,1
1249,1
1257,6
1319,1
1344,3
1439,3
1151,9
1174,5
1125,9
1230
1325,4
1080,4
1426,6
1200,9
1183,6
1130,4
1196,8
1126,3
1079,8
1109,7
1055,2
1232,9
1144,5
1156
1268,1
1153,4
1238,2
996,6
1237,2
1154
1037
1035,9
1076,7
1192,2
1107
1106,9
1332
974
954,2
913,4
1049,1
1088
995,1


Summary of computational transaction
Raw Inputview raw input (R code)
Raw Outputview raw output of R engine
Computing time2 seconds
R Server'Gwilym Jenkins' @ 72.249.127.135

\begin{tabular}{lllllllll}
\hline
Summary of computational transaction \tabularnewline
Raw Input & view raw input (R code)  \tabularnewline
Raw Output & view raw output of R engine  \tabularnewline
Computing time & 2 seconds \tabularnewline
R Server & 'Gwilym Jenkins' @ 72.249.127.135 \tabularnewline
\hline
\end{tabular}
%Source: https://freestatistics.org/blog/index.php?pk=30034&T=0

[TABLE]
[ROW][C]Summary of computational transaction[/C][/ROW]
[ROW][C]Raw Input[/C][C]view raw input (R code) [/C][/ROW]
[ROW][C]Raw Output[/C][C]view raw output of R engine [/C][/ROW]
[ROW][C]Computing time[/C][C]2 seconds[/C][/ROW]
[ROW][C]R Server[/C][C]'Gwilym Jenkins' @ 72.249.127.135[/C][/ROW]
[/TABLE]
Source: https://freestatistics.org/blog/index.php?pk=30034&T=0

Globally Unique Identifier (entire table): ba.freestatistics.org/blog/index.php?pk=30034&T=0

As an alternative you can also use a QR Code:  

The GUIDs for individual cells are displayed in the table below:

Summary of computational transaction
Raw Inputview raw input (R code)
Raw Outputview raw output of R engine
Computing time2 seconds
R Server'Gwilym Jenkins' @ 72.249.127.135


Descriptive Statistics
# observations60
minimum913.4
Q11109.025
median1198.85
mean1233.56333333333
Q31346.425
maximum1629.3

\begin{tabular}{lllllllll}
\hline
Descriptive Statistics \tabularnewline
# observations & 60 \tabularnewline
minimum & 913.4 \tabularnewline
Q1 & 1109.025 \tabularnewline
median & 1198.85 \tabularnewline
mean & 1233.56333333333 \tabularnewline
Q3 & 1346.425 \tabularnewline
maximum & 1629.3 \tabularnewline
\hline
\end{tabular}
%Source: https://freestatistics.org/blog/index.php?pk=30034&T=1

[TABLE]
[ROW][C]Descriptive Statistics[/C][/ROW]
[ROW][C]# observations[/C][C]60[/C][/ROW]
[ROW][C]minimum[/C][C]913.4[/C][/ROW]
[ROW][C]Q1[/C][C]1109.025[/C][/ROW]
[ROW][C]median[/C][C]1198.85[/C][/ROW]
[ROW][C]mean[/C][C]1233.56333333333[/C][/ROW]
[ROW][C]Q3[/C][C]1346.425[/C][/ROW]
[ROW][C]maximum[/C][C]1629.3[/C][/ROW]
[/TABLE]
Source: https://freestatistics.org/blog/index.php?pk=30034&T=1

Globally Unique Identifier (entire table): ba.freestatistics.org/blog/index.php?pk=30034&T=1

As an alternative you can also use a QR Code:  

The GUIDs for individual cells are displayed in the table below:

Descriptive Statistics
# observations60
minimum913.4
Q11109.025
median1198.85
mean1233.56333333333
Q31346.425
maximum1629.3


Parameters (Session):
par1 = 0 ; par2 = 10 ;
Parameters (R input):
par1 = 0 ; par2 = 10 ;
R code (references can be found in the software module):
par1 <- as.numeric(par1)
par2 <- as.numeric(par2)
x <- as.ts(x)
library(lattice)
bitmap(file='pic1.png')
plot(x,type='l',main='Run Sequence Plot',xlab='time or index',ylab='value')
grid()
dev.off()
bitmap(file='pic2.png')
hist(x)
grid()
dev.off()
bitmap(file='pic3.png')
if (par1 > 0)
{
densityplot(~x,col='black',main=paste('Density Plot bw = ',par1),bw=par1)
} else {
densityplot(~x,col='black',main='Density Plot')
}
dev.off()
bitmap(file='pic4.png')
qqnorm(x)
qqline(x)
grid()
dev.off()
if (par2 > 0)
{
bitmap(file='lagplot1.png')
dum <- cbind(lag(x,k=1),x)
dum
dum1 <- dum[2:length(x),]
dum1
z <- as.data.frame(dum1)
z
plot(z,main='Lag plot (k=1), lowess, and regression line')
lines(lowess(z))
abline(lm(z))
dev.off()
if (par2 > 1) {
bitmap(file='lagplotpar2.png')
dum <- cbind(lag(x,k=par2),x)
dum
dum1 <- dum[(par2+1):length(x),]
dum1
z <- as.data.frame(dum1)
z
mylagtitle <- 'Lag plot (k='
mylagtitle <- paste(mylagtitle,par2,sep='')
mylagtitle <- paste(mylagtitle,'), and lowess',sep='')
plot(z,main=mylagtitle)
lines(lowess(z))
dev.off()
}
bitmap(file='pic5.png')
acf(x,lag.max=par2,main='Autocorrelation Function')
grid()
dev.off()
}
summary(x)
load(file='createtable')
a<-table.start()
a<-table.row.start(a)
a<-table.element(a,'Descriptive Statistics',2,TRUE)
a<-table.row.end(a)
a<-table.row.start(a)
a<-table.element(a,'# observations',header=TRUE)
a<-table.element(a,length(x))
a<-table.row.end(a)
a<-table.row.start(a)
a<-table.element(a,'minimum',header=TRUE)
a<-table.element(a,min(x))
a<-table.row.end(a)
a<-table.row.start(a)
a<-table.element(a,'Q1',header=TRUE)
a<-table.element(a,quantile(x,0.25))
a<-table.row.end(a)
a<-table.row.start(a)
a<-table.element(a,'median',header=TRUE)
a<-table.element(a,median(x))
a<-table.row.end(a)
a<-table.row.start(a)
a<-table.element(a,'mean',header=TRUE)
a<-table.element(a,mean(x))
a<-table.row.end(a)
a<-table.row.start(a)
a<-table.element(a,'Q3',header=TRUE)
a<-table.element(a,quantile(x,0.75))
a<-table.row.end(a)
a<-table.row.start(a)
a<-table.element(a,'maximum',header=TRUE)
a<-table.element(a,max(x))
a<-table.row.end(a)
a<-table.end(a)
table.save(a,file='mytable.tab')