Free Statistics

of Irreproducible Research!

Author's title

Author*The author of this computation has been verified*
R Software Modulerwasp_arimabackwardselection.wasp
Title produced by softwareARIMA Backward Selection
Date of computationSun, 07 Dec 2008 06:46:58 -0700
Cite this page as followsStatistical Computations at FreeStatistics.org, Office for Research Development and Education, URL https://freestatistics.org/blog/index.php?v=date/2008/Dec/07/t1228657779kjl1sdr4g8phgft.htm/, Retrieved Sun, 19 May 2024 11:29:06 +0000
Statistical Computations at FreeStatistics.org, Office for Research Development and Education, URL https://freestatistics.org/blog/index.php?pk=29983, Retrieved Sun, 19 May 2024 11:29:06 +0000
QR Codes:

Original text written by user:
IsPrivate?No (this computation is public)
User-defined keywords
Estimated Impact246
Family? (F = Feedback message, R = changed R code, M = changed R Module, P = changed Parameters, D = changed Data)
F     [Univariate Data Series] [Airline data] [2007-10-18 09:58:47] [42daae401fd3def69a25014f2252b4c2]
F RMPD  [Variance Reduction Matrix] [] [2008-11-30 18:13:06] [b745fd448f60064800b631a75a630267]
F RM D    [Standard Deviation-Mean Plot] [SMP Q1] [2008-12-07 13:12:10] [e5d91604aae608e98a8ea24759233f66]
F RM        [Variance Reduction Matrix] [VRM Q1] [2008-12-07 13:13:31] [e5d91604aae608e98a8ea24759233f66]
F RMP         [(Partial) Autocorrelation Function] [ACF Q2] [2008-12-07 13:20:49] [e5d91604aae608e98a8ea24759233f66]
F RMP             [ARIMA Backward Selection] [ARMA Q5] [2008-12-07 13:46:58] [55ca0ca4a201c9689dcf5fae352c92eb] [Current]
-   P               [ARIMA Backward Selection] [ARIMA] [2008-12-10 17:52:14] [e5d91604aae608e98a8ea24759233f66]
- RMPD              [Histogram] [Histogram inflatie] [2008-12-10 18:06:14] [e5d91604aae608e98a8ea24759233f66]
- RMPD              [Variance Reduction Matrix] [VRM werkloosheid] [2008-12-10 18:11:05] [e5d91604aae608e98a8ea24759233f66]
- RMPD              [Standard Deviation-Mean Plot] [SD mean plot] [2008-12-10 18:14:21] [e5d91604aae608e98a8ea24759233f66]
-   PD              [ARIMA Backward Selection] [ARIMA Inflatie op...] [2008-12-10 18:24:04] [e5d91604aae608e98a8ea24759233f66]
-   PD              [ARIMA Backward Selection] [ARIMA Inflatie op...] [2008-12-10 18:32:43] [e5d91604aae608e98a8ea24759233f66]
-   P                 [ARIMA Backward Selection] [Arima backward 1] [2008-12-18 15:19:24] [e5d91604aae608e98a8ea24759233f66]
F RMPD              [ARIMA Forecasting] [Forecasting Infla...] [2008-12-10 18:36:07] [e5d91604aae608e98a8ea24759233f66]
-   P                 [ARIMA Forecasting] [Forecasting] [2008-12-18 16:01:41] [e5d91604aae608e98a8ea24759233f66]
Feedback Forum
2008-12-15 10:14:48 [Jan Van Riet] [reply
Het feit dat je model zeer lage waarden heeft betekent dat je er weinig mee kan aanvangen, maar dit had je best nog wat verder uitgelegd.
Ik vind ook niets in de aard van een conclusie terug.
2008-12-15 10:15:34 [Jan Van Riet] [reply
Met zeer lage waarden bedoel ik trouwens de waarden van de parameters.
2008-12-15 20:15:42 [Jeroen Aerts] [reply
Ik weet niet wat hier is fout gelopen, je kan beter eens de berekening op het forum plaatsen vermoed ik. Want je hebt zulke lage waarden, dat ik niet weet of je met de berekening juist zit of hoe je ze moet interpreteren.

Post a new message
Dataseries X:
19
23
22
23
25
25
23
22
21
16
21
21
26
23
22
22
22
12
20
18
23
25
28
28
29
31
33
32
33
35
33
36
30
34
34
35
33
28
27
23
23
24
24
20
16
6
2
12
19
21
22
20
21
20
19
17
17
17
16
12
11
7
2
9
11
10
7
9
15
5
14
14
17
19
17
16
14
20
16
18
18
14
13
14
14
17
18
15
9
9
9
10
6
12
11
15
19
18
15
16
14
18
18
18
18
22
21
12
19
21
19
22
22
21
19
18
18
19
12
16


Summary of computational transaction
Raw Inputview raw input (R code)
Raw Outputview raw output of R engine
Computing time3 seconds
R Server'Gwilym Jenkins' @ 72.249.127.135

\begin{tabular}{lllllllll}
\hline
Summary of computational transaction \tabularnewline
Raw Input & view raw input (R code)  \tabularnewline
Raw Output & view raw output of R engine  \tabularnewline
Computing time & 3 seconds \tabularnewline
R Server & 'Gwilym Jenkins' @ 72.249.127.135 \tabularnewline
\hline
\end{tabular}
%Source: https://freestatistics.org/blog/index.php?pk=29983&T=0

[TABLE]
[ROW][C]Summary of computational transaction[/C][/ROW]
[ROW][C]Raw Input[/C][C]view raw input (R code) [/C][/ROW]
[ROW][C]Raw Output[/C][C]view raw output of R engine [/C][/ROW]
[ROW][C]Computing time[/C][C]3 seconds[/C][/ROW]
[ROW][C]R Server[/C][C]'Gwilym Jenkins' @ 72.249.127.135[/C][/ROW]
[/TABLE]
Source: https://freestatistics.org/blog/index.php?pk=29983&T=0

Globally Unique Identifier (entire table): ba.freestatistics.org/blog/index.php?pk=29983&T=0

As an alternative you can also use a QR Code:  

The GUIDs for individual cells are displayed in the table below:

Summary of computational transaction
Raw Inputview raw input (R code)
Raw Outputview raw output of R engine
Computing time3 seconds
R Server'Gwilym Jenkins' @ 72.249.127.135


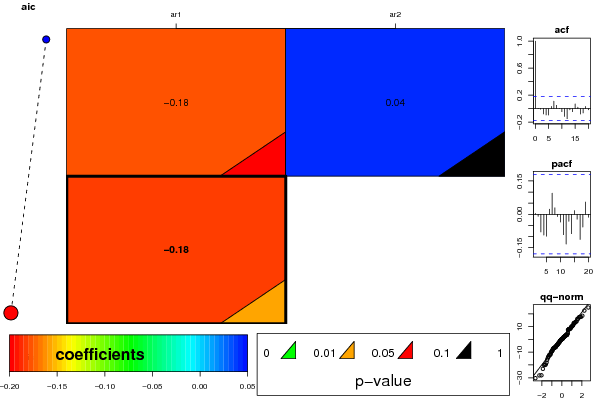
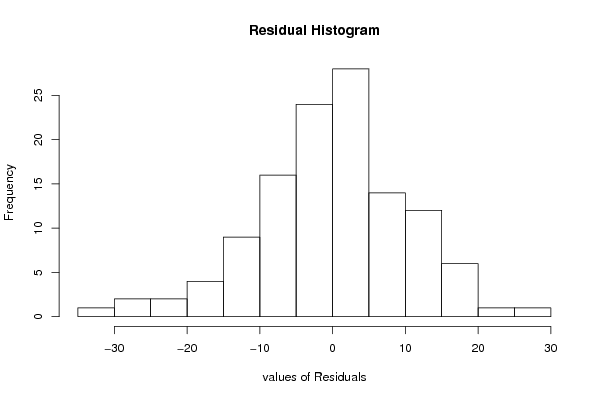
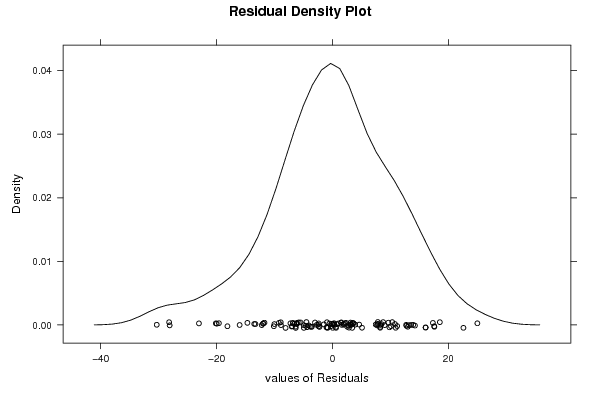
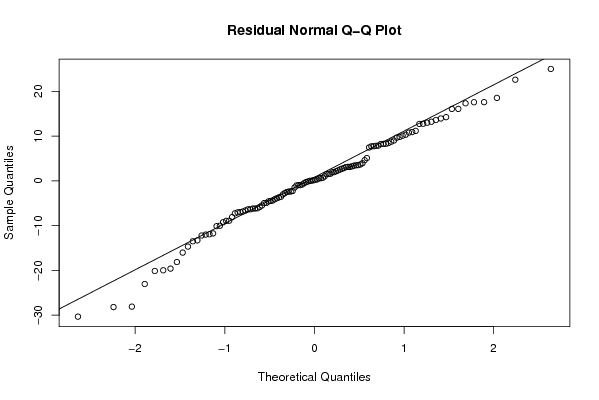
ARIMA Parameter Estimation and Backward Selection
Iterationar1ar2
Estimates ( 1 )-0.17510.0432
(p-val)(0.0593 )(0.6435 )
Estimates ( 2 )-0.18220
(p-val)(0.047 )(NA )
Estimates ( 3 )NANA
(p-val)(NA )(NA )

\begin{tabular}{lllllllll}
\hline
ARIMA Parameter Estimation and Backward Selection \tabularnewline
Iteration & ar1 & ar2 \tabularnewline
Estimates ( 1 ) & -0.1751 & 0.0432 \tabularnewline
(p-val) & (0.0593 ) & (0.6435 ) \tabularnewline
Estimates ( 2 ) & -0.1822 & 0 \tabularnewline
(p-val) & (0.047 ) & (NA ) \tabularnewline
Estimates ( 3 ) & NA & NA \tabularnewline
(p-val) & (NA ) & (NA ) \tabularnewline
\hline
\end{tabular}
%Source: https://freestatistics.org/blog/index.php?pk=29983&T=1

[TABLE]
[ROW][C]ARIMA Parameter Estimation and Backward Selection[/C][/ROW]
[ROW][C]Iteration[/C][C]ar1[/C][C]ar2[/C][/ROW]
[ROW][C]Estimates ( 1 )[/C][C]-0.1751[/C][C]0.0432[/C][/ROW]
[ROW][C](p-val)[/C][C](0.0593 )[/C][C](0.6435 )[/C][/ROW]
[ROW][C]Estimates ( 2 )[/C][C]-0.1822[/C][C]0[/C][/ROW]
[ROW][C](p-val)[/C][C](0.047 )[/C][C](NA )[/C][/ROW]
[ROW][C]Estimates ( 3 )[/C][C]NA[/C][C]NA[/C][/ROW]
[ROW][C](p-val)[/C][C](NA )[/C][C](NA )[/C][/ROW]
[/TABLE]
Source: https://freestatistics.org/blog/index.php?pk=29983&T=1

Globally Unique Identifier (entire table): ba.freestatistics.org/blog/index.php?pk=29983&T=1

As an alternative you can also use a QR Code:  

The GUIDs for individual cells are displayed in the table below:

ARIMA Parameter Estimation and Backward Selection
Iterationar1ar2
Estimates ( 1 )-0.17510.0432
(p-val)(0.0593 )(0.6435 )
Estimates ( 2 )-0.18220
(p-val)(0.047 )(NA )
Estimates ( 3 )NANA
(p-val)(NA )(NA )


Estimated ARIMA Residuals
Value
0.0459599403275641
12.7270767679144
-0.935973881263207
2.16920460165144
7.4676055873992
1.03822890018206
-7.03681484417367
-4.48931984824276
-3.55126362517309
-16.0163611253472
12.9993711137552
3.40276443383408
16.0784610258093
-7.24698225458509
-5.81435764282502
-0.139522908742507
0.142899759951263
-30.3203325691106
18.5307909490984
-0.80456704383387
13.9463557884068
9.83222017573694
10.9095840064133
1.53368307061997
3.10111305163646
7.83445684747848
8.46318768042383
-2.71799332896597
2.72958799277542
8.29505600464307
-6.33695790017974
9.64713901977603
-19.960945328698
10.3207667287459
3.5365235877136
3.12562067753399
-6.83013005548482
-19.5913329657518
-6.36240694791964
-13.4874892893024
-2.23920610649139
3.9414685152991
0.586872442749907
-13.2850457552832
-14.6716387824942
-28.0862507429362
-11.9119747627383
22.6038579575610
25.0050243145883
9.01965156012275
3.48871524181365
-6.18488256078965
1.94137849663367
-2.37383232356312
-3.87143045774840
-6.60335599738107
-0.946521410580608
0.267269282587172
-3.01421741267956
-11.9969069384567
-4.58277463821604
-10.0131529322707
-11.7275344832779
13.6035386469865
8.23694724118036
-2.36901803107735
-8.0879430749945
3.66651068235172
17.5703747701661
-23.0344188450699
17.589279213828
5.10180639247264
7.88725241727943
7.74088886548304
-5.48721639201799
-4.36490217695379
-6.11830159478329
17.3330564180503
-8.92591724033687
3.12860355810896
1.59934670851632
-12.2026279929247
-4.92874800392352
2.85687357244646
0.619538752277748
8.74940552605733
4.6213976599548
-8.88636308974111
-18.1169959928739
-2.48140632094927
0.708475429144297
2.55398474530293
-9.23480050028489
13.2129685839998
0.343254456651376
10.0933110739437
14.2405099533029
-1.47477252162837
-10.1117981891958
1.50998224523256
-4.94929599792509
10.7864254829485
2.34371228045282
-0.515753055677401
7.105427357601e-15
12.7690904185083
-1.02750108965161
-28.1799477378103
16.0740153683589
11.1744235187430
-6.16088397116645
8.2555112598624
1.96550547897588
-3.68019420170376
-6.95764409693946
-4.09675759884099
-0.270366073271326
3.25423993046357
-20.124509512824
7.71491624837725

\begin{tabular}{lllllllll}
\hline
Estimated ARIMA Residuals \tabularnewline
Value \tabularnewline
0.0459599403275641 \tabularnewline
12.7270767679144 \tabularnewline
-0.935973881263207 \tabularnewline
2.16920460165144 \tabularnewline
7.4676055873992 \tabularnewline
1.03822890018206 \tabularnewline
-7.03681484417367 \tabularnewline
-4.48931984824276 \tabularnewline
-3.55126362517309 \tabularnewline
-16.0163611253472 \tabularnewline
12.9993711137552 \tabularnewline
3.40276443383408 \tabularnewline
16.0784610258093 \tabularnewline
-7.24698225458509 \tabularnewline
-5.81435764282502 \tabularnewline
-0.139522908742507 \tabularnewline
0.142899759951263 \tabularnewline
-30.3203325691106 \tabularnewline
18.5307909490984 \tabularnewline
-0.80456704383387 \tabularnewline
13.9463557884068 \tabularnewline
9.83222017573694 \tabularnewline
10.9095840064133 \tabularnewline
1.53368307061997 \tabularnewline
3.10111305163646 \tabularnewline
7.83445684747848 \tabularnewline
8.46318768042383 \tabularnewline
-2.71799332896597 \tabularnewline
2.72958799277542 \tabularnewline
8.29505600464307 \tabularnewline
-6.33695790017974 \tabularnewline
9.64713901977603 \tabularnewline
-19.960945328698 \tabularnewline
10.3207667287459 \tabularnewline
3.5365235877136 \tabularnewline
3.12562067753399 \tabularnewline
-6.83013005548482 \tabularnewline
-19.5913329657518 \tabularnewline
-6.36240694791964 \tabularnewline
-13.4874892893024 \tabularnewline
-2.23920610649139 \tabularnewline
3.9414685152991 \tabularnewline
0.586872442749907 \tabularnewline
-13.2850457552832 \tabularnewline
-14.6716387824942 \tabularnewline
-28.0862507429362 \tabularnewline
-11.9119747627383 \tabularnewline
22.6038579575610 \tabularnewline
25.0050243145883 \tabularnewline
9.01965156012275 \tabularnewline
3.48871524181365 \tabularnewline
-6.18488256078965 \tabularnewline
1.94137849663367 \tabularnewline
-2.37383232356312 \tabularnewline
-3.87143045774840 \tabularnewline
-6.60335599738107 \tabularnewline
-0.946521410580608 \tabularnewline
0.267269282587172 \tabularnewline
-3.01421741267956 \tabularnewline
-11.9969069384567 \tabularnewline
-4.58277463821604 \tabularnewline
-10.0131529322707 \tabularnewline
-11.7275344832779 \tabularnewline
13.6035386469865 \tabularnewline
8.23694724118036 \tabularnewline
-2.36901803107735 \tabularnewline
-8.0879430749945 \tabularnewline
3.66651068235172 \tabularnewline
17.5703747701661 \tabularnewline
-23.0344188450699 \tabularnewline
17.589279213828 \tabularnewline
5.10180639247264 \tabularnewline
7.88725241727943 \tabularnewline
7.74088886548304 \tabularnewline
-5.48721639201799 \tabularnewline
-4.36490217695379 \tabularnewline
-6.11830159478329 \tabularnewline
17.3330564180503 \tabularnewline
-8.92591724033687 \tabularnewline
3.12860355810896 \tabularnewline
1.59934670851632 \tabularnewline
-12.2026279929247 \tabularnewline
-4.92874800392352 \tabularnewline
2.85687357244646 \tabularnewline
0.619538752277748 \tabularnewline
8.74940552605733 \tabularnewline
4.6213976599548 \tabularnewline
-8.88636308974111 \tabularnewline
-18.1169959928739 \tabularnewline
-2.48140632094927 \tabularnewline
0.708475429144297 \tabularnewline
2.55398474530293 \tabularnewline
-9.23480050028489 \tabularnewline
13.2129685839998 \tabularnewline
0.343254456651376 \tabularnewline
10.0933110739437 \tabularnewline
14.2405099533029 \tabularnewline
-1.47477252162837 \tabularnewline
-10.1117981891958 \tabularnewline
1.50998224523256 \tabularnewline
-4.94929599792509 \tabularnewline
10.7864254829485 \tabularnewline
2.34371228045282 \tabularnewline
-0.515753055677401 \tabularnewline
7.105427357601e-15 \tabularnewline
12.7690904185083 \tabularnewline
-1.02750108965161 \tabularnewline
-28.1799477378103 \tabularnewline
16.0740153683589 \tabularnewline
11.1744235187430 \tabularnewline
-6.16088397116645 \tabularnewline
8.2555112598624 \tabularnewline
1.96550547897588 \tabularnewline
-3.68019420170376 \tabularnewline
-6.95764409693946 \tabularnewline
-4.09675759884099 \tabularnewline
-0.270366073271326 \tabularnewline
3.25423993046357 \tabularnewline
-20.124509512824 \tabularnewline
7.71491624837725 \tabularnewline
\hline
\end{tabular}
%Source: https://freestatistics.org/blog/index.php?pk=29983&T=2

[TABLE]
[ROW][C]Estimated ARIMA Residuals[/C][/ROW]
[ROW][C]Value[/C][/ROW]
[ROW][C]0.0459599403275641[/C][/ROW]
[ROW][C]12.7270767679144[/C][/ROW]
[ROW][C]-0.935973881263207[/C][/ROW]
[ROW][C]2.16920460165144[/C][/ROW]
[ROW][C]7.4676055873992[/C][/ROW]
[ROW][C]1.03822890018206[/C][/ROW]
[ROW][C]-7.03681484417367[/C][/ROW]
[ROW][C]-4.48931984824276[/C][/ROW]
[ROW][C]-3.55126362517309[/C][/ROW]
[ROW][C]-16.0163611253472[/C][/ROW]
[ROW][C]12.9993711137552[/C][/ROW]
[ROW][C]3.40276443383408[/C][/ROW]
[ROW][C]16.0784610258093[/C][/ROW]
[ROW][C]-7.24698225458509[/C][/ROW]
[ROW][C]-5.81435764282502[/C][/ROW]
[ROW][C]-0.139522908742507[/C][/ROW]
[ROW][C]0.142899759951263[/C][/ROW]
[ROW][C]-30.3203325691106[/C][/ROW]
[ROW][C]18.5307909490984[/C][/ROW]
[ROW][C]-0.80456704383387[/C][/ROW]
[ROW][C]13.9463557884068[/C][/ROW]
[ROW][C]9.83222017573694[/C][/ROW]
[ROW][C]10.9095840064133[/C][/ROW]
[ROW][C]1.53368307061997[/C][/ROW]
[ROW][C]3.10111305163646[/C][/ROW]
[ROW][C]7.83445684747848[/C][/ROW]
[ROW][C]8.46318768042383[/C][/ROW]
[ROW][C]-2.71799332896597[/C][/ROW]
[ROW][C]2.72958799277542[/C][/ROW]
[ROW][C]8.29505600464307[/C][/ROW]
[ROW][C]-6.33695790017974[/C][/ROW]
[ROW][C]9.64713901977603[/C][/ROW]
[ROW][C]-19.960945328698[/C][/ROW]
[ROW][C]10.3207667287459[/C][/ROW]
[ROW][C]3.5365235877136[/C][/ROW]
[ROW][C]3.12562067753399[/C][/ROW]
[ROW][C]-6.83013005548482[/C][/ROW]
[ROW][C]-19.5913329657518[/C][/ROW]
[ROW][C]-6.36240694791964[/C][/ROW]
[ROW][C]-13.4874892893024[/C][/ROW]
[ROW][C]-2.23920610649139[/C][/ROW]
[ROW][C]3.9414685152991[/C][/ROW]
[ROW][C]0.586872442749907[/C][/ROW]
[ROW][C]-13.2850457552832[/C][/ROW]
[ROW][C]-14.6716387824942[/C][/ROW]
[ROW][C]-28.0862507429362[/C][/ROW]
[ROW][C]-11.9119747627383[/C][/ROW]
[ROW][C]22.6038579575610[/C][/ROW]
[ROW][C]25.0050243145883[/C][/ROW]
[ROW][C]9.01965156012275[/C][/ROW]
[ROW][C]3.48871524181365[/C][/ROW]
[ROW][C]-6.18488256078965[/C][/ROW]
[ROW][C]1.94137849663367[/C][/ROW]
[ROW][C]-2.37383232356312[/C][/ROW]
[ROW][C]-3.87143045774840[/C][/ROW]
[ROW][C]-6.60335599738107[/C][/ROW]
[ROW][C]-0.946521410580608[/C][/ROW]
[ROW][C]0.267269282587172[/C][/ROW]
[ROW][C]-3.01421741267956[/C][/ROW]
[ROW][C]-11.9969069384567[/C][/ROW]
[ROW][C]-4.58277463821604[/C][/ROW]
[ROW][C]-10.0131529322707[/C][/ROW]
[ROW][C]-11.7275344832779[/C][/ROW]
[ROW][C]13.6035386469865[/C][/ROW]
[ROW][C]8.23694724118036[/C][/ROW]
[ROW][C]-2.36901803107735[/C][/ROW]
[ROW][C]-8.0879430749945[/C][/ROW]
[ROW][C]3.66651068235172[/C][/ROW]
[ROW][C]17.5703747701661[/C][/ROW]
[ROW][C]-23.0344188450699[/C][/ROW]
[ROW][C]17.589279213828[/C][/ROW]
[ROW][C]5.10180639247264[/C][/ROW]
[ROW][C]7.88725241727943[/C][/ROW]
[ROW][C]7.74088886548304[/C][/ROW]
[ROW][C]-5.48721639201799[/C][/ROW]
[ROW][C]-4.36490217695379[/C][/ROW]
[ROW][C]-6.11830159478329[/C][/ROW]
[ROW][C]17.3330564180503[/C][/ROW]
[ROW][C]-8.92591724033687[/C][/ROW]
[ROW][C]3.12860355810896[/C][/ROW]
[ROW][C]1.59934670851632[/C][/ROW]
[ROW][C]-12.2026279929247[/C][/ROW]
[ROW][C]-4.92874800392352[/C][/ROW]
[ROW][C]2.85687357244646[/C][/ROW]
[ROW][C]0.619538752277748[/C][/ROW]
[ROW][C]8.74940552605733[/C][/ROW]
[ROW][C]4.6213976599548[/C][/ROW]
[ROW][C]-8.88636308974111[/C][/ROW]
[ROW][C]-18.1169959928739[/C][/ROW]
[ROW][C]-2.48140632094927[/C][/ROW]
[ROW][C]0.708475429144297[/C][/ROW]
[ROW][C]2.55398474530293[/C][/ROW]
[ROW][C]-9.23480050028489[/C][/ROW]
[ROW][C]13.2129685839998[/C][/ROW]
[ROW][C]0.343254456651376[/C][/ROW]
[ROW][C]10.0933110739437[/C][/ROW]
[ROW][C]14.2405099533029[/C][/ROW]
[ROW][C]-1.47477252162837[/C][/ROW]
[ROW][C]-10.1117981891958[/C][/ROW]
[ROW][C]1.50998224523256[/C][/ROW]
[ROW][C]-4.94929599792509[/C][/ROW]
[ROW][C]10.7864254829485[/C][/ROW]
[ROW][C]2.34371228045282[/C][/ROW]
[ROW][C]-0.515753055677401[/C][/ROW]
[ROW][C]7.105427357601e-15[/C][/ROW]
[ROW][C]12.7690904185083[/C][/ROW]
[ROW][C]-1.02750108965161[/C][/ROW]
[ROW][C]-28.1799477378103[/C][/ROW]
[ROW][C]16.0740153683589[/C][/ROW]
[ROW][C]11.1744235187430[/C][/ROW]
[ROW][C]-6.16088397116645[/C][/ROW]
[ROW][C]8.2555112598624[/C][/ROW]
[ROW][C]1.96550547897588[/C][/ROW]
[ROW][C]-3.68019420170376[/C][/ROW]
[ROW][C]-6.95764409693946[/C][/ROW]
[ROW][C]-4.09675759884099[/C][/ROW]
[ROW][C]-0.270366073271326[/C][/ROW]
[ROW][C]3.25423993046357[/C][/ROW]
[ROW][C]-20.124509512824[/C][/ROW]
[ROW][C]7.71491624837725[/C][/ROW]
[/TABLE]
Source: https://freestatistics.org/blog/index.php?pk=29983&T=2

Globally Unique Identifier (entire table): ba.freestatistics.org/blog/index.php?pk=29983&T=2

As an alternative you can also use a QR Code:  

The GUIDs for individual cells are displayed in the table below:

Estimated ARIMA Residuals
Value
0.0459599403275641
12.7270767679144
-0.935973881263207
2.16920460165144
7.4676055873992
1.03822890018206
-7.03681484417367
-4.48931984824276
-3.55126362517309
-16.0163611253472
12.9993711137552
3.40276443383408
16.0784610258093
-7.24698225458509
-5.81435764282502
-0.139522908742507
0.142899759951263
-30.3203325691106
18.5307909490984
-0.80456704383387
13.9463557884068
9.83222017573694
10.9095840064133
1.53368307061997
3.10111305163646
7.83445684747848
8.46318768042383
-2.71799332896597
2.72958799277542
8.29505600464307
-6.33695790017974
9.64713901977603
-19.960945328698
10.3207667287459
3.5365235877136
3.12562067753399
-6.83013005548482
-19.5913329657518
-6.36240694791964
-13.4874892893024
-2.23920610649139
3.9414685152991
0.586872442749907
-13.2850457552832
-14.6716387824942
-28.0862507429362
-11.9119747627383
22.6038579575610
25.0050243145883
9.01965156012275
3.48871524181365
-6.18488256078965
1.94137849663367
-2.37383232356312
-3.87143045774840
-6.60335599738107
-0.946521410580608
0.267269282587172
-3.01421741267956
-11.9969069384567
-4.58277463821604
-10.0131529322707
-11.7275344832779
13.6035386469865
8.23694724118036
-2.36901803107735
-8.0879430749945
3.66651068235172
17.5703747701661
-23.0344188450699
17.589279213828
5.10180639247264
7.88725241727943
7.74088886548304
-5.48721639201799
-4.36490217695379
-6.11830159478329
17.3330564180503
-8.92591724033687
3.12860355810896
1.59934670851632
-12.2026279929247
-4.92874800392352
2.85687357244646
0.619538752277748
8.74940552605733
4.6213976599548
-8.88636308974111
-18.1169959928739
-2.48140632094927
0.708475429144297
2.55398474530293
-9.23480050028489
13.2129685839998
0.343254456651376
10.0933110739437
14.2405099533029
-1.47477252162837
-10.1117981891958
1.50998224523256
-4.94929599792509
10.7864254829485
2.34371228045282
-0.515753055677401
7.105427357601e-15
12.7690904185083
-1.02750108965161
-28.1799477378103
16.0740153683589
11.1744235187430
-6.16088397116645
8.2555112598624
1.96550547897588
-3.68019420170376
-6.95764409693946
-4.09675759884099
-0.270366073271326
3.25423993046357
-20.124509512824
7.71491624837725


Parameters (Session):
par1 = FALSE ; par2 = 1.3 ; par3 = 1 ; par4 = 0 ; par5 = 12 ; par6 = 2 ; par7 = 0 ; par8 = 0 ; par9 = 0 ;
Parameters (R input):
par1 = FALSE ; par2 = 1.3 ; par3 = 1 ; par4 = 0 ; par5 = 12 ; par6 = 2 ; par7 = 0 ; par8 = 0 ; par9 = 0 ;
R code (references can be found in the software module):
library(lattice)
if (par1 == 'TRUE') par1 <- TRUE
if (par1 == 'FALSE') par1 <- FALSE
par2 <- as.numeric(par2) #Box-Cox lambda transformation parameter
par3 <- as.numeric(par3) #degree of non-seasonal differencing
par4 <- as.numeric(par4) #degree of seasonal differencing
par5 <- as.numeric(par5) #seasonal period
par6 <- as.numeric(par6) #degree (p) of the non-seasonal AR(p) polynomial
par7 <- as.numeric(par7) #degree (q) of the non-seasonal MA(q) polynomial
par8 <- as.numeric(par8) #degree (P) of the seasonal AR(P) polynomial
par9 <- as.numeric(par9) #degree (Q) of the seasonal MA(Q) polynomial
armaGR <- function(arima.out, names, n){
try1 <- arima.out$coef
try2 <- sqrt(diag(arima.out$var.coef))
try.data.frame <- data.frame(matrix(NA,ncol=4,nrow=length(names)))
dimnames(try.data.frame) <- list(names,c('coef','std','tstat','pv'))
try.data.frame[,1] <- try1
for(i in 1:length(try2)) try.data.frame[which(rownames(try.data.frame)==names(try2)[i]),2] <- try2[i]
try.data.frame[,3] <- try.data.frame[,1] / try.data.frame[,2]
try.data.frame[,4] <- round((1-pt(abs(try.data.frame[,3]),df=n-(length(try2)+1)))*2,5)
vector <- rep(NA,length(names))
vector[is.na(try.data.frame[,4])] <- 0
maxi <- which.max(try.data.frame[,4])
continue <- max(try.data.frame[,4],na.rm=TRUE) > .05
vector[maxi] <- 0
list(summary=try.data.frame,next.vector=vector,continue=continue)
}
arimaSelect <- function(series, order=c(13,0,0), seasonal=list(order=c(2,0,0),period=12), include.mean=F){
nrc <- order[1]+order[3]+seasonal$order[1]+seasonal$order[3]
coeff <- matrix(NA, nrow=nrc*2, ncol=nrc)
pval <- matrix(NA, nrow=nrc*2, ncol=nrc)
mylist <- rep(list(NULL), nrc)
names <- NULL
if(order[1] > 0) names <- paste('ar',1:order[1],sep='')
if(order[3] > 0) names <- c( names , paste('ma',1:order[3],sep='') )
if(seasonal$order[1] > 0) names <- c(names, paste('sar',1:seasonal$order[1],sep=''))
if(seasonal$order[3] > 0) names <- c(names, paste('sma',1:seasonal$order[3],sep=''))
arima.out <- arima(series, order=order, seasonal=seasonal, include.mean=include.mean, method='ML')
mylist[[1]] <- arima.out
last.arma <- armaGR(arima.out, names, length(series))
mystop <- FALSE
i <- 1
coeff[i,] <- last.arma[[1]][,1]
pval [i,] <- last.arma[[1]][,4]
i <- 2
aic <- arima.out$aic
while(!mystop){
mylist[[i]] <- arima.out
arima.out <- arima(series, order=order, seasonal=seasonal, include.mean=include.mean, method='ML', fixed=last.arma$next.vector)
aic <- c(aic, arima.out$aic)
last.arma <- armaGR(arima.out, names, length(series))
mystop <- !last.arma$continue
coeff[i,] <- last.arma[[1]][,1]
pval [i,] <- last.arma[[1]][,4]
i <- i+1
}
list(coeff, pval, mylist, aic=aic)
}
arimaSelectplot <- function(arimaSelect.out,noms,choix){
noms <- names(arimaSelect.out[[3]][[1]]$coef)
coeff <- arimaSelect.out[[1]]
k <- min(which(is.na(coeff[,1])))-1
coeff <- coeff[1:k,]
pval <- arimaSelect.out[[2]][1:k,]
aic <- arimaSelect.out$aic[1:k]
coeff[coeff==0] <- NA
n <- ncol(coeff)
if(missing(choix)) choix <- k
layout(matrix(c(1,1,1,2,
3,3,3,2,
3,3,3,4,
5,6,7,7),nr=4),
widths=c(10,35,45,15),
heights=c(30,30,15,15))
couleurs <- rainbow(75)[1:50]#(50)
ticks <- pretty(coeff)
par(mar=c(1,1,3,1))
plot(aic,k:1-.5,type='o',pch=21,bg='blue',cex=2,axes=F,lty=2,xpd=NA)
points(aic[choix],k-choix+.5,pch=21,cex=4,bg=2,xpd=NA)
title('aic',line=2)
par(mar=c(3,0,0,0))
plot(0,axes=F,xlab='',ylab='',xlim=range(ticks),ylim=c(.1,1))
rect(xleft = min(ticks) + (0:49)/50*(max(ticks)-min(ticks)),
xright = min(ticks) + (1:50)/50*(max(ticks)-min(ticks)),
ytop = rep(1,50),
ybottom= rep(0,50),col=couleurs,border=NA)
axis(1,ticks)
rect(xleft=min(ticks),xright=max(ticks),ytop=1,ybottom=0)
text(mean(coeff,na.rm=T),.5,'coefficients',cex=2,font=2)
par(mar=c(1,1,3,1))
image(1:n,1:k,t(coeff[k:1,]),axes=F,col=couleurs,zlim=range(ticks))
for(i in 1:n) for(j in 1:k) if(!is.na(coeff[j,i])) {
if(pval[j,i]<.01) symb = 'green'
else if( (pval[j,i]<.05) & (pval[j,i]>=.01)) symb = 'orange'
else if( (pval[j,i]<.1) & (pval[j,i]>=.05)) symb = 'red'
else symb = 'black'
polygon(c(i+.5 ,i+.2 ,i+.5 ,i+.5),
c(k-j+0.5,k-j+0.5,k-j+0.8,k-j+0.5),
col=symb)
if(j==choix) {
rect(xleft=i-.5,
xright=i+.5,
ybottom=k-j+1.5,
ytop=k-j+.5,
lwd=4)
text(i,
k-j+1,
round(coeff[j,i],2),
cex=1.2,
font=2)
}
else{
rect(xleft=i-.5,xright=i+.5,ybottom=k-j+1.5,ytop=k-j+.5)
text(i,k-j+1,round(coeff[j,i],2),cex=1.2,font=1)
}
}
axis(3,1:n,noms)
par(mar=c(0.5,0,0,0.5))
plot(0,axes=F,xlab='',ylab='',type='n',xlim=c(0,8),ylim=c(-.2,.8))
cols <- c('green','orange','red','black')
niv <- c('0','0.01','0.05','0.1')
for(i in 0:3){
polygon(c(1+2*i ,1+2*i ,1+2*i-.5 ,1+2*i),
c(.4 ,.7 , .4 , .4),
col=cols[i+1])
text(2*i,0.5,niv[i+1],cex=1.5)
}
text(8,.5,1,cex=1.5)
text(4,0,'p-value',cex=2)
box()
residus <- arimaSelect.out[[3]][[choix]]$res
par(mar=c(1,2,4,1))
acf(residus,main='')
title('acf',line=.5)
par(mar=c(1,2,4,1))
pacf(residus,main='')
title('pacf',line=.5)
par(mar=c(2,2,4,1))
qqnorm(residus,main='')
title('qq-norm',line=.5)
qqline(residus)
residus
}
if (par2 == 0) x <- log(x)
if (par2 != 0) x <- x^par2
(selection <- arimaSelect(x, order=c(par6,par3,par7), seasonal=list(order=c(par8,par4,par9), period=par5)))
bitmap(file='test1.png')
resid <- arimaSelectplot(selection)
dev.off()
resid
bitmap(file='test2.png')
acf(resid,length(resid)/2, main='Residual Autocorrelation Function')
dev.off()
bitmap(file='test3.png')
pacf(resid,length(resid)/2, main='Residual Partial Autocorrelation Function')
dev.off()
bitmap(file='test4.png')
cpgram(resid, main='Residual Cumulative Periodogram')
dev.off()
bitmap(file='test5.png')
hist(resid, main='Residual Histogram', xlab='values of Residuals')
dev.off()
bitmap(file='test6.png')
densityplot(~resid,col='black',main='Residual Density Plot', xlab='values of Residuals')
dev.off()
bitmap(file='test7.png')
qqnorm(resid, main='Residual Normal Q-Q Plot')
qqline(resid)
dev.off()
ncols <- length(selection[[1]][1,])
nrows <- length(selection[[2]][,1])-1
load(file='createtable')
a<-table.start()
a<-table.row.start(a)
a<-table.element(a,'ARIMA Parameter Estimation and Backward Selection', ncols+1,TRUE)
a<-table.row.end(a)
a<-table.row.start(a)
a<-table.element(a,'Iteration', header=TRUE)
for (i in 1:ncols) {
a<-table.element(a,names(selection[[3]][[1]]$coef)[i],header=TRUE)
}
a<-table.row.end(a)
for (j in 1:nrows) {
a<-table.row.start(a)
mydum <- 'Estimates ('
mydum <- paste(mydum,j)
mydum <- paste(mydum,')')
a<-table.element(a,mydum, header=TRUE)
for (i in 1:ncols) {
a<-table.element(a,round(selection[[1]][j,i],4))
}
a<-table.row.end(a)
a<-table.row.start(a)
a<-table.element(a,'(p-val)', header=TRUE)
for (i in 1:ncols) {
mydum <- '('
mydum <- paste(mydum,round(selection[[2]][j,i],4),sep='')
mydum <- paste(mydum,')')
a<-table.element(a,mydum)
}
a<-table.row.end(a)
}
a<-table.end(a)
table.save(a,file='mytable.tab')
a<-table.start()
a<-table.row.start(a)
a<-table.element(a,'Estimated ARIMA Residuals', 1,TRUE)
a<-table.row.end(a)
a<-table.row.start(a)
a<-table.element(a,'Value', 1,TRUE)
a<-table.row.end(a)
for (i in (par4*par5+par3):length(resid)) {
a<-table.row.start(a)
a<-table.element(a,resid[i])
a<-table.row.end(a)
}
a<-table.end(a)
table.save(a,file='mytable1.tab')