Free Statistics

of Irreproducible Research!

Author's title

Author*Unverified author*
R Software Modulerwasp_autocorrelation.wasp
Title produced by software(Partial) Autocorrelation Function
Date of computationSun, 07 Dec 2008 06:39:11 -0700
Cite this page as followsStatistical Computations at FreeStatistics.org, Office for Research Development and Education, URL https://freestatistics.org/blog/index.php?v=date/2008/Dec/07/t1228657228mlhe53zim6g27og.htm/, Retrieved Sun, 19 May 2024 10:42:23 +0000
Statistical Computations at FreeStatistics.org, Office for Research Development and Education, URL https://freestatistics.org/blog/index.php?pk=29974, Retrieved Sun, 19 May 2024 10:42:23 +0000
QR Codes:

Original text written by user:
IsPrivate?No (this computation is public)
User-defined keywords
Estimated Impact163
Family? (F = Feedback message, R = changed R code, M = changed R Module, P = changed Parameters, D = changed Data)
F       [(Partial) Autocorrelation Function] [] [2008-12-07 13:39:11] [d41d8cd98f00b204e9800998ecf8427e] [Current]
Feedback Forum
2008-12-16 15:34:06 [Peter Van Doninck] [reply
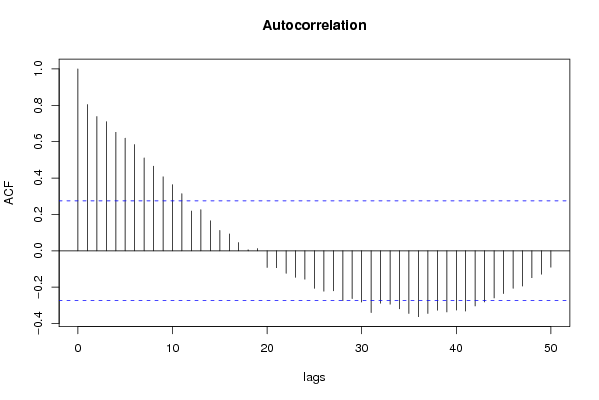
eigenlijk dienen we lambda nog niet gelijk te stellen aan de gevonden waarde. Toch maakt het hier niet echt zoveel uit. We stellen hier inderdaad een dalend verloop vast, geen sezoenaliteit.

Post a new message
Dataseries X:
132.7
128.6
127.8
128.9
124.6
129.2
130.5
124.3
125.8
123.5
120.7
123.1
122.0
121.0
121.2
117.4
113.0
113.1
116.1
121.3
108.6
114.3
113.5
111.2
109.3
108.2
102.7
110.4
108.1
112.8
108.1
102.6
109.2
108.2
107.1
108.4
103.6
104.0
111.5
105.4
105.5
101.3
103.8
100.3
108.2
105.6
103.0
100.5
104.3
99.1
91.5


Summary of computational transaction
Raw Inputview raw input (R code)
Raw Outputview raw output of R engine
Computing time1 seconds
R Server'Gwilym Jenkins' @ 72.249.127.135

\begin{tabular}{lllllllll}
\hline
Summary of computational transaction \tabularnewline
Raw Input & view raw input (R code)  \tabularnewline
Raw Output & view raw output of R engine  \tabularnewline
Computing time & 1 seconds \tabularnewline
R Server & 'Gwilym Jenkins' @ 72.249.127.135 \tabularnewline
\hline
\end{tabular}
%Source: https://freestatistics.org/blog/index.php?pk=29974&T=0

[TABLE]
[ROW][C]Summary of computational transaction[/C][/ROW]
[ROW][C]Raw Input[/C][C]view raw input (R code) [/C][/ROW]
[ROW][C]Raw Output[/C][C]view raw output of R engine [/C][/ROW]
[ROW][C]Computing time[/C][C]1 seconds[/C][/ROW]
[ROW][C]R Server[/C][C]'Gwilym Jenkins' @ 72.249.127.135[/C][/ROW]
[/TABLE]
Source: https://freestatistics.org/blog/index.php?pk=29974&T=0

Globally Unique Identifier (entire table): ba.freestatistics.org/blog/index.php?pk=29974&T=0

As an alternative you can also use a QR Code:  

The GUIDs for individual cells are displayed in the table below:

Summary of computational transaction
Raw Inputview raw input (R code)
Raw Outputview raw output of R engine
Computing time1 seconds
R Server'Gwilym Jenkins' @ 72.249.127.135


Autocorrelation Function
Time lag kACF(k)T-STATP-value
10.8044715.74510
20.7382425.27211e-06
30.7100965.07113e-06
40.6513194.65131.2e-05
50.619484.4242.6e-05
60.5839634.17035.9e-05
70.5102653.6440.000314
80.464973.32050.000833
90.4069512.90620.0027
100.363432.59540.006154
110.3138172.24110.0147
120.2186911.56180.062264
130.225651.61150.056625
140.1645971.17550.122635
150.1116970.79770.214378
160.0923730.65970.256216
170.0449650.32110.374719
180.0051470.03680.48541
190.01190.0850.466303
20-0.091769-0.65540.257591
21-0.093305-0.66630.2541
22-0.123905-0.88490.190192
23-0.145988-1.04260.151033
24-0.156187-1.11540.134954
25-0.206513-1.47480.073207
26-0.22194-1.5850.059577
27-0.22035-1.57360.06088
28-0.274874-1.9630.027556
29-0.263034-1.87840.033021
30-0.281804-2.01250.024732
31-0.340031-2.42830.009368
32-0.288448-2.05990.022263
33-0.293477-2.09580.020539
34-0.319412-2.28110.013377
35-0.344581-2.46080.008644
36-0.362315-2.58740.006281
37-0.344751-2.4620.008618
38-0.326853-2.33420.011781
39-0.33618-2.40080.010022
40-0.326294-2.33020.011895
41-0.331575-2.36790.010859
42-0.303267-2.16580.017515
43-0.281578-2.01090.02482
44-0.259583-1.85380.034778
45-0.235524-1.6820.049344
46-0.206652-1.47580.073074
47-0.194239-1.38710.085715
48-0.14827-1.05890.147326
49-0.128926-0.92070.180766
50-0.090399-0.64560.260723
51NANANA
52NANANA
53NANANA
54NANANA
55NANANA
56NANANA
57NANANA
58NANANA
59NANANA
60NANANA

\begin{tabular}{lllllllll}
\hline
Autocorrelation Function \tabularnewline
Time lag k & ACF(k) & T-STAT & P-value \tabularnewline
1 & 0.804471 & 5.7451 & 0 \tabularnewline
2 & 0.738242 & 5.2721 & 1e-06 \tabularnewline
3 & 0.710096 & 5.0711 & 3e-06 \tabularnewline
4 & 0.651319 & 4.6513 & 1.2e-05 \tabularnewline
5 & 0.61948 & 4.424 & 2.6e-05 \tabularnewline
6 & 0.583963 & 4.1703 & 5.9e-05 \tabularnewline
7 & 0.510265 & 3.644 & 0.000314 \tabularnewline
8 & 0.46497 & 3.3205 & 0.000833 \tabularnewline
9 & 0.406951 & 2.9062 & 0.0027 \tabularnewline
10 & 0.36343 & 2.5954 & 0.006154 \tabularnewline
11 & 0.313817 & 2.2411 & 0.0147 \tabularnewline
12 & 0.218691 & 1.5618 & 0.062264 \tabularnewline
13 & 0.22565 & 1.6115 & 0.056625 \tabularnewline
14 & 0.164597 & 1.1755 & 0.122635 \tabularnewline
15 & 0.111697 & 0.7977 & 0.214378 \tabularnewline
16 & 0.092373 & 0.6597 & 0.256216 \tabularnewline
17 & 0.044965 & 0.3211 & 0.374719 \tabularnewline
18 & 0.005147 & 0.0368 & 0.48541 \tabularnewline
19 & 0.0119 & 0.085 & 0.466303 \tabularnewline
20 & -0.091769 & -0.6554 & 0.257591 \tabularnewline
21 & -0.093305 & -0.6663 & 0.2541 \tabularnewline
22 & -0.123905 & -0.8849 & 0.190192 \tabularnewline
23 & -0.145988 & -1.0426 & 0.151033 \tabularnewline
24 & -0.156187 & -1.1154 & 0.134954 \tabularnewline
25 & -0.206513 & -1.4748 & 0.073207 \tabularnewline
26 & -0.22194 & -1.585 & 0.059577 \tabularnewline
27 & -0.22035 & -1.5736 & 0.06088 \tabularnewline
28 & -0.274874 & -1.963 & 0.027556 \tabularnewline
29 & -0.263034 & -1.8784 & 0.033021 \tabularnewline
30 & -0.281804 & -2.0125 & 0.024732 \tabularnewline
31 & -0.340031 & -2.4283 & 0.009368 \tabularnewline
32 & -0.288448 & -2.0599 & 0.022263 \tabularnewline
33 & -0.293477 & -2.0958 & 0.020539 \tabularnewline
34 & -0.319412 & -2.2811 & 0.013377 \tabularnewline
35 & -0.344581 & -2.4608 & 0.008644 \tabularnewline
36 & -0.362315 & -2.5874 & 0.006281 \tabularnewline
37 & -0.344751 & -2.462 & 0.008618 \tabularnewline
38 & -0.326853 & -2.3342 & 0.011781 \tabularnewline
39 & -0.33618 & -2.4008 & 0.010022 \tabularnewline
40 & -0.326294 & -2.3302 & 0.011895 \tabularnewline
41 & -0.331575 & -2.3679 & 0.010859 \tabularnewline
42 & -0.303267 & -2.1658 & 0.017515 \tabularnewline
43 & -0.281578 & -2.0109 & 0.02482 \tabularnewline
44 & -0.259583 & -1.8538 & 0.034778 \tabularnewline
45 & -0.235524 & -1.682 & 0.049344 \tabularnewline
46 & -0.206652 & -1.4758 & 0.073074 \tabularnewline
47 & -0.194239 & -1.3871 & 0.085715 \tabularnewline
48 & -0.14827 & -1.0589 & 0.147326 \tabularnewline
49 & -0.128926 & -0.9207 & 0.180766 \tabularnewline
50 & -0.090399 & -0.6456 & 0.260723 \tabularnewline
51 & NA & NA & NA \tabularnewline
52 & NA & NA & NA \tabularnewline
53 & NA & NA & NA \tabularnewline
54 & NA & NA & NA \tabularnewline
55 & NA & NA & NA \tabularnewline
56 & NA & NA & NA \tabularnewline
57 & NA & NA & NA \tabularnewline
58 & NA & NA & NA \tabularnewline
59 & NA & NA & NA \tabularnewline
60 & NA & NA & NA \tabularnewline
\hline
\end{tabular}
%Source: https://freestatistics.org/blog/index.php?pk=29974&T=1

[TABLE]
[ROW][C]Autocorrelation Function[/C][/ROW]
[ROW][C]Time lag k[/C][C]ACF(k)[/C][C]T-STAT[/C][C]P-value[/C][/ROW]
[ROW][C]1[/C][C]0.804471[/C][C]5.7451[/C][C]0[/C][/ROW]
[ROW][C]2[/C][C]0.738242[/C][C]5.2721[/C][C]1e-06[/C][/ROW]
[ROW][C]3[/C][C]0.710096[/C][C]5.0711[/C][C]3e-06[/C][/ROW]
[ROW][C]4[/C][C]0.651319[/C][C]4.6513[/C][C]1.2e-05[/C][/ROW]
[ROW][C]5[/C][C]0.61948[/C][C]4.424[/C][C]2.6e-05[/C][/ROW]
[ROW][C]6[/C][C]0.583963[/C][C]4.1703[/C][C]5.9e-05[/C][/ROW]
[ROW][C]7[/C][C]0.510265[/C][C]3.644[/C][C]0.000314[/C][/ROW]
[ROW][C]8[/C][C]0.46497[/C][C]3.3205[/C][C]0.000833[/C][/ROW]
[ROW][C]9[/C][C]0.406951[/C][C]2.9062[/C][C]0.0027[/C][/ROW]
[ROW][C]10[/C][C]0.36343[/C][C]2.5954[/C][C]0.006154[/C][/ROW]
[ROW][C]11[/C][C]0.313817[/C][C]2.2411[/C][C]0.0147[/C][/ROW]
[ROW][C]12[/C][C]0.218691[/C][C]1.5618[/C][C]0.062264[/C][/ROW]
[ROW][C]13[/C][C]0.22565[/C][C]1.6115[/C][C]0.056625[/C][/ROW]
[ROW][C]14[/C][C]0.164597[/C][C]1.1755[/C][C]0.122635[/C][/ROW]
[ROW][C]15[/C][C]0.111697[/C][C]0.7977[/C][C]0.214378[/C][/ROW]
[ROW][C]16[/C][C]0.092373[/C][C]0.6597[/C][C]0.256216[/C][/ROW]
[ROW][C]17[/C][C]0.044965[/C][C]0.3211[/C][C]0.374719[/C][/ROW]
[ROW][C]18[/C][C]0.005147[/C][C]0.0368[/C][C]0.48541[/C][/ROW]
[ROW][C]19[/C][C]0.0119[/C][C]0.085[/C][C]0.466303[/C][/ROW]
[ROW][C]20[/C][C]-0.091769[/C][C]-0.6554[/C][C]0.257591[/C][/ROW]
[ROW][C]21[/C][C]-0.093305[/C][C]-0.6663[/C][C]0.2541[/C][/ROW]
[ROW][C]22[/C][C]-0.123905[/C][C]-0.8849[/C][C]0.190192[/C][/ROW]
[ROW][C]23[/C][C]-0.145988[/C][C]-1.0426[/C][C]0.151033[/C][/ROW]
[ROW][C]24[/C][C]-0.156187[/C][C]-1.1154[/C][C]0.134954[/C][/ROW]
[ROW][C]25[/C][C]-0.206513[/C][C]-1.4748[/C][C]0.073207[/C][/ROW]
[ROW][C]26[/C][C]-0.22194[/C][C]-1.585[/C][C]0.059577[/C][/ROW]
[ROW][C]27[/C][C]-0.22035[/C][C]-1.5736[/C][C]0.06088[/C][/ROW]
[ROW][C]28[/C][C]-0.274874[/C][C]-1.963[/C][C]0.027556[/C][/ROW]
[ROW][C]29[/C][C]-0.263034[/C][C]-1.8784[/C][C]0.033021[/C][/ROW]
[ROW][C]30[/C][C]-0.281804[/C][C]-2.0125[/C][C]0.024732[/C][/ROW]
[ROW][C]31[/C][C]-0.340031[/C][C]-2.4283[/C][C]0.009368[/C][/ROW]
[ROW][C]32[/C][C]-0.288448[/C][C]-2.0599[/C][C]0.022263[/C][/ROW]
[ROW][C]33[/C][C]-0.293477[/C][C]-2.0958[/C][C]0.020539[/C][/ROW]
[ROW][C]34[/C][C]-0.319412[/C][C]-2.2811[/C][C]0.013377[/C][/ROW]
[ROW][C]35[/C][C]-0.344581[/C][C]-2.4608[/C][C]0.008644[/C][/ROW]
[ROW][C]36[/C][C]-0.362315[/C][C]-2.5874[/C][C]0.006281[/C][/ROW]
[ROW][C]37[/C][C]-0.344751[/C][C]-2.462[/C][C]0.008618[/C][/ROW]
[ROW][C]38[/C][C]-0.326853[/C][C]-2.3342[/C][C]0.011781[/C][/ROW]
[ROW][C]39[/C][C]-0.33618[/C][C]-2.4008[/C][C]0.010022[/C][/ROW]
[ROW][C]40[/C][C]-0.326294[/C][C]-2.3302[/C][C]0.011895[/C][/ROW]
[ROW][C]41[/C][C]-0.331575[/C][C]-2.3679[/C][C]0.010859[/C][/ROW]
[ROW][C]42[/C][C]-0.303267[/C][C]-2.1658[/C][C]0.017515[/C][/ROW]
[ROW][C]43[/C][C]-0.281578[/C][C]-2.0109[/C][C]0.02482[/C][/ROW]
[ROW][C]44[/C][C]-0.259583[/C][C]-1.8538[/C][C]0.034778[/C][/ROW]
[ROW][C]45[/C][C]-0.235524[/C][C]-1.682[/C][C]0.049344[/C][/ROW]
[ROW][C]46[/C][C]-0.206652[/C][C]-1.4758[/C][C]0.073074[/C][/ROW]
[ROW][C]47[/C][C]-0.194239[/C][C]-1.3871[/C][C]0.085715[/C][/ROW]
[ROW][C]48[/C][C]-0.14827[/C][C]-1.0589[/C][C]0.147326[/C][/ROW]
[ROW][C]49[/C][C]-0.128926[/C][C]-0.9207[/C][C]0.180766[/C][/ROW]
[ROW][C]50[/C][C]-0.090399[/C][C]-0.6456[/C][C]0.260723[/C][/ROW]
[ROW][C]51[/C][C]NA[/C][C]NA[/C][C]NA[/C][/ROW]
[ROW][C]52[/C][C]NA[/C][C]NA[/C][C]NA[/C][/ROW]
[ROW][C]53[/C][C]NA[/C][C]NA[/C][C]NA[/C][/ROW]
[ROW][C]54[/C][C]NA[/C][C]NA[/C][C]NA[/C][/ROW]
[ROW][C]55[/C][C]NA[/C][C]NA[/C][C]NA[/C][/ROW]
[ROW][C]56[/C][C]NA[/C][C]NA[/C][C]NA[/C][/ROW]
[ROW][C]57[/C][C]NA[/C][C]NA[/C][C]NA[/C][/ROW]
[ROW][C]58[/C][C]NA[/C][C]NA[/C][C]NA[/C][/ROW]
[ROW][C]59[/C][C]NA[/C][C]NA[/C][C]NA[/C][/ROW]
[ROW][C]60[/C][C]NA[/C][C]NA[/C][C]NA[/C][/ROW]
[/TABLE]
Source: https://freestatistics.org/blog/index.php?pk=29974&T=1

Globally Unique Identifier (entire table): ba.freestatistics.org/blog/index.php?pk=29974&T=1

As an alternative you can also use a QR Code:  

The GUIDs for individual cells are displayed in the table below:

Autocorrelation Function
Time lag kACF(k)T-STATP-value
10.8044715.74510
20.7382425.27211e-06
30.7100965.07113e-06
40.6513194.65131.2e-05
50.619484.4242.6e-05
60.5839634.17035.9e-05
70.5102653.6440.000314
80.464973.32050.000833
90.4069512.90620.0027
100.363432.59540.006154
110.3138172.24110.0147
120.2186911.56180.062264
130.225651.61150.056625
140.1645971.17550.122635
150.1116970.79770.214378
160.0923730.65970.256216
170.0449650.32110.374719
180.0051470.03680.48541
190.01190.0850.466303
20-0.091769-0.65540.257591
21-0.093305-0.66630.2541
22-0.123905-0.88490.190192
23-0.145988-1.04260.151033
24-0.156187-1.11540.134954
25-0.206513-1.47480.073207
26-0.22194-1.5850.059577
27-0.22035-1.57360.06088
28-0.274874-1.9630.027556
29-0.263034-1.87840.033021
30-0.281804-2.01250.024732
31-0.340031-2.42830.009368
32-0.288448-2.05990.022263
33-0.293477-2.09580.020539
34-0.319412-2.28110.013377
35-0.344581-2.46080.008644
36-0.362315-2.58740.006281
37-0.344751-2.4620.008618
38-0.326853-2.33420.011781
39-0.33618-2.40080.010022
40-0.326294-2.33020.011895
41-0.331575-2.36790.010859
42-0.303267-2.16580.017515
43-0.281578-2.01090.02482
44-0.259583-1.85380.034778
45-0.235524-1.6820.049344
46-0.206652-1.47580.073074
47-0.194239-1.38710.085715
48-0.14827-1.05890.147326
49-0.128926-0.92070.180766
50-0.090399-0.64560.260723
51NANANA
52NANANA
53NANANA
54NANANA
55NANANA
56NANANA
57NANANA
58NANANA
59NANANA
60NANANA


Partial Autocorrelation Function
Time lag kPACF(k)T-STATP-value
10.8044715.74510
20.2581111.84330.035552
30.1878081.34120.092896
40.0095990.06850.472809
50.0576790.41190.341066
60.0141430.1010.459973
7-0.109171-0.77960.219604
8-0.030682-0.21910.413719
9-0.073099-0.5220.301955
10-0.004637-0.03310.486855
11-0.04804-0.34310.366475
12-0.177268-1.2660.105642
130.1608641.14880.127999
14-0.092776-0.66260.255301
15-0.018524-0.13230.447639
160.0107320.07660.469605
17-0.030148-0.21530.415196
18-0.009311-0.06650.473622
190.060970.43540.33255
20-0.251357-1.7950.039287
210.0990460.70730.24129
22-0.070331-0.50230.308822
230.0490920.35060.36367
24-0.049612-0.35430.362286
25-0.066404-0.47420.318684
260.0141140.10080.460054
270.0167880.11990.452521
28-0.135121-0.9650.16956
290.0773590.55250.291525
30-0.087169-0.62250.26819
31-0.061945-0.44240.330044
320.0682960.48770.313915
330.0568230.40580.343295
34-0.10767-0.76890.222745
35-0.110425-0.78860.217
36-0.047239-0.33740.368618
370.0699550.49960.309761
38-0.001389-0.00990.496062
390.0355430.25380.400324
40-0.138392-0.98830.163831
410.1009370.72080.23715
42-0.002172-0.01550.493843
43-0.037061-0.26470.396167
440.1398290.99860.161357
45-0.049808-0.35570.361767
460.0002620.00190.499258
470.0326930.23350.408165
48-0.042427-0.3030.381565
490.0768420.54880.292783
500.0493430.35240.363003
51NANANA
52NANANA
53NANANA
54NANANA
55NANANA
56NANANA
57NANANA
58NANANA
59NANANA
60NANANA

\begin{tabular}{lllllllll}
\hline
Partial Autocorrelation Function \tabularnewline
Time lag k & PACF(k) & T-STAT & P-value \tabularnewline
1 & 0.804471 & 5.7451 & 0 \tabularnewline
2 & 0.258111 & 1.8433 & 0.035552 \tabularnewline
3 & 0.187808 & 1.3412 & 0.092896 \tabularnewline
4 & 0.009599 & 0.0685 & 0.472809 \tabularnewline
5 & 0.057679 & 0.4119 & 0.341066 \tabularnewline
6 & 0.014143 & 0.101 & 0.459973 \tabularnewline
7 & -0.109171 & -0.7796 & 0.219604 \tabularnewline
8 & -0.030682 & -0.2191 & 0.413719 \tabularnewline
9 & -0.073099 & -0.522 & 0.301955 \tabularnewline
10 & -0.004637 & -0.0331 & 0.486855 \tabularnewline
11 & -0.04804 & -0.3431 & 0.366475 \tabularnewline
12 & -0.177268 & -1.266 & 0.105642 \tabularnewline
13 & 0.160864 & 1.1488 & 0.127999 \tabularnewline
14 & -0.092776 & -0.6626 & 0.255301 \tabularnewline
15 & -0.018524 & -0.1323 & 0.447639 \tabularnewline
16 & 0.010732 & 0.0766 & 0.469605 \tabularnewline
17 & -0.030148 & -0.2153 & 0.415196 \tabularnewline
18 & -0.009311 & -0.0665 & 0.473622 \tabularnewline
19 & 0.06097 & 0.4354 & 0.33255 \tabularnewline
20 & -0.251357 & -1.795 & 0.039287 \tabularnewline
21 & 0.099046 & 0.7073 & 0.24129 \tabularnewline
22 & -0.070331 & -0.5023 & 0.308822 \tabularnewline
23 & 0.049092 & 0.3506 & 0.36367 \tabularnewline
24 & -0.049612 & -0.3543 & 0.362286 \tabularnewline
25 & -0.066404 & -0.4742 & 0.318684 \tabularnewline
26 & 0.014114 & 0.1008 & 0.460054 \tabularnewline
27 & 0.016788 & 0.1199 & 0.452521 \tabularnewline
28 & -0.135121 & -0.965 & 0.16956 \tabularnewline
29 & 0.077359 & 0.5525 & 0.291525 \tabularnewline
30 & -0.087169 & -0.6225 & 0.26819 \tabularnewline
31 & -0.061945 & -0.4424 & 0.330044 \tabularnewline
32 & 0.068296 & 0.4877 & 0.313915 \tabularnewline
33 & 0.056823 & 0.4058 & 0.343295 \tabularnewline
34 & -0.10767 & -0.7689 & 0.222745 \tabularnewline
35 & -0.110425 & -0.7886 & 0.217 \tabularnewline
36 & -0.047239 & -0.3374 & 0.368618 \tabularnewline
37 & 0.069955 & 0.4996 & 0.309761 \tabularnewline
38 & -0.001389 & -0.0099 & 0.496062 \tabularnewline
39 & 0.035543 & 0.2538 & 0.400324 \tabularnewline
40 & -0.138392 & -0.9883 & 0.163831 \tabularnewline
41 & 0.100937 & 0.7208 & 0.23715 \tabularnewline
42 & -0.002172 & -0.0155 & 0.493843 \tabularnewline
43 & -0.037061 & -0.2647 & 0.396167 \tabularnewline
44 & 0.139829 & 0.9986 & 0.161357 \tabularnewline
45 & -0.049808 & -0.3557 & 0.361767 \tabularnewline
46 & 0.000262 & 0.0019 & 0.499258 \tabularnewline
47 & 0.032693 & 0.2335 & 0.408165 \tabularnewline
48 & -0.042427 & -0.303 & 0.381565 \tabularnewline
49 & 0.076842 & 0.5488 & 0.292783 \tabularnewline
50 & 0.049343 & 0.3524 & 0.363003 \tabularnewline
51 & NA & NA & NA \tabularnewline
52 & NA & NA & NA \tabularnewline
53 & NA & NA & NA \tabularnewline
54 & NA & NA & NA \tabularnewline
55 & NA & NA & NA \tabularnewline
56 & NA & NA & NA \tabularnewline
57 & NA & NA & NA \tabularnewline
58 & NA & NA & NA \tabularnewline
59 & NA & NA & NA \tabularnewline
60 & NA & NA & NA \tabularnewline
\hline
\end{tabular}
%Source: https://freestatistics.org/blog/index.php?pk=29974&T=2

[TABLE]
[ROW][C]Partial Autocorrelation Function[/C][/ROW]
[ROW][C]Time lag k[/C][C]PACF(k)[/C][C]T-STAT[/C][C]P-value[/C][/ROW]
[ROW][C]1[/C][C]0.804471[/C][C]5.7451[/C][C]0[/C][/ROW]
[ROW][C]2[/C][C]0.258111[/C][C]1.8433[/C][C]0.035552[/C][/ROW]
[ROW][C]3[/C][C]0.187808[/C][C]1.3412[/C][C]0.092896[/C][/ROW]
[ROW][C]4[/C][C]0.009599[/C][C]0.0685[/C][C]0.472809[/C][/ROW]
[ROW][C]5[/C][C]0.057679[/C][C]0.4119[/C][C]0.341066[/C][/ROW]
[ROW][C]6[/C][C]0.014143[/C][C]0.101[/C][C]0.459973[/C][/ROW]
[ROW][C]7[/C][C]-0.109171[/C][C]-0.7796[/C][C]0.219604[/C][/ROW]
[ROW][C]8[/C][C]-0.030682[/C][C]-0.2191[/C][C]0.413719[/C][/ROW]
[ROW][C]9[/C][C]-0.073099[/C][C]-0.522[/C][C]0.301955[/C][/ROW]
[ROW][C]10[/C][C]-0.004637[/C][C]-0.0331[/C][C]0.486855[/C][/ROW]
[ROW][C]11[/C][C]-0.04804[/C][C]-0.3431[/C][C]0.366475[/C][/ROW]
[ROW][C]12[/C][C]-0.177268[/C][C]-1.266[/C][C]0.105642[/C][/ROW]
[ROW][C]13[/C][C]0.160864[/C][C]1.1488[/C][C]0.127999[/C][/ROW]
[ROW][C]14[/C][C]-0.092776[/C][C]-0.6626[/C][C]0.255301[/C][/ROW]
[ROW][C]15[/C][C]-0.018524[/C][C]-0.1323[/C][C]0.447639[/C][/ROW]
[ROW][C]16[/C][C]0.010732[/C][C]0.0766[/C][C]0.469605[/C][/ROW]
[ROW][C]17[/C][C]-0.030148[/C][C]-0.2153[/C][C]0.415196[/C][/ROW]
[ROW][C]18[/C][C]-0.009311[/C][C]-0.0665[/C][C]0.473622[/C][/ROW]
[ROW][C]19[/C][C]0.06097[/C][C]0.4354[/C][C]0.33255[/C][/ROW]
[ROW][C]20[/C][C]-0.251357[/C][C]-1.795[/C][C]0.039287[/C][/ROW]
[ROW][C]21[/C][C]0.099046[/C][C]0.7073[/C][C]0.24129[/C][/ROW]
[ROW][C]22[/C][C]-0.070331[/C][C]-0.5023[/C][C]0.308822[/C][/ROW]
[ROW][C]23[/C][C]0.049092[/C][C]0.3506[/C][C]0.36367[/C][/ROW]
[ROW][C]24[/C][C]-0.049612[/C][C]-0.3543[/C][C]0.362286[/C][/ROW]
[ROW][C]25[/C][C]-0.066404[/C][C]-0.4742[/C][C]0.318684[/C][/ROW]
[ROW][C]26[/C][C]0.014114[/C][C]0.1008[/C][C]0.460054[/C][/ROW]
[ROW][C]27[/C][C]0.016788[/C][C]0.1199[/C][C]0.452521[/C][/ROW]
[ROW][C]28[/C][C]-0.135121[/C][C]-0.965[/C][C]0.16956[/C][/ROW]
[ROW][C]29[/C][C]0.077359[/C][C]0.5525[/C][C]0.291525[/C][/ROW]
[ROW][C]30[/C][C]-0.087169[/C][C]-0.6225[/C][C]0.26819[/C][/ROW]
[ROW][C]31[/C][C]-0.061945[/C][C]-0.4424[/C][C]0.330044[/C][/ROW]
[ROW][C]32[/C][C]0.068296[/C][C]0.4877[/C][C]0.313915[/C][/ROW]
[ROW][C]33[/C][C]0.056823[/C][C]0.4058[/C][C]0.343295[/C][/ROW]
[ROW][C]34[/C][C]-0.10767[/C][C]-0.7689[/C][C]0.222745[/C][/ROW]
[ROW][C]35[/C][C]-0.110425[/C][C]-0.7886[/C][C]0.217[/C][/ROW]
[ROW][C]36[/C][C]-0.047239[/C][C]-0.3374[/C][C]0.368618[/C][/ROW]
[ROW][C]37[/C][C]0.069955[/C][C]0.4996[/C][C]0.309761[/C][/ROW]
[ROW][C]38[/C][C]-0.001389[/C][C]-0.0099[/C][C]0.496062[/C][/ROW]
[ROW][C]39[/C][C]0.035543[/C][C]0.2538[/C][C]0.400324[/C][/ROW]
[ROW][C]40[/C][C]-0.138392[/C][C]-0.9883[/C][C]0.163831[/C][/ROW]
[ROW][C]41[/C][C]0.100937[/C][C]0.7208[/C][C]0.23715[/C][/ROW]
[ROW][C]42[/C][C]-0.002172[/C][C]-0.0155[/C][C]0.493843[/C][/ROW]
[ROW][C]43[/C][C]-0.037061[/C][C]-0.2647[/C][C]0.396167[/C][/ROW]
[ROW][C]44[/C][C]0.139829[/C][C]0.9986[/C][C]0.161357[/C][/ROW]
[ROW][C]45[/C][C]-0.049808[/C][C]-0.3557[/C][C]0.361767[/C][/ROW]
[ROW][C]46[/C][C]0.000262[/C][C]0.0019[/C][C]0.499258[/C][/ROW]
[ROW][C]47[/C][C]0.032693[/C][C]0.2335[/C][C]0.408165[/C][/ROW]
[ROW][C]48[/C][C]-0.042427[/C][C]-0.303[/C][C]0.381565[/C][/ROW]
[ROW][C]49[/C][C]0.076842[/C][C]0.5488[/C][C]0.292783[/C][/ROW]
[ROW][C]50[/C][C]0.049343[/C][C]0.3524[/C][C]0.363003[/C][/ROW]
[ROW][C]51[/C][C]NA[/C][C]NA[/C][C]NA[/C][/ROW]
[ROW][C]52[/C][C]NA[/C][C]NA[/C][C]NA[/C][/ROW]
[ROW][C]53[/C][C]NA[/C][C]NA[/C][C]NA[/C][/ROW]
[ROW][C]54[/C][C]NA[/C][C]NA[/C][C]NA[/C][/ROW]
[ROW][C]55[/C][C]NA[/C][C]NA[/C][C]NA[/C][/ROW]
[ROW][C]56[/C][C]NA[/C][C]NA[/C][C]NA[/C][/ROW]
[ROW][C]57[/C][C]NA[/C][C]NA[/C][C]NA[/C][/ROW]
[ROW][C]58[/C][C]NA[/C][C]NA[/C][C]NA[/C][/ROW]
[ROW][C]59[/C][C]NA[/C][C]NA[/C][C]NA[/C][/ROW]
[ROW][C]60[/C][C]NA[/C][C]NA[/C][C]NA[/C][/ROW]
[/TABLE]
Source: https://freestatistics.org/blog/index.php?pk=29974&T=2

Globally Unique Identifier (entire table): ba.freestatistics.org/blog/index.php?pk=29974&T=2

As an alternative you can also use a QR Code:  

The GUIDs for individual cells are displayed in the table below:

Partial Autocorrelation Function
Time lag kPACF(k)T-STATP-value
10.8044715.74510
20.2581111.84330.035552
30.1878081.34120.092896
40.0095990.06850.472809
50.0576790.41190.341066
60.0141430.1010.459973
7-0.109171-0.77960.219604
8-0.030682-0.21910.413719
9-0.073099-0.5220.301955
10-0.004637-0.03310.486855
11-0.04804-0.34310.366475
12-0.177268-1.2660.105642
130.1608641.14880.127999
14-0.092776-0.66260.255301
15-0.018524-0.13230.447639
160.0107320.07660.469605
17-0.030148-0.21530.415196
18-0.009311-0.06650.473622
190.060970.43540.33255
20-0.251357-1.7950.039287
210.0990460.70730.24129
22-0.070331-0.50230.308822
230.0490920.35060.36367
24-0.049612-0.35430.362286
25-0.066404-0.47420.318684
260.0141140.10080.460054
270.0167880.11990.452521
28-0.135121-0.9650.16956
290.0773590.55250.291525
30-0.087169-0.62250.26819
31-0.061945-0.44240.330044
320.0682960.48770.313915
330.0568230.40580.343295
34-0.10767-0.76890.222745
35-0.110425-0.78860.217
36-0.047239-0.33740.368618
370.0699550.49960.309761
38-0.001389-0.00990.496062
390.0355430.25380.400324
40-0.138392-0.98830.163831
410.1009370.72080.23715
42-0.002172-0.01550.493843
43-0.037061-0.26470.396167
440.1398290.99860.161357
45-0.049808-0.35570.361767
460.0002620.00190.499258
470.0326930.23350.408165
48-0.042427-0.3030.381565
490.0768420.54880.292783
500.0493430.35240.363003
51NANANA
52NANANA
53NANANA
54NANANA
55NANANA
56NANANA
57NANANA
58NANANA
59NANANA
60NANANA


Parameters (Session):
par1 = 60 ; par2 = 0.2 ; par3 = 0 ; par4 = 0 ; par5 = 12 ;
Parameters (R input):
par1 = 60 ; par2 = 0.2 ; par3 = 0 ; par4 = 0 ; par5 = 12 ;
R code (references can be found in the software module):
if (par1 == 'Default') {
par1 = 10*log10(length(x))
} else {
par1 <- as.numeric(par1)
}
par2 <- as.numeric(par2)
par3 <- as.numeric(par3)
par4 <- as.numeric(par4)
par5 <- as.numeric(par5)
if (par2 == 0) {
x <- log(x)
} else {
x <- (x ^ par2 - 1) / par2
}
if (par3 > 0) x <- diff(x,lag=1,difference=par3)
if (par4 > 0) x <- diff(x,lag=par5,difference=par4)
bitmap(file='pic1.png')
racf <- acf(x,par1,main='Autocorrelation',xlab='lags',ylab='ACF')
dev.off()
bitmap(file='pic2.png')
rpacf <- pacf(x,par1,main='Partial Autocorrelation',xlab='lags',ylab='PACF')
dev.off()
(myacf <- c(racf$acf))
(mypacf <- c(rpacf$acf))
lengthx <- length(x)
sqrtn <- sqrt(lengthx)
load(file='createtable')
a<-table.start()
a<-table.row.start(a)
a<-table.element(a,'Autocorrelation Function',4,TRUE)
a<-table.row.end(a)
a<-table.row.start(a)
a<-table.element(a,'Time lag k',header=TRUE)
a<-table.element(a,hyperlink('basics.htm','ACF(k)','click here for more information about the Autocorrelation Function'),header=TRUE)
a<-table.element(a,'T-STAT',header=TRUE)
a<-table.element(a,'P-value',header=TRUE)
a<-table.row.end(a)
for (i in 2:(par1+1)) {
a<-table.row.start(a)
a<-table.element(a,i-1,header=TRUE)
a<-table.element(a,round(myacf[i],6))
mytstat <- myacf[i]*sqrtn
a<-table.element(a,round(mytstat,4))
a<-table.element(a,round(1-pt(abs(mytstat),lengthx),6))
a<-table.row.end(a)
}
a<-table.end(a)
table.save(a,file='mytable.tab')
a<-table.start()
a<-table.row.start(a)
a<-table.element(a,'Partial Autocorrelation Function',4,TRUE)
a<-table.row.end(a)
a<-table.row.start(a)
a<-table.element(a,'Time lag k',header=TRUE)
a<-table.element(a,hyperlink('basics.htm','PACF(k)','click here for more information about the Partial Autocorrelation Function'),header=TRUE)
a<-table.element(a,'T-STAT',header=TRUE)
a<-table.element(a,'P-value',header=TRUE)
a<-table.row.end(a)
for (i in 1:par1) {
a<-table.row.start(a)
a<-table.element(a,i,header=TRUE)
a<-table.element(a,round(mypacf[i],6))
mytstat <- mypacf[i]*sqrtn
a<-table.element(a,round(mytstat,4))
a<-table.element(a,round(1-pt(abs(mytstat),lengthx),6))
a<-table.row.end(a)
}
a<-table.end(a)
table.save(a,file='mytable1.tab')