Free Statistics
of Irreproducible Research!
Description of Statistical Computation | |||||||||||||||||||||||||||||||||||||||||
|---|---|---|---|---|---|---|---|---|---|---|---|---|---|---|---|---|---|---|---|---|---|---|---|---|---|---|---|---|---|---|---|---|---|---|---|---|---|---|---|---|---|
| Author's title | |||||||||||||||||||||||||||||||||||||||||
| Author | *The author of this computation has been verified* | ||||||||||||||||||||||||||||||||||||||||
| R Software Module | rwasp_univariatedataseries.wasp | ||||||||||||||||||||||||||||||||||||||||
| Title produced by software | Univariate Data Series | ||||||||||||||||||||||||||||||||||||||||
| Date of computation | Sun, 07 Dec 2008 06:17:15 -0700 | ||||||||||||||||||||||||||||||||||||||||
| Cite this page as follows | Statistical Computations at FreeStatistics.org, Office for Research Development and Education, URL https://freestatistics.org/blog/index.php?v=date/2008/Dec/07/t1228655919dm8tv2on0fexxpn.htm/, Retrieved Sun, 19 May 2024 10:23:52 +0000 | ||||||||||||||||||||||||||||||||||||||||
| Statistical Computations at FreeStatistics.org, Office for Research Development and Education, URL https://freestatistics.org/blog/index.php?pk=29944, Retrieved Sun, 19 May 2024 10:23:52 +0000 | |||||||||||||||||||||||||||||||||||||||||
| QR Codes: | |||||||||||||||||||||||||||||||||||||||||
|
| |||||||||||||||||||||||||||||||||||||||||
| Original text written by user: | |||||||||||||||||||||||||||||||||||||||||
| IsPrivate? | No (this computation is public) | ||||||||||||||||||||||||||||||||||||||||
| User-defined keywords | |||||||||||||||||||||||||||||||||||||||||
| Estimated Impact | 178 | ||||||||||||||||||||||||||||||||||||||||
Tree of Dependent Computations | |||||||||||||||||||||||||||||||||||||||||
| Family? (F = Feedback message, R = changed R code, M = changed R Module, P = changed Parameters, D = changed Data) | |||||||||||||||||||||||||||||||||||||||||
| - [Univariate Data Series] [Uitvoer per gewes...] [2008-12-07 13:17:15] [5e2b1e7aa808f9f0d23fd35605d4968f] [Current] - RMPD [Central Tendency] [Uitvoer per gewes...] [2008-12-07 18:05:37] [299afd6311e4c20059ea2f05c8dd029d] - RMPD [Mean versus Median] [Totale Uitvoer va...] [2008-12-07 18:10:11] [299afd6311e4c20059ea2f05c8dd029d] - RM D [Variability] [Totale Uitvoer va...] [2008-12-07 18:27:09] [299afd6311e4c20059ea2f05c8dd029d] - RMP [Stem-and-leaf Plot] [Totale Uitvoer va...] [2008-12-07 18:30:57] [299afd6311e4c20059ea2f05c8dd029d] - RMP [Histogram] [Totale Uitvoer va...] [2008-12-07 18:36:52] [299afd6311e4c20059ea2f05c8dd029d] - RMPD [Quartiles] [Totale Uitvoer va...] [2008-12-07 18:50:34] [299afd6311e4c20059ea2f05c8dd029d] - D [Quartiles] [Totale Uitvoer va...] [2008-12-07 18:55:01] [299afd6311e4c20059ea2f05c8dd029d] - RM D [Harrell-Davis Quantiles] [Totale Uitvoer va...] [2008-12-07 19:00:07] [299afd6311e4c20059ea2f05c8dd029d] - RM D [Percentiles] [Totale Uitvoer va...] [2008-12-07 19:25:54] [299afd6311e4c20059ea2f05c8dd029d] | |||||||||||||||||||||||||||||||||||||||||
| Feedback Forum | |||||||||||||||||||||||||||||||||||||||||
Post a new message | |||||||||||||||||||||||||||||||||||||||||
Dataset | |||||||||||||||||||||||||||||||||||||||||
| Dataseries X: | |||||||||||||||||||||||||||||||||||||||||
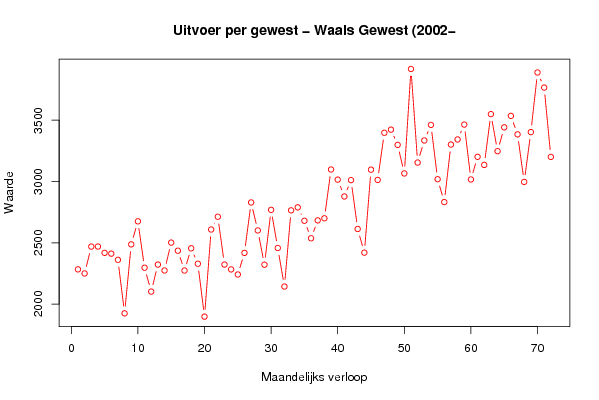
2283 2249,5 2468,9 2469,2 2417,7 2411,1 2361 1924,1 2486,9 2674,9 2296,2 2101,5 2322 2273,8 2501,3 2435,2 2273,3 2454,7 2328,8 1897 2608,1 2712,3 2322 2282,6 2241,1 2417,2 2829 2600,6 2321 2768,5 2457,3 2142,7 2764,4 2788,9 2679,5 2536,5 2682,7 2699,6 3097,8 3015,2 2878 3010,9 2612,3 2419,3 3096,5 3013 3397,4 3423,1 3298,7 3065,7 3918,3 3154,4 3334,7 3461,6 3018,5 2832 3301,3 3342,8 3464,4 3016,6 3201,3 3135,3 3549,8 3247,2 3441,8 3535,6 3384,7 2996,6 3402,8 3889,4 3766,3 3200,7 | |||||||||||||||||||||||||||||||||||||||||
Tables (Output of Computation) | |||||||||||||||||||||||||||||||||||||||||
| |||||||||||||||||||||||||||||||||||||||||
Figures (Output of Computation) | |||||||||||||||||||||||||||||||||||||||||
Input Parameters & R Code | |||||||||||||||||||||||||||||||||||||||||
| Parameters (Session): | |||||||||||||||||||||||||||||||||||||||||
| par1 = Uitvoer per gewest - Waals Gewest (2002-2007) ; par2 = www.belgostat.be ; par3 = Uitvoer van Belgi� volgens het nationale concept verdeeld over de gewesten van oorsprong ; | |||||||||||||||||||||||||||||||||||||||||
| Parameters (R input): | |||||||||||||||||||||||||||||||||||||||||
| par1 = Uitvoer per gewest - Waals Gewest (2002-2007) ; par2 = www.belgostat.be ; par3 = Uitvoer van Belgi� volgens het nationale concept verdeeld over de gewesten van oorsprong ; | |||||||||||||||||||||||||||||||||||||||||
| R code (references can be found in the software module): | |||||||||||||||||||||||||||||||||||||||||
bitmap(file='test1.png') | |||||||||||||||||||||||||||||||||||||||||