Free Statistics

of Irreproducible Research!

Author's title

Author*The author of this computation has been verified*
R Software Modulerwasp_autocorrelation.wasp
Title produced by software(Partial) Autocorrelation Function
Date of computationSun, 07 Dec 2008 06:14:32 -0700
Cite this page as followsStatistical Computations at FreeStatistics.org, Office for Research Development and Education, URL https://freestatistics.org/blog/index.php?v=date/2008/Dec/07/t122865571905cq1b6v92lbf1e.htm/, Retrieved Sun, 19 May 2024 11:38:40 +0000
Statistical Computations at FreeStatistics.org, Office for Research Development and Education, URL https://freestatistics.org/blog/index.php?pk=29938, Retrieved Sun, 19 May 2024 11:38:40 +0000
QR Codes:

Original text written by user:
IsPrivate?No (this computation is public)
User-defined keywords
Estimated Impact210
Family? (F = Feedback message, R = changed R code, M = changed R Module, P = changed Parameters, D = changed Data)
F     [Variance Reduction Matrix] [step 2 uitvoer] [2008-12-05 17:47:26] [3a9fc6d5b5e0e816787b7dbace57e7cd]
F RMPD  [Spectral Analysis] [step 2 uitvoer] [2008-12-05 18:02:42] [3a9fc6d5b5e0e816787b7dbace57e7cd]
F RMP       [(Partial) Autocorrelation Function] [step 3] [2008-12-07 13:14:32] [821c4b3d195be8e737cf8c9dc649d3cf] [Current]
F RMP         [ARIMA Backward Selection] [step 5] [2008-12-07 13:24:10] [3a9fc6d5b5e0e816787b7dbace57e7cd]
- RMPD          [ARIMA Forecasting] [ARIMA forecasting] [2008-12-09 19:14:50] [3a9fc6d5b5e0e816787b7dbace57e7cd]
-   P           [ARIMA Backward Selection] [verbetering] [2008-12-16 19:23:33] [3a9fc6d5b5e0e816787b7dbace57e7cd]
-   P         [(Partial) Autocorrelation Function] [verbetering] [2008-12-16 19:16:45] [3a9fc6d5b5e0e816787b7dbace57e7cd]
Feedback Forum
2008-12-15 15:38:03 [Natalie De Wilde] [reply
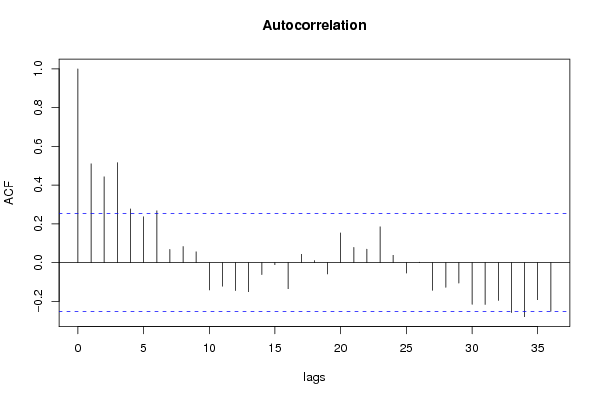
Zoals al gezegd bij step 2, is er nog wel een lange termijn trend te zien bij ACF en Spectral Analysis. De seizoenaliteit heb je wel weggewerkt.
2008-12-15 15:44:29 [Natalie De Wilde] [reply
Je baseert je op de grafieken bij transformatieparameters d =0 en D=1. Ik weet niet of je dan het juiste model verkrijgt.
2008-12-16 19:19:48 [Gert-Jan Geudens] [reply
Niet correct. We zien hier nog duidelijk een lineaire trend. Het volstaat dus niet om enkel seizonaal te differentiëren.

De correcte output kan je hier vinden :

http://www.freestatistics.org/blog/date/2008/Dec/16/t12294550805xuusv7t5g0q8lm.htm

bij d=1 en D=1 bekomen we een stationaire reeks.
2008-12-16 19:22:02 [Gert-Jan Geudens] [reply
Step 4 : De gevonden conclusie is waarschijnlijk niet correct aangezien je tijdreeks nog niet stationair is.

Hier kan je de correcte output vinden:

http://www.freestatistics.org/blog/date/2008/Dec/16/t12294550805xuusv7t5g0q8lm.htm

je werkwijze was wel correct. Nu moet je dus, exact hetzelfde doen op bovenstaande output, om het correcte resultaat te bekomen.

Post a new message
Dataseries X:
2150.3
2425.7
2642.0
2291.5
2570.7
2526.6
2266.2
1981.9
2630.3
2942.6
2713.4
2437.5
2678.9
2582.0
2780.0
2512.4
2658.4
2708.7
2518.7
2018.3
2579.3
2693.5
2468.8
2122.8
2412.8
2370.6
2642.5
2634.2
2457.5
2579.1
2505.9
1903.2
2660.2
2844.1
2607.1
2356.0
2659.9
2531.4
2845.7
2654.3
2588.2
2789.6
2533.1
1846.5
2796.3
2895.6
2472.2
2584.4
2630.4
2663.1
3176.2
2856.7
2551.4
3088.7
2628.3
2226.2
3023.6
3077.9
3084.1
2990.3
2949.6
3014.7
3517.7
3121.2
3067.4
3174.6
2676.3
2424.0
3195.1
3146.6
3506.7
3528.5


Summary of computational transaction
Raw Inputview raw input (R code)
Raw Outputview raw output of R engine
Computing time3 seconds
R Server'Herman Ole Andreas Wold' @ 193.190.124.10:1001

\begin{tabular}{lllllllll}
\hline
Summary of computational transaction \tabularnewline
Raw Input & view raw input (R code)  \tabularnewline
Raw Output & view raw output of R engine  \tabularnewline
Computing time & 3 seconds \tabularnewline
R Server & 'Herman Ole Andreas Wold' @ 193.190.124.10:1001 \tabularnewline
\hline
\end{tabular}
%Source: https://freestatistics.org/blog/index.php?pk=29938&T=0

[TABLE]
[ROW][C]Summary of computational transaction[/C][/ROW]
[ROW][C]Raw Input[/C][C]view raw input (R code) [/C][/ROW]
[ROW][C]Raw Output[/C][C]view raw output of R engine [/C][/ROW]
[ROW][C]Computing time[/C][C]3 seconds[/C][/ROW]
[ROW][C]R Server[/C][C]'Herman Ole Andreas Wold' @ 193.190.124.10:1001[/C][/ROW]
[/TABLE]
Source: https://freestatistics.org/blog/index.php?pk=29938&T=0

Globally Unique Identifier (entire table): ba.freestatistics.org/blog/index.php?pk=29938&T=0

As an alternative you can also use a QR Code:  

The GUIDs for individual cells are displayed in the table below:

Summary of computational transaction
Raw Inputview raw input (R code)
Raw Outputview raw output of R engine
Computing time3 seconds
R Server'Herman Ole Andreas Wold' @ 193.190.124.10:1001


Autocorrelation Function
Time lag kACF(k)T-STATP-value
10.5098283.94910.000104
20.4427763.42970.000549
30.5156273.9949e-05
40.2767852.1440.018049
50.2365571.83240.03593
60.267522.07220.021276
70.0677880.52510.30073
80.0830290.64310.261291
90.0555720.43050.334203
10-0.141031-1.09240.139507
11-0.122091-0.94570.174044
12-0.144378-1.11830.133939
13-0.150551-1.16620.124082
14-0.061726-0.47810.317147
15-0.010566-0.08180.467522
16-0.135023-1.04590.149904
170.0429050.33230.370395
180.0107310.08310.467015
19-0.058464-0.45290.326141
200.1529051.18440.120463
210.0783090.60660.273208
220.0690630.5350.297328
230.1845781.42970.07899
240.0376830.29190.38569
25-0.054177-0.41970.33812
260.0017990.01390.494464
27-0.142919-1.1070.136347
28-0.127517-0.98770.163624
29-0.105648-0.81830.208199
30-0.215562-1.66970.05009
31-0.216111-1.6740.04967
32-0.195751-1.51630.06735
33-0.257801-1.99690.025188
34-0.279198-2.16270.017282
35-0.191612-1.48420.071492
36-0.251628-1.94910.027981

\begin{tabular}{lllllllll}
\hline
Autocorrelation Function \tabularnewline
Time lag k & ACF(k) & T-STAT & P-value \tabularnewline
1 & 0.509828 & 3.9491 & 0.000104 \tabularnewline
2 & 0.442776 & 3.4297 & 0.000549 \tabularnewline
3 & 0.515627 & 3.994 & 9e-05 \tabularnewline
4 & 0.276785 & 2.144 & 0.018049 \tabularnewline
5 & 0.236557 & 1.8324 & 0.03593 \tabularnewline
6 & 0.26752 & 2.0722 & 0.021276 \tabularnewline
7 & 0.067788 & 0.5251 & 0.30073 \tabularnewline
8 & 0.083029 & 0.6431 & 0.261291 \tabularnewline
9 & 0.055572 & 0.4305 & 0.334203 \tabularnewline
10 & -0.141031 & -1.0924 & 0.139507 \tabularnewline
11 & -0.122091 & -0.9457 & 0.174044 \tabularnewline
12 & -0.144378 & -1.1183 & 0.133939 \tabularnewline
13 & -0.150551 & -1.1662 & 0.124082 \tabularnewline
14 & -0.061726 & -0.4781 & 0.317147 \tabularnewline
15 & -0.010566 & -0.0818 & 0.467522 \tabularnewline
16 & -0.135023 & -1.0459 & 0.149904 \tabularnewline
17 & 0.042905 & 0.3323 & 0.370395 \tabularnewline
18 & 0.010731 & 0.0831 & 0.467015 \tabularnewline
19 & -0.058464 & -0.4529 & 0.326141 \tabularnewline
20 & 0.152905 & 1.1844 & 0.120463 \tabularnewline
21 & 0.078309 & 0.6066 & 0.273208 \tabularnewline
22 & 0.069063 & 0.535 & 0.297328 \tabularnewline
23 & 0.184578 & 1.4297 & 0.07899 \tabularnewline
24 & 0.037683 & 0.2919 & 0.38569 \tabularnewline
25 & -0.054177 & -0.4197 & 0.33812 \tabularnewline
26 & 0.001799 & 0.0139 & 0.494464 \tabularnewline
27 & -0.142919 & -1.107 & 0.136347 \tabularnewline
28 & -0.127517 & -0.9877 & 0.163624 \tabularnewline
29 & -0.105648 & -0.8183 & 0.208199 \tabularnewline
30 & -0.215562 & -1.6697 & 0.05009 \tabularnewline
31 & -0.216111 & -1.674 & 0.04967 \tabularnewline
32 & -0.195751 & -1.5163 & 0.06735 \tabularnewline
33 & -0.257801 & -1.9969 & 0.025188 \tabularnewline
34 & -0.279198 & -2.1627 & 0.017282 \tabularnewline
35 & -0.191612 & -1.4842 & 0.071492 \tabularnewline
36 & -0.251628 & -1.9491 & 0.027981 \tabularnewline
\hline
\end{tabular}
%Source: https://freestatistics.org/blog/index.php?pk=29938&T=1

[TABLE]
[ROW][C]Autocorrelation Function[/C][/ROW]
[ROW][C]Time lag k[/C][C]ACF(k)[/C][C]T-STAT[/C][C]P-value[/C][/ROW]
[ROW][C]1[/C][C]0.509828[/C][C]3.9491[/C][C]0.000104[/C][/ROW]
[ROW][C]2[/C][C]0.442776[/C][C]3.4297[/C][C]0.000549[/C][/ROW]
[ROW][C]3[/C][C]0.515627[/C][C]3.994[/C][C]9e-05[/C][/ROW]
[ROW][C]4[/C][C]0.276785[/C][C]2.144[/C][C]0.018049[/C][/ROW]
[ROW][C]5[/C][C]0.236557[/C][C]1.8324[/C][C]0.03593[/C][/ROW]
[ROW][C]6[/C][C]0.26752[/C][C]2.0722[/C][C]0.021276[/C][/ROW]
[ROW][C]7[/C][C]0.067788[/C][C]0.5251[/C][C]0.30073[/C][/ROW]
[ROW][C]8[/C][C]0.083029[/C][C]0.6431[/C][C]0.261291[/C][/ROW]
[ROW][C]9[/C][C]0.055572[/C][C]0.4305[/C][C]0.334203[/C][/ROW]
[ROW][C]10[/C][C]-0.141031[/C][C]-1.0924[/C][C]0.139507[/C][/ROW]
[ROW][C]11[/C][C]-0.122091[/C][C]-0.9457[/C][C]0.174044[/C][/ROW]
[ROW][C]12[/C][C]-0.144378[/C][C]-1.1183[/C][C]0.133939[/C][/ROW]
[ROW][C]13[/C][C]-0.150551[/C][C]-1.1662[/C][C]0.124082[/C][/ROW]
[ROW][C]14[/C][C]-0.061726[/C][C]-0.4781[/C][C]0.317147[/C][/ROW]
[ROW][C]15[/C][C]-0.010566[/C][C]-0.0818[/C][C]0.467522[/C][/ROW]
[ROW][C]16[/C][C]-0.135023[/C][C]-1.0459[/C][C]0.149904[/C][/ROW]
[ROW][C]17[/C][C]0.042905[/C][C]0.3323[/C][C]0.370395[/C][/ROW]
[ROW][C]18[/C][C]0.010731[/C][C]0.0831[/C][C]0.467015[/C][/ROW]
[ROW][C]19[/C][C]-0.058464[/C][C]-0.4529[/C][C]0.326141[/C][/ROW]
[ROW][C]20[/C][C]0.152905[/C][C]1.1844[/C][C]0.120463[/C][/ROW]
[ROW][C]21[/C][C]0.078309[/C][C]0.6066[/C][C]0.273208[/C][/ROW]
[ROW][C]22[/C][C]0.069063[/C][C]0.535[/C][C]0.297328[/C][/ROW]
[ROW][C]23[/C][C]0.184578[/C][C]1.4297[/C][C]0.07899[/C][/ROW]
[ROW][C]24[/C][C]0.037683[/C][C]0.2919[/C][C]0.38569[/C][/ROW]
[ROW][C]25[/C][C]-0.054177[/C][C]-0.4197[/C][C]0.33812[/C][/ROW]
[ROW][C]26[/C][C]0.001799[/C][C]0.0139[/C][C]0.494464[/C][/ROW]
[ROW][C]27[/C][C]-0.142919[/C][C]-1.107[/C][C]0.136347[/C][/ROW]
[ROW][C]28[/C][C]-0.127517[/C][C]-0.9877[/C][C]0.163624[/C][/ROW]
[ROW][C]29[/C][C]-0.105648[/C][C]-0.8183[/C][C]0.208199[/C][/ROW]
[ROW][C]30[/C][C]-0.215562[/C][C]-1.6697[/C][C]0.05009[/C][/ROW]
[ROW][C]31[/C][C]-0.216111[/C][C]-1.674[/C][C]0.04967[/C][/ROW]
[ROW][C]32[/C][C]-0.195751[/C][C]-1.5163[/C][C]0.06735[/C][/ROW]
[ROW][C]33[/C][C]-0.257801[/C][C]-1.9969[/C][C]0.025188[/C][/ROW]
[ROW][C]34[/C][C]-0.279198[/C][C]-2.1627[/C][C]0.017282[/C][/ROW]
[ROW][C]35[/C][C]-0.191612[/C][C]-1.4842[/C][C]0.071492[/C][/ROW]
[ROW][C]36[/C][C]-0.251628[/C][C]-1.9491[/C][C]0.027981[/C][/ROW]
[/TABLE]
Source: https://freestatistics.org/blog/index.php?pk=29938&T=1

Globally Unique Identifier (entire table): ba.freestatistics.org/blog/index.php?pk=29938&T=1

As an alternative you can also use a QR Code:  

The GUIDs for individual cells are displayed in the table below:

Autocorrelation Function
Time lag kACF(k)T-STATP-value
10.5098283.94910.000104
20.4427763.42970.000549
30.5156273.9949e-05
40.2767852.1440.018049
50.2365571.83240.03593
60.267522.07220.021276
70.0677880.52510.30073
80.0830290.64310.261291
90.0555720.43050.334203
10-0.141031-1.09240.139507
11-0.122091-0.94570.174044
12-0.144378-1.11830.133939
13-0.150551-1.16620.124082
14-0.061726-0.47810.317147
15-0.010566-0.08180.467522
16-0.135023-1.04590.149904
170.0429050.33230.370395
180.0107310.08310.467015
19-0.058464-0.45290.326141
200.1529051.18440.120463
210.0783090.60660.273208
220.0690630.5350.297328
230.1845781.42970.07899
240.0376830.29190.38569
25-0.054177-0.41970.33812
260.0017990.01390.494464
27-0.142919-1.1070.136347
28-0.127517-0.98770.163624
29-0.105648-0.81830.208199
30-0.215562-1.66970.05009
31-0.216111-1.6740.04967
32-0.195751-1.51630.06735
33-0.257801-1.99690.025188
34-0.279198-2.16270.017282
35-0.191612-1.48420.071492
36-0.251628-1.94910.027981


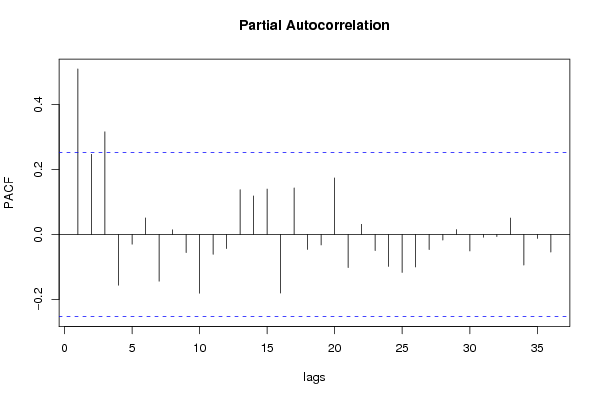
Partial Autocorrelation Function
Time lag kPACF(k)T-STATP-value
10.5098283.94910.000104
20.2470711.91380.03021
30.3161582.44890.008633
4-0.156235-1.21020.115476
5-0.029783-0.23070.409167
60.0511350.39610.346721
7-0.143959-1.11510.134626
80.0145650.11280.455275
9-0.055794-0.43220.33358
10-0.180595-1.39890.083498
11-0.06095-0.47210.319278
12-0.043385-0.33610.369
130.1378551.06780.14494
140.1186730.91920.180826
150.1399181.08380.141394
16-0.180441-1.39770.083676
170.1435621.1120.135282
18-0.045851-0.35520.361858
19-0.032126-0.24880.402164
200.1740331.34810.091354
21-0.101783-0.78840.216781
220.0315360.24430.403926
23-0.049606-0.38420.351078
24-0.098564-0.76350.224086
25-0.11675-0.90430.184716
26-0.100033-0.77490.220735
27-0.046265-0.35840.360663
28-0.017265-0.13370.44703
290.0153240.11870.452954
30-0.050594-0.39190.34826
31-0.008209-0.06360.474754
32-0.006282-0.04870.480676
330.0506860.39260.347997
34-0.094311-0.73050.233955
35-0.012116-0.09390.462769
36-0.054049-0.41870.338478

\begin{tabular}{lllllllll}
\hline
Partial Autocorrelation Function \tabularnewline
Time lag k & PACF(k) & T-STAT & P-value \tabularnewline
1 & 0.509828 & 3.9491 & 0.000104 \tabularnewline
2 & 0.247071 & 1.9138 & 0.03021 \tabularnewline
3 & 0.316158 & 2.4489 & 0.008633 \tabularnewline
4 & -0.156235 & -1.2102 & 0.115476 \tabularnewline
5 & -0.029783 & -0.2307 & 0.409167 \tabularnewline
6 & 0.051135 & 0.3961 & 0.346721 \tabularnewline
7 & -0.143959 & -1.1151 & 0.134626 \tabularnewline
8 & 0.014565 & 0.1128 & 0.455275 \tabularnewline
9 & -0.055794 & -0.4322 & 0.33358 \tabularnewline
10 & -0.180595 & -1.3989 & 0.083498 \tabularnewline
11 & -0.06095 & -0.4721 & 0.319278 \tabularnewline
12 & -0.043385 & -0.3361 & 0.369 \tabularnewline
13 & 0.137855 & 1.0678 & 0.14494 \tabularnewline
14 & 0.118673 & 0.9192 & 0.180826 \tabularnewline
15 & 0.139918 & 1.0838 & 0.141394 \tabularnewline
16 & -0.180441 & -1.3977 & 0.083676 \tabularnewline
17 & 0.143562 & 1.112 & 0.135282 \tabularnewline
18 & -0.045851 & -0.3552 & 0.361858 \tabularnewline
19 & -0.032126 & -0.2488 & 0.402164 \tabularnewline
20 & 0.174033 & 1.3481 & 0.091354 \tabularnewline
21 & -0.101783 & -0.7884 & 0.216781 \tabularnewline
22 & 0.031536 & 0.2443 & 0.403926 \tabularnewline
23 & -0.049606 & -0.3842 & 0.351078 \tabularnewline
24 & -0.098564 & -0.7635 & 0.224086 \tabularnewline
25 & -0.11675 & -0.9043 & 0.184716 \tabularnewline
26 & -0.100033 & -0.7749 & 0.220735 \tabularnewline
27 & -0.046265 & -0.3584 & 0.360663 \tabularnewline
28 & -0.017265 & -0.1337 & 0.44703 \tabularnewline
29 & 0.015324 & 0.1187 & 0.452954 \tabularnewline
30 & -0.050594 & -0.3919 & 0.34826 \tabularnewline
31 & -0.008209 & -0.0636 & 0.474754 \tabularnewline
32 & -0.006282 & -0.0487 & 0.480676 \tabularnewline
33 & 0.050686 & 0.3926 & 0.347997 \tabularnewline
34 & -0.094311 & -0.7305 & 0.233955 \tabularnewline
35 & -0.012116 & -0.0939 & 0.462769 \tabularnewline
36 & -0.054049 & -0.4187 & 0.338478 \tabularnewline
\hline
\end{tabular}
%Source: https://freestatistics.org/blog/index.php?pk=29938&T=2

[TABLE]
[ROW][C]Partial Autocorrelation Function[/C][/ROW]
[ROW][C]Time lag k[/C][C]PACF(k)[/C][C]T-STAT[/C][C]P-value[/C][/ROW]
[ROW][C]1[/C][C]0.509828[/C][C]3.9491[/C][C]0.000104[/C][/ROW]
[ROW][C]2[/C][C]0.247071[/C][C]1.9138[/C][C]0.03021[/C][/ROW]
[ROW][C]3[/C][C]0.316158[/C][C]2.4489[/C][C]0.008633[/C][/ROW]
[ROW][C]4[/C][C]-0.156235[/C][C]-1.2102[/C][C]0.115476[/C][/ROW]
[ROW][C]5[/C][C]-0.029783[/C][C]-0.2307[/C][C]0.409167[/C][/ROW]
[ROW][C]6[/C][C]0.051135[/C][C]0.3961[/C][C]0.346721[/C][/ROW]
[ROW][C]7[/C][C]-0.143959[/C][C]-1.1151[/C][C]0.134626[/C][/ROW]
[ROW][C]8[/C][C]0.014565[/C][C]0.1128[/C][C]0.455275[/C][/ROW]
[ROW][C]9[/C][C]-0.055794[/C][C]-0.4322[/C][C]0.33358[/C][/ROW]
[ROW][C]10[/C][C]-0.180595[/C][C]-1.3989[/C][C]0.083498[/C][/ROW]
[ROW][C]11[/C][C]-0.06095[/C][C]-0.4721[/C][C]0.319278[/C][/ROW]
[ROW][C]12[/C][C]-0.043385[/C][C]-0.3361[/C][C]0.369[/C][/ROW]
[ROW][C]13[/C][C]0.137855[/C][C]1.0678[/C][C]0.14494[/C][/ROW]
[ROW][C]14[/C][C]0.118673[/C][C]0.9192[/C][C]0.180826[/C][/ROW]
[ROW][C]15[/C][C]0.139918[/C][C]1.0838[/C][C]0.141394[/C][/ROW]
[ROW][C]16[/C][C]-0.180441[/C][C]-1.3977[/C][C]0.083676[/C][/ROW]
[ROW][C]17[/C][C]0.143562[/C][C]1.112[/C][C]0.135282[/C][/ROW]
[ROW][C]18[/C][C]-0.045851[/C][C]-0.3552[/C][C]0.361858[/C][/ROW]
[ROW][C]19[/C][C]-0.032126[/C][C]-0.2488[/C][C]0.402164[/C][/ROW]
[ROW][C]20[/C][C]0.174033[/C][C]1.3481[/C][C]0.091354[/C][/ROW]
[ROW][C]21[/C][C]-0.101783[/C][C]-0.7884[/C][C]0.216781[/C][/ROW]
[ROW][C]22[/C][C]0.031536[/C][C]0.2443[/C][C]0.403926[/C][/ROW]
[ROW][C]23[/C][C]-0.049606[/C][C]-0.3842[/C][C]0.351078[/C][/ROW]
[ROW][C]24[/C][C]-0.098564[/C][C]-0.7635[/C][C]0.224086[/C][/ROW]
[ROW][C]25[/C][C]-0.11675[/C][C]-0.9043[/C][C]0.184716[/C][/ROW]
[ROW][C]26[/C][C]-0.100033[/C][C]-0.7749[/C][C]0.220735[/C][/ROW]
[ROW][C]27[/C][C]-0.046265[/C][C]-0.3584[/C][C]0.360663[/C][/ROW]
[ROW][C]28[/C][C]-0.017265[/C][C]-0.1337[/C][C]0.44703[/C][/ROW]
[ROW][C]29[/C][C]0.015324[/C][C]0.1187[/C][C]0.452954[/C][/ROW]
[ROW][C]30[/C][C]-0.050594[/C][C]-0.3919[/C][C]0.34826[/C][/ROW]
[ROW][C]31[/C][C]-0.008209[/C][C]-0.0636[/C][C]0.474754[/C][/ROW]
[ROW][C]32[/C][C]-0.006282[/C][C]-0.0487[/C][C]0.480676[/C][/ROW]
[ROW][C]33[/C][C]0.050686[/C][C]0.3926[/C][C]0.347997[/C][/ROW]
[ROW][C]34[/C][C]-0.094311[/C][C]-0.7305[/C][C]0.233955[/C][/ROW]
[ROW][C]35[/C][C]-0.012116[/C][C]-0.0939[/C][C]0.462769[/C][/ROW]
[ROW][C]36[/C][C]-0.054049[/C][C]-0.4187[/C][C]0.338478[/C][/ROW]
[/TABLE]
Source: https://freestatistics.org/blog/index.php?pk=29938&T=2

Globally Unique Identifier (entire table): ba.freestatistics.org/blog/index.php?pk=29938&T=2

As an alternative you can also use a QR Code:  

The GUIDs for individual cells are displayed in the table below:

Partial Autocorrelation Function
Time lag kPACF(k)T-STATP-value
10.5098283.94910.000104
20.2470711.91380.03021
30.3161582.44890.008633
4-0.156235-1.21020.115476
5-0.029783-0.23070.409167
60.0511350.39610.346721
7-0.143959-1.11510.134626
80.0145650.11280.455275
9-0.055794-0.43220.33358
10-0.180595-1.39890.083498
11-0.06095-0.47210.319278
12-0.043385-0.33610.369
130.1378551.06780.14494
140.1186730.91920.180826
150.1399181.08380.141394
16-0.180441-1.39770.083676
170.1435621.1120.135282
18-0.045851-0.35520.361858
19-0.032126-0.24880.402164
200.1740331.34810.091354
21-0.101783-0.78840.216781
220.0315360.24430.403926
23-0.049606-0.38420.351078
24-0.098564-0.76350.224086
25-0.11675-0.90430.184716
26-0.100033-0.77490.220735
27-0.046265-0.35840.360663
28-0.017265-0.13370.44703
290.0153240.11870.452954
30-0.050594-0.39190.34826
31-0.008209-0.06360.474754
32-0.006282-0.04870.480676
330.0506860.39260.347997
34-0.094311-0.73050.233955
35-0.012116-0.09390.462769
36-0.054049-0.41870.338478


Parameters (Session):
par1 = 36 ; par2 = -0.3 ; par3 = 0 ; par4 = 1 ; par5 = 12 ;
Parameters (R input):
par1 = 36 ; par2 = -0.3 ; par3 = 0 ; par4 = 1 ; par5 = 12 ;
R code (references can be found in the software module):
if (par1 == 'Default') {
par1 = 10*log10(length(x))
} else {
par1 <- as.numeric(par1)
}
par2 <- as.numeric(par2)
par3 <- as.numeric(par3)
par4 <- as.numeric(par4)
par5 <- as.numeric(par5)
if (par2 == 0) {
x <- log(x)
} else {
x <- (x ^ par2 - 1) / par2
}
if (par3 > 0) x <- diff(x,lag=1,difference=par3)
if (par4 > 0) x <- diff(x,lag=par5,difference=par4)
bitmap(file='pic1.png')
racf <- acf(x,par1,main='Autocorrelation',xlab='lags',ylab='ACF')
dev.off()
bitmap(file='pic2.png')
rpacf <- pacf(x,par1,main='Partial Autocorrelation',xlab='lags',ylab='PACF')
dev.off()
(myacf <- c(racf$acf))
(mypacf <- c(rpacf$acf))
lengthx <- length(x)
sqrtn <- sqrt(lengthx)
load(file='createtable')
a<-table.start()
a<-table.row.start(a)
a<-table.element(a,'Autocorrelation Function',4,TRUE)
a<-table.row.end(a)
a<-table.row.start(a)
a<-table.element(a,'Time lag k',header=TRUE)
a<-table.element(a,hyperlink('basics.htm','ACF(k)','click here for more information about the Autocorrelation Function'),header=TRUE)
a<-table.element(a,'T-STAT',header=TRUE)
a<-table.element(a,'P-value',header=TRUE)
a<-table.row.end(a)
for (i in 2:(par1+1)) {
a<-table.row.start(a)
a<-table.element(a,i-1,header=TRUE)
a<-table.element(a,round(myacf[i],6))
mytstat <- myacf[i]*sqrtn
a<-table.element(a,round(mytstat,4))
a<-table.element(a,round(1-pt(abs(mytstat),lengthx),6))
a<-table.row.end(a)
}
a<-table.end(a)
table.save(a,file='mytable.tab')
a<-table.start()
a<-table.row.start(a)
a<-table.element(a,'Partial Autocorrelation Function',4,TRUE)
a<-table.row.end(a)
a<-table.row.start(a)
a<-table.element(a,'Time lag k',header=TRUE)
a<-table.element(a,hyperlink('basics.htm','PACF(k)','click here for more information about the Partial Autocorrelation Function'),header=TRUE)
a<-table.element(a,'T-STAT',header=TRUE)
a<-table.element(a,'P-value',header=TRUE)
a<-table.row.end(a)
for (i in 1:par1) {
a<-table.row.start(a)
a<-table.element(a,i,header=TRUE)
a<-table.element(a,round(mypacf[i],6))
mytstat <- mypacf[i]*sqrtn
a<-table.element(a,round(mytstat,4))
a<-table.element(a,round(1-pt(abs(mytstat),lengthx),6))
a<-table.row.end(a)
}
a<-table.end(a)
table.save(a,file='mytable1.tab')