Free Statistics

of Irreproducible Research!

Author's title

Author*Unverified author*
R Software Modulerwasp_autocorrelation.wasp
Title produced by software(Partial) Autocorrelation Function
Date of computationSun, 07 Dec 2008 03:46:55 -0700
Cite this page as followsStatistical Computations at FreeStatistics.org, Office for Research Development and Education, URL https://freestatistics.org/blog/index.php?v=date/2008/Dec/07/t1228646853imgz66tvsrln6vh.htm/, Retrieved Sun, 19 May 2024 12:19:57 +0000
Statistical Computations at FreeStatistics.org, Office for Research Development and Education, URL https://freestatistics.org/blog/index.php?pk=29855, Retrieved Sun, 19 May 2024 12:19:57 +0000
QR Codes:

Original text written by user:
IsPrivate?No (this computation is public)
User-defined keywords
Estimated Impact220
Family? (F = Feedback message, R = changed R code, M = changed R Module, P = changed Parameters, D = changed Data)
-     [Univariate Data Series] [data set] [2008-12-01 19:54:57] [b98453cac15ba1066b407e146608df68]
F RMP     [(Partial) Autocorrelation Function] [] [2008-12-07 10:46:55] [d41d8cd98f00b204e9800998ecf8427e] [Current]
Feedback Forum
2008-12-13 13:34:58 [Julie Govaerts] [reply
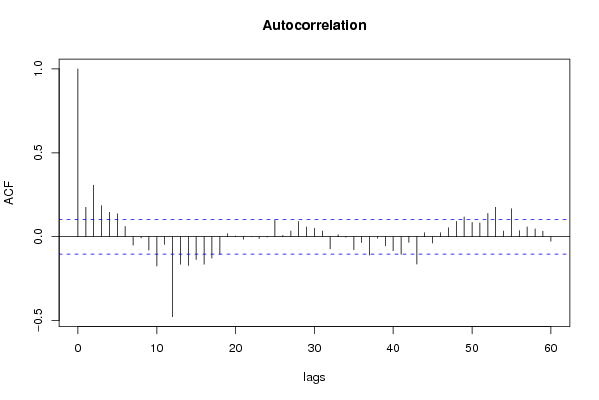
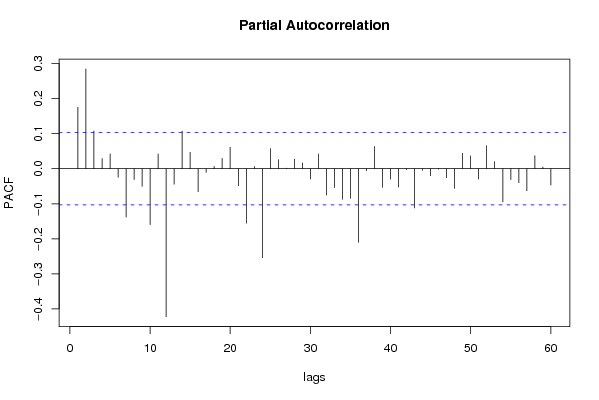
Nu is de trend volledig verdwenen en ook de saisonaliteit  het niveau is gelijk gemaakt = stationair
2008-12-16 14:30:52 [Peter Van Doninck] [reply
Wederom verkeerde lambda waarde gebruikt. De student heeft hier in één keer zowel niet seizoenaal als seizoenaan gedifferentieerd. Dit wordt eigenlijk beter uitegesplitst! Toch is dit de correcte oplossing.
2008-12-16 14:38:43 [Peter Van Doninck] [reply
Het klopt dat deze tijdreeks stationair gemaakt is, maar waarom lambda niet gelijkgesteld aan 0,5 zoals vermeld?

Post a new message
Dataseries X:
235.1
280.7
264.6
240.7
201.4
240.8
241.1
223.8
206.1
174.7
203.3
220.5
299.5
347.4
338.3
327.7
351.6
396.6
438.8
395.6
363.5
378.8
357
369
464.8
479.1
431.3
366.5
326.3
355.1
331.6
261.3
249
205.5
235.6
240.9
264.9
253.8
232.3
193.8
177
213.2
207.2
180.6
188.6
175.4
199
179.6
225.8
234
200.2
183.6
178.2
203.2
208.5
191.8
172.8
148
159.4
154.5
213.2
196.4
182.8
176.4
153.6
173.2
171
151.2
161.9
157.2
201.7
236.4
356.1
398.3
403.7
384.6
365.8
368.1
367.9
347
343.3
292.9
311.5
300.9
366.9
356.9
329.7
316.2
269
289.3
266.2
253.6
233.8
228.4
253.6
260.1
306.6
309.2
309.5
271
279.9
317.9
298.4
246.7
227.3
209.1
259.9
266
320.6
308.5
282.2
262.7
263.5
313.1
284.3
252.6
250.3
246.5
312.7
333.2
446.4
511.6
515.5
506.4
483.2
522.3
509.8
460.7
405.8
375
378.5
406.8
467.8
469.8
429.8
355.8
332.7
378
360.5
334.7
319.5
323.1
363.6
352.1
411.9
388.6
416.4
360.7
338
417.2
388.4
371.1
331.5
353.7
396.7
447
533.5
565.4
542.3
488.7
467.1
531.3
496.1
444
403.4
386.3
394.1
404.1
462.1
448.1
432.3
386.3
395.2
421.9
382.9
384.2
345.5
323.4
372.6
376
462.7
487
444.2
399.3
394.9
455.4
414
375.5
347
339.4
385.8
378.8
451.8
446.1
422.5
383.1
352.8
445.3
367.5
355.1
326.2
319.8
331.8
340.9
394.1
417.2
369.9
349.2
321.4
405.7
342.9
316.5
284.2
270.9
288.8
278.8
324.4
310.9
299
273
279.3
359.2
305
282.1
250.3
246.5
257.9
266.5
315.9
318.4
295.4
266.4
245.8
362.8
324.9
294.2
289.5
295.2
290.3
272
307.4
328.7
292.9
249.1
230.4
361.5
321.7
277.2
260.7
251
257.6
241.8
287.5
292.3
274.7
254.2
230
339
318.2
287
295.8
284
271
262.7
340.6
379.4
373.3
355.2
338.4
466.9
451
422
429.2
425.9
460.7
463.6
541.4
544.2
517.5
469.4
439.4
549
533
506.1
484
457
481.5
469.5
544.7
541.2
521.5
469.7
434.4
542.6
517.3
485.7
465.8
447
426.6
411.6
467.5
484.5
451.2
417.4
379.9
484.7
455
420.8
416.5
376.3
405.6
405.8
500.8
514
475.5
430.1
414.4
538
526
488.5
520.2
504.4
568.5
610.6
818
830.9
835.9
782
762.3
856.9
820.9
769.6
752.2
724.4
723.1
719.5
817.4
803.3
752.5
689
630.4
765.5
757.7
732.2
702.6
683.3
709.5
702.2
784.8
810.9
755.6
656.8
615.1
745.3
694.1
675.7
643.7
622.1
634.6
588
689.7
673.9
647.9
568.8
545.7
632.6
643.8
593.1
579.7
546
562.9
572.5


Summary of computational transaction
Raw Inputview raw input (R code)
Raw Outputview raw output of R engine
Computing time1 seconds
R Server'George Udny Yule' @ 72.249.76.132

\begin{tabular}{lllllllll}
\hline
Summary of computational transaction \tabularnewline
Raw Input & view raw input (R code)  \tabularnewline
Raw Output & view raw output of R engine  \tabularnewline
Computing time & 1 seconds \tabularnewline
R Server & 'George Udny Yule' @ 72.249.76.132 \tabularnewline
\hline
\end{tabular}
%Source: https://freestatistics.org/blog/index.php?pk=29855&T=0

[TABLE]
[ROW][C]Summary of computational transaction[/C][/ROW]
[ROW][C]Raw Input[/C][C]view raw input (R code) [/C][/ROW]
[ROW][C]Raw Output[/C][C]view raw output of R engine [/C][/ROW]
[ROW][C]Computing time[/C][C]1 seconds[/C][/ROW]
[ROW][C]R Server[/C][C]'George Udny Yule' @ 72.249.76.132[/C][/ROW]
[/TABLE]
Source: https://freestatistics.org/blog/index.php?pk=29855&T=0

Globally Unique Identifier (entire table): ba.freestatistics.org/blog/index.php?pk=29855&T=0

As an alternative you can also use a QR Code:  

The GUIDs for individual cells are displayed in the table below:

Summary of computational transaction
Raw Inputview raw input (R code)
Raw Outputview raw output of R engine
Computing time1 seconds
R Server'George Udny Yule' @ 72.249.76.132


Autocorrelation Function
Time lag kACF(k)T-STATP-value
10.1752783.3210.000494
20.3068035.81310
30.1844343.49450.000267
40.145262.75230.003109
50.1364272.58490.005067
60.0610221.15620.124183
7-0.050731-0.96120.168546
8-0.007436-0.14090.444017
9-0.079927-1.51440.065401
10-0.174831-3.31260.000509
11-0.046133-0.87410.191326
12-0.476916-9.03630
13-0.164363-3.11420.000996
14-0.17172-3.25360.000624
15-0.136172-2.58010.005137
16-0.163867-3.10480.001028
17-0.127264-2.41130.008199
18-0.105195-1.99320.0235
190.0177480.33630.368432
200.0032250.06110.475657
21-0.015383-0.29150.385434
22-0.001117-0.02120.491562
23-0.010267-0.19450.422933
24-0.002458-0.04660.481439
250.0999791.89430.029492
260.0071410.13530.446221
270.0330960.62710.265503
280.0905341.71540.04357
290.0577991.09510.137098
300.0494620.93720.174651
310.0337750.63990.261309
32-0.072609-1.37570.08488
330.0112280.21270.415825
34-0.003363-0.06370.474617
35-0.077708-1.47240.0709
36-0.035494-0.67250.250842
37-0.109588-2.07640.019284
38-0.009189-0.17410.430942
39-0.054097-1.0250.15303
40-0.083472-1.58160.057315
41-0.105339-1.99590.023351
42-0.033705-0.63860.261738
43-0.1635-3.09790.001051
440.0239490.45380.325132
45-0.037912-0.71830.236512
460.0233870.44310.328976
470.0527210.99890.159253
480.0905781.71620.043493
490.1176472.22910.013213
500.0849071.60880.054274
510.0815491.54510.061598
520.1386882.62780.004482
530.1752223.320.000496
540.0332330.62970.264656
550.1660883.14690.000894
560.0356970.67640.249622
570.0580641.10020.135999
580.0462820.87690.190558
590.0328540.62250.267005
60-0.026682-0.50550.306744

\begin{tabular}{lllllllll}
\hline
Autocorrelation Function \tabularnewline
Time lag k & ACF(k) & T-STAT & P-value \tabularnewline
1 & 0.175278 & 3.321 & 0.000494 \tabularnewline
2 & 0.306803 & 5.8131 & 0 \tabularnewline
3 & 0.184434 & 3.4945 & 0.000267 \tabularnewline
4 & 0.14526 & 2.7523 & 0.003109 \tabularnewline
5 & 0.136427 & 2.5849 & 0.005067 \tabularnewline
6 & 0.061022 & 1.1562 & 0.124183 \tabularnewline
7 & -0.050731 & -0.9612 & 0.168546 \tabularnewline
8 & -0.007436 & -0.1409 & 0.444017 \tabularnewline
9 & -0.079927 & -1.5144 & 0.065401 \tabularnewline
10 & -0.174831 & -3.3126 & 0.000509 \tabularnewline
11 & -0.046133 & -0.8741 & 0.191326 \tabularnewline
12 & -0.476916 & -9.0363 & 0 \tabularnewline
13 & -0.164363 & -3.1142 & 0.000996 \tabularnewline
14 & -0.17172 & -3.2536 & 0.000624 \tabularnewline
15 & -0.136172 & -2.5801 & 0.005137 \tabularnewline
16 & -0.163867 & -3.1048 & 0.001028 \tabularnewline
17 & -0.127264 & -2.4113 & 0.008199 \tabularnewline
18 & -0.105195 & -1.9932 & 0.0235 \tabularnewline
19 & 0.017748 & 0.3363 & 0.368432 \tabularnewline
20 & 0.003225 & 0.0611 & 0.475657 \tabularnewline
21 & -0.015383 & -0.2915 & 0.385434 \tabularnewline
22 & -0.001117 & -0.0212 & 0.491562 \tabularnewline
23 & -0.010267 & -0.1945 & 0.422933 \tabularnewline
24 & -0.002458 & -0.0466 & 0.481439 \tabularnewline
25 & 0.099979 & 1.8943 & 0.029492 \tabularnewline
26 & 0.007141 & 0.1353 & 0.446221 \tabularnewline
27 & 0.033096 & 0.6271 & 0.265503 \tabularnewline
28 & 0.090534 & 1.7154 & 0.04357 \tabularnewline
29 & 0.057799 & 1.0951 & 0.137098 \tabularnewline
30 & 0.049462 & 0.9372 & 0.174651 \tabularnewline
31 & 0.033775 & 0.6399 & 0.261309 \tabularnewline
32 & -0.072609 & -1.3757 & 0.08488 \tabularnewline
33 & 0.011228 & 0.2127 & 0.415825 \tabularnewline
34 & -0.003363 & -0.0637 & 0.474617 \tabularnewline
35 & -0.077708 & -1.4724 & 0.0709 \tabularnewline
36 & -0.035494 & -0.6725 & 0.250842 \tabularnewline
37 & -0.109588 & -2.0764 & 0.019284 \tabularnewline
38 & -0.009189 & -0.1741 & 0.430942 \tabularnewline
39 & -0.054097 & -1.025 & 0.15303 \tabularnewline
40 & -0.083472 & -1.5816 & 0.057315 \tabularnewline
41 & -0.105339 & -1.9959 & 0.023351 \tabularnewline
42 & -0.033705 & -0.6386 & 0.261738 \tabularnewline
43 & -0.1635 & -3.0979 & 0.001051 \tabularnewline
44 & 0.023949 & 0.4538 & 0.325132 \tabularnewline
45 & -0.037912 & -0.7183 & 0.236512 \tabularnewline
46 & 0.023387 & 0.4431 & 0.328976 \tabularnewline
47 & 0.052721 & 0.9989 & 0.159253 \tabularnewline
48 & 0.090578 & 1.7162 & 0.043493 \tabularnewline
49 & 0.117647 & 2.2291 & 0.013213 \tabularnewline
50 & 0.084907 & 1.6088 & 0.054274 \tabularnewline
51 & 0.081549 & 1.5451 & 0.061598 \tabularnewline
52 & 0.138688 & 2.6278 & 0.004482 \tabularnewline
53 & 0.175222 & 3.32 & 0.000496 \tabularnewline
54 & 0.033233 & 0.6297 & 0.264656 \tabularnewline
55 & 0.166088 & 3.1469 & 0.000894 \tabularnewline
56 & 0.035697 & 0.6764 & 0.249622 \tabularnewline
57 & 0.058064 & 1.1002 & 0.135999 \tabularnewline
58 & 0.046282 & 0.8769 & 0.190558 \tabularnewline
59 & 0.032854 & 0.6225 & 0.267005 \tabularnewline
60 & -0.026682 & -0.5055 & 0.306744 \tabularnewline
\hline
\end{tabular}
%Source: https://freestatistics.org/blog/index.php?pk=29855&T=1

[TABLE]
[ROW][C]Autocorrelation Function[/C][/ROW]
[ROW][C]Time lag k[/C][C]ACF(k)[/C][C]T-STAT[/C][C]P-value[/C][/ROW]
[ROW][C]1[/C][C]0.175278[/C][C]3.321[/C][C]0.000494[/C][/ROW]
[ROW][C]2[/C][C]0.306803[/C][C]5.8131[/C][C]0[/C][/ROW]
[ROW][C]3[/C][C]0.184434[/C][C]3.4945[/C][C]0.000267[/C][/ROW]
[ROW][C]4[/C][C]0.14526[/C][C]2.7523[/C][C]0.003109[/C][/ROW]
[ROW][C]5[/C][C]0.136427[/C][C]2.5849[/C][C]0.005067[/C][/ROW]
[ROW][C]6[/C][C]0.061022[/C][C]1.1562[/C][C]0.124183[/C][/ROW]
[ROW][C]7[/C][C]-0.050731[/C][C]-0.9612[/C][C]0.168546[/C][/ROW]
[ROW][C]8[/C][C]-0.007436[/C][C]-0.1409[/C][C]0.444017[/C][/ROW]
[ROW][C]9[/C][C]-0.079927[/C][C]-1.5144[/C][C]0.065401[/C][/ROW]
[ROW][C]10[/C][C]-0.174831[/C][C]-3.3126[/C][C]0.000509[/C][/ROW]
[ROW][C]11[/C][C]-0.046133[/C][C]-0.8741[/C][C]0.191326[/C][/ROW]
[ROW][C]12[/C][C]-0.476916[/C][C]-9.0363[/C][C]0[/C][/ROW]
[ROW][C]13[/C][C]-0.164363[/C][C]-3.1142[/C][C]0.000996[/C][/ROW]
[ROW][C]14[/C][C]-0.17172[/C][C]-3.2536[/C][C]0.000624[/C][/ROW]
[ROW][C]15[/C][C]-0.136172[/C][C]-2.5801[/C][C]0.005137[/C][/ROW]
[ROW][C]16[/C][C]-0.163867[/C][C]-3.1048[/C][C]0.001028[/C][/ROW]
[ROW][C]17[/C][C]-0.127264[/C][C]-2.4113[/C][C]0.008199[/C][/ROW]
[ROW][C]18[/C][C]-0.105195[/C][C]-1.9932[/C][C]0.0235[/C][/ROW]
[ROW][C]19[/C][C]0.017748[/C][C]0.3363[/C][C]0.368432[/C][/ROW]
[ROW][C]20[/C][C]0.003225[/C][C]0.0611[/C][C]0.475657[/C][/ROW]
[ROW][C]21[/C][C]-0.015383[/C][C]-0.2915[/C][C]0.385434[/C][/ROW]
[ROW][C]22[/C][C]-0.001117[/C][C]-0.0212[/C][C]0.491562[/C][/ROW]
[ROW][C]23[/C][C]-0.010267[/C][C]-0.1945[/C][C]0.422933[/C][/ROW]
[ROW][C]24[/C][C]-0.002458[/C][C]-0.0466[/C][C]0.481439[/C][/ROW]
[ROW][C]25[/C][C]0.099979[/C][C]1.8943[/C][C]0.029492[/C][/ROW]
[ROW][C]26[/C][C]0.007141[/C][C]0.1353[/C][C]0.446221[/C][/ROW]
[ROW][C]27[/C][C]0.033096[/C][C]0.6271[/C][C]0.265503[/C][/ROW]
[ROW][C]28[/C][C]0.090534[/C][C]1.7154[/C][C]0.04357[/C][/ROW]
[ROW][C]29[/C][C]0.057799[/C][C]1.0951[/C][C]0.137098[/C][/ROW]
[ROW][C]30[/C][C]0.049462[/C][C]0.9372[/C][C]0.174651[/C][/ROW]
[ROW][C]31[/C][C]0.033775[/C][C]0.6399[/C][C]0.261309[/C][/ROW]
[ROW][C]32[/C][C]-0.072609[/C][C]-1.3757[/C][C]0.08488[/C][/ROW]
[ROW][C]33[/C][C]0.011228[/C][C]0.2127[/C][C]0.415825[/C][/ROW]
[ROW][C]34[/C][C]-0.003363[/C][C]-0.0637[/C][C]0.474617[/C][/ROW]
[ROW][C]35[/C][C]-0.077708[/C][C]-1.4724[/C][C]0.0709[/C][/ROW]
[ROW][C]36[/C][C]-0.035494[/C][C]-0.6725[/C][C]0.250842[/C][/ROW]
[ROW][C]37[/C][C]-0.109588[/C][C]-2.0764[/C][C]0.019284[/C][/ROW]
[ROW][C]38[/C][C]-0.009189[/C][C]-0.1741[/C][C]0.430942[/C][/ROW]
[ROW][C]39[/C][C]-0.054097[/C][C]-1.025[/C][C]0.15303[/C][/ROW]
[ROW][C]40[/C][C]-0.083472[/C][C]-1.5816[/C][C]0.057315[/C][/ROW]
[ROW][C]41[/C][C]-0.105339[/C][C]-1.9959[/C][C]0.023351[/C][/ROW]
[ROW][C]42[/C][C]-0.033705[/C][C]-0.6386[/C][C]0.261738[/C][/ROW]
[ROW][C]43[/C][C]-0.1635[/C][C]-3.0979[/C][C]0.001051[/C][/ROW]
[ROW][C]44[/C][C]0.023949[/C][C]0.4538[/C][C]0.325132[/C][/ROW]
[ROW][C]45[/C][C]-0.037912[/C][C]-0.7183[/C][C]0.236512[/C][/ROW]
[ROW][C]46[/C][C]0.023387[/C][C]0.4431[/C][C]0.328976[/C][/ROW]
[ROW][C]47[/C][C]0.052721[/C][C]0.9989[/C][C]0.159253[/C][/ROW]
[ROW][C]48[/C][C]0.090578[/C][C]1.7162[/C][C]0.043493[/C][/ROW]
[ROW][C]49[/C][C]0.117647[/C][C]2.2291[/C][C]0.013213[/C][/ROW]
[ROW][C]50[/C][C]0.084907[/C][C]1.6088[/C][C]0.054274[/C][/ROW]
[ROW][C]51[/C][C]0.081549[/C][C]1.5451[/C][C]0.061598[/C][/ROW]
[ROW][C]52[/C][C]0.138688[/C][C]2.6278[/C][C]0.004482[/C][/ROW]
[ROW][C]53[/C][C]0.175222[/C][C]3.32[/C][C]0.000496[/C][/ROW]
[ROW][C]54[/C][C]0.033233[/C][C]0.6297[/C][C]0.264656[/C][/ROW]
[ROW][C]55[/C][C]0.166088[/C][C]3.1469[/C][C]0.000894[/C][/ROW]
[ROW][C]56[/C][C]0.035697[/C][C]0.6764[/C][C]0.249622[/C][/ROW]
[ROW][C]57[/C][C]0.058064[/C][C]1.1002[/C][C]0.135999[/C][/ROW]
[ROW][C]58[/C][C]0.046282[/C][C]0.8769[/C][C]0.190558[/C][/ROW]
[ROW][C]59[/C][C]0.032854[/C][C]0.6225[/C][C]0.267005[/C][/ROW]
[ROW][C]60[/C][C]-0.026682[/C][C]-0.5055[/C][C]0.306744[/C][/ROW]
[/TABLE]
Source: https://freestatistics.org/blog/index.php?pk=29855&T=1

Globally Unique Identifier (entire table): ba.freestatistics.org/blog/index.php?pk=29855&T=1

As an alternative you can also use a QR Code:  

The GUIDs for individual cells are displayed in the table below:

Autocorrelation Function
Time lag kACF(k)T-STATP-value
10.1752783.3210.000494
20.3068035.81310
30.1844343.49450.000267
40.145262.75230.003109
50.1364272.58490.005067
60.0610221.15620.124183
7-0.050731-0.96120.168546
8-0.007436-0.14090.444017
9-0.079927-1.51440.065401
10-0.174831-3.31260.000509
11-0.046133-0.87410.191326
12-0.476916-9.03630
13-0.164363-3.11420.000996
14-0.17172-3.25360.000624
15-0.136172-2.58010.005137
16-0.163867-3.10480.001028
17-0.127264-2.41130.008199
18-0.105195-1.99320.0235
190.0177480.33630.368432
200.0032250.06110.475657
21-0.015383-0.29150.385434
22-0.001117-0.02120.491562
23-0.010267-0.19450.422933
24-0.002458-0.04660.481439
250.0999791.89430.029492
260.0071410.13530.446221
270.0330960.62710.265503
280.0905341.71540.04357
290.0577991.09510.137098
300.0494620.93720.174651
310.0337750.63990.261309
32-0.072609-1.37570.08488
330.0112280.21270.415825
34-0.003363-0.06370.474617
35-0.077708-1.47240.0709
36-0.035494-0.67250.250842
37-0.109588-2.07640.019284
38-0.009189-0.17410.430942
39-0.054097-1.0250.15303
40-0.083472-1.58160.057315
41-0.105339-1.99590.023351
42-0.033705-0.63860.261738
43-0.1635-3.09790.001051
440.0239490.45380.325132
45-0.037912-0.71830.236512
460.0233870.44310.328976
470.0527210.99890.159253
480.0905781.71620.043493
490.1176472.22910.013213
500.0849071.60880.054274
510.0815491.54510.061598
520.1386882.62780.004482
530.1752223.320.000496
540.0332330.62970.264656
550.1660883.14690.000894
560.0356970.67640.249622
570.0580641.10020.135999
580.0462820.87690.190558
590.0328540.62250.267005
60-0.026682-0.50550.306744


Partial Autocorrelation Function
Time lag kPACF(k)T-STATP-value
10.1752783.3210.000494
20.2848315.39680
30.1078442.04340.020874
40.0291530.55240.290517
50.0423020.80150.211685
6-0.024381-0.4620.322198
7-0.137788-2.61070.004707
8-0.030739-0.58240.280323
9-0.050056-0.94840.171777
10-0.159388-3.020.001355
110.0417140.79040.214918
12-0.422224-80
13-0.044203-0.83750.201429
140.1075642.0380.021139
150.0467250.88530.188292
16-0.065466-1.24040.107818
17-0.010171-0.19270.423643
180.0065090.12330.450959
190.0293870.55680.289004
200.0613071.16160.123084
21-0.048452-0.9180.17961
22-0.155409-2.94460.001722
230.0065020.12320.451008
24-0.253997-4.81251e-06
250.0576711.09270.137626
260.0257820.48850.312749
270.0015520.02940.488277
280.0273490.51820.302321
290.0165330.31330.377131
30-0.029202-0.55330.290204
310.041790.79180.214496
32-0.075172-1.42430.077614
33-0.053731-1.01810.154669
34-0.087263-1.65340.049563
35-0.08393-1.59020.05633
36-0.210182-3.98244.1e-05
37-0.005922-0.11220.455358
380.0633431.20020.115432
39-0.05345-1.01270.155934
40-0.029687-0.56250.287069
41-0.052421-0.99320.160633
42-0.002404-0.04550.48185
43-0.111941-2.1210.017304
44-0.004508-0.08540.465988
45-0.019826-0.37560.353703
46-0.001122-0.02130.491525
47-0.025458-0.48240.314925
48-0.056383-1.06830.143052
490.0440240.83410.202377
500.0363680.68910.245613
51-0.029473-0.55840.28845
520.0655121.24130.107659
530.0203870.38630.349759
54-0.094724-1.79480.036766
55-0.031072-0.58870.278205
56-0.039711-0.75240.226149
57-0.062938-1.19250.116924
580.0374020.70870.239495
590.0048450.09180.463457
60-0.046568-0.88230.189091

\begin{tabular}{lllllllll}
\hline
Partial Autocorrelation Function \tabularnewline
Time lag k & PACF(k) & T-STAT & P-value \tabularnewline
1 & 0.175278 & 3.321 & 0.000494 \tabularnewline
2 & 0.284831 & 5.3968 & 0 \tabularnewline
3 & 0.107844 & 2.0434 & 0.020874 \tabularnewline
4 & 0.029153 & 0.5524 & 0.290517 \tabularnewline
5 & 0.042302 & 0.8015 & 0.211685 \tabularnewline
6 & -0.024381 & -0.462 & 0.322198 \tabularnewline
7 & -0.137788 & -2.6107 & 0.004707 \tabularnewline
8 & -0.030739 & -0.5824 & 0.280323 \tabularnewline
9 & -0.050056 & -0.9484 & 0.171777 \tabularnewline
10 & -0.159388 & -3.02 & 0.001355 \tabularnewline
11 & 0.041714 & 0.7904 & 0.214918 \tabularnewline
12 & -0.422224 & -8 & 0 \tabularnewline
13 & -0.044203 & -0.8375 & 0.201429 \tabularnewline
14 & 0.107564 & 2.038 & 0.021139 \tabularnewline
15 & 0.046725 & 0.8853 & 0.188292 \tabularnewline
16 & -0.065466 & -1.2404 & 0.107818 \tabularnewline
17 & -0.010171 & -0.1927 & 0.423643 \tabularnewline
18 & 0.006509 & 0.1233 & 0.450959 \tabularnewline
19 & 0.029387 & 0.5568 & 0.289004 \tabularnewline
20 & 0.061307 & 1.1616 & 0.123084 \tabularnewline
21 & -0.048452 & -0.918 & 0.17961 \tabularnewline
22 & -0.155409 & -2.9446 & 0.001722 \tabularnewline
23 & 0.006502 & 0.1232 & 0.451008 \tabularnewline
24 & -0.253997 & -4.8125 & 1e-06 \tabularnewline
25 & 0.057671 & 1.0927 & 0.137626 \tabularnewline
26 & 0.025782 & 0.4885 & 0.312749 \tabularnewline
27 & 0.001552 & 0.0294 & 0.488277 \tabularnewline
28 & 0.027349 & 0.5182 & 0.302321 \tabularnewline
29 & 0.016533 & 0.3133 & 0.377131 \tabularnewline
30 & -0.029202 & -0.5533 & 0.290204 \tabularnewline
31 & 0.04179 & 0.7918 & 0.214496 \tabularnewline
32 & -0.075172 & -1.4243 & 0.077614 \tabularnewline
33 & -0.053731 & -1.0181 & 0.154669 \tabularnewline
34 & -0.087263 & -1.6534 & 0.049563 \tabularnewline
35 & -0.08393 & -1.5902 & 0.05633 \tabularnewline
36 & -0.210182 & -3.9824 & 4.1e-05 \tabularnewline
37 & -0.005922 & -0.1122 & 0.455358 \tabularnewline
38 & 0.063343 & 1.2002 & 0.115432 \tabularnewline
39 & -0.05345 & -1.0127 & 0.155934 \tabularnewline
40 & -0.029687 & -0.5625 & 0.287069 \tabularnewline
41 & -0.052421 & -0.9932 & 0.160633 \tabularnewline
42 & -0.002404 & -0.0455 & 0.48185 \tabularnewline
43 & -0.111941 & -2.121 & 0.017304 \tabularnewline
44 & -0.004508 & -0.0854 & 0.465988 \tabularnewline
45 & -0.019826 & -0.3756 & 0.353703 \tabularnewline
46 & -0.001122 & -0.0213 & 0.491525 \tabularnewline
47 & -0.025458 & -0.4824 & 0.314925 \tabularnewline
48 & -0.056383 & -1.0683 & 0.143052 \tabularnewline
49 & 0.044024 & 0.8341 & 0.202377 \tabularnewline
50 & 0.036368 & 0.6891 & 0.245613 \tabularnewline
51 & -0.029473 & -0.5584 & 0.28845 \tabularnewline
52 & 0.065512 & 1.2413 & 0.107659 \tabularnewline
53 & 0.020387 & 0.3863 & 0.349759 \tabularnewline
54 & -0.094724 & -1.7948 & 0.036766 \tabularnewline
55 & -0.031072 & -0.5887 & 0.278205 \tabularnewline
56 & -0.039711 & -0.7524 & 0.226149 \tabularnewline
57 & -0.062938 & -1.1925 & 0.116924 \tabularnewline
58 & 0.037402 & 0.7087 & 0.239495 \tabularnewline
59 & 0.004845 & 0.0918 & 0.463457 \tabularnewline
60 & -0.046568 & -0.8823 & 0.189091 \tabularnewline
\hline
\end{tabular}
%Source: https://freestatistics.org/blog/index.php?pk=29855&T=2

[TABLE]
[ROW][C]Partial Autocorrelation Function[/C][/ROW]
[ROW][C]Time lag k[/C][C]PACF(k)[/C][C]T-STAT[/C][C]P-value[/C][/ROW]
[ROW][C]1[/C][C]0.175278[/C][C]3.321[/C][C]0.000494[/C][/ROW]
[ROW][C]2[/C][C]0.284831[/C][C]5.3968[/C][C]0[/C][/ROW]
[ROW][C]3[/C][C]0.107844[/C][C]2.0434[/C][C]0.020874[/C][/ROW]
[ROW][C]4[/C][C]0.029153[/C][C]0.5524[/C][C]0.290517[/C][/ROW]
[ROW][C]5[/C][C]0.042302[/C][C]0.8015[/C][C]0.211685[/C][/ROW]
[ROW][C]6[/C][C]-0.024381[/C][C]-0.462[/C][C]0.322198[/C][/ROW]
[ROW][C]7[/C][C]-0.137788[/C][C]-2.6107[/C][C]0.004707[/C][/ROW]
[ROW][C]8[/C][C]-0.030739[/C][C]-0.5824[/C][C]0.280323[/C][/ROW]
[ROW][C]9[/C][C]-0.050056[/C][C]-0.9484[/C][C]0.171777[/C][/ROW]
[ROW][C]10[/C][C]-0.159388[/C][C]-3.02[/C][C]0.001355[/C][/ROW]
[ROW][C]11[/C][C]0.041714[/C][C]0.7904[/C][C]0.214918[/C][/ROW]
[ROW][C]12[/C][C]-0.422224[/C][C]-8[/C][C]0[/C][/ROW]
[ROW][C]13[/C][C]-0.044203[/C][C]-0.8375[/C][C]0.201429[/C][/ROW]
[ROW][C]14[/C][C]0.107564[/C][C]2.038[/C][C]0.021139[/C][/ROW]
[ROW][C]15[/C][C]0.046725[/C][C]0.8853[/C][C]0.188292[/C][/ROW]
[ROW][C]16[/C][C]-0.065466[/C][C]-1.2404[/C][C]0.107818[/C][/ROW]
[ROW][C]17[/C][C]-0.010171[/C][C]-0.1927[/C][C]0.423643[/C][/ROW]
[ROW][C]18[/C][C]0.006509[/C][C]0.1233[/C][C]0.450959[/C][/ROW]
[ROW][C]19[/C][C]0.029387[/C][C]0.5568[/C][C]0.289004[/C][/ROW]
[ROW][C]20[/C][C]0.061307[/C][C]1.1616[/C][C]0.123084[/C][/ROW]
[ROW][C]21[/C][C]-0.048452[/C][C]-0.918[/C][C]0.17961[/C][/ROW]
[ROW][C]22[/C][C]-0.155409[/C][C]-2.9446[/C][C]0.001722[/C][/ROW]
[ROW][C]23[/C][C]0.006502[/C][C]0.1232[/C][C]0.451008[/C][/ROW]
[ROW][C]24[/C][C]-0.253997[/C][C]-4.8125[/C][C]1e-06[/C][/ROW]
[ROW][C]25[/C][C]0.057671[/C][C]1.0927[/C][C]0.137626[/C][/ROW]
[ROW][C]26[/C][C]0.025782[/C][C]0.4885[/C][C]0.312749[/C][/ROW]
[ROW][C]27[/C][C]0.001552[/C][C]0.0294[/C][C]0.488277[/C][/ROW]
[ROW][C]28[/C][C]0.027349[/C][C]0.5182[/C][C]0.302321[/C][/ROW]
[ROW][C]29[/C][C]0.016533[/C][C]0.3133[/C][C]0.377131[/C][/ROW]
[ROW][C]30[/C][C]-0.029202[/C][C]-0.5533[/C][C]0.290204[/C][/ROW]
[ROW][C]31[/C][C]0.04179[/C][C]0.7918[/C][C]0.214496[/C][/ROW]
[ROW][C]32[/C][C]-0.075172[/C][C]-1.4243[/C][C]0.077614[/C][/ROW]
[ROW][C]33[/C][C]-0.053731[/C][C]-1.0181[/C][C]0.154669[/C][/ROW]
[ROW][C]34[/C][C]-0.087263[/C][C]-1.6534[/C][C]0.049563[/C][/ROW]
[ROW][C]35[/C][C]-0.08393[/C][C]-1.5902[/C][C]0.05633[/C][/ROW]
[ROW][C]36[/C][C]-0.210182[/C][C]-3.9824[/C][C]4.1e-05[/C][/ROW]
[ROW][C]37[/C][C]-0.005922[/C][C]-0.1122[/C][C]0.455358[/C][/ROW]
[ROW][C]38[/C][C]0.063343[/C][C]1.2002[/C][C]0.115432[/C][/ROW]
[ROW][C]39[/C][C]-0.05345[/C][C]-1.0127[/C][C]0.155934[/C][/ROW]
[ROW][C]40[/C][C]-0.029687[/C][C]-0.5625[/C][C]0.287069[/C][/ROW]
[ROW][C]41[/C][C]-0.052421[/C][C]-0.9932[/C][C]0.160633[/C][/ROW]
[ROW][C]42[/C][C]-0.002404[/C][C]-0.0455[/C][C]0.48185[/C][/ROW]
[ROW][C]43[/C][C]-0.111941[/C][C]-2.121[/C][C]0.017304[/C][/ROW]
[ROW][C]44[/C][C]-0.004508[/C][C]-0.0854[/C][C]0.465988[/C][/ROW]
[ROW][C]45[/C][C]-0.019826[/C][C]-0.3756[/C][C]0.353703[/C][/ROW]
[ROW][C]46[/C][C]-0.001122[/C][C]-0.0213[/C][C]0.491525[/C][/ROW]
[ROW][C]47[/C][C]-0.025458[/C][C]-0.4824[/C][C]0.314925[/C][/ROW]
[ROW][C]48[/C][C]-0.056383[/C][C]-1.0683[/C][C]0.143052[/C][/ROW]
[ROW][C]49[/C][C]0.044024[/C][C]0.8341[/C][C]0.202377[/C][/ROW]
[ROW][C]50[/C][C]0.036368[/C][C]0.6891[/C][C]0.245613[/C][/ROW]
[ROW][C]51[/C][C]-0.029473[/C][C]-0.5584[/C][C]0.28845[/C][/ROW]
[ROW][C]52[/C][C]0.065512[/C][C]1.2413[/C][C]0.107659[/C][/ROW]
[ROW][C]53[/C][C]0.020387[/C][C]0.3863[/C][C]0.349759[/C][/ROW]
[ROW][C]54[/C][C]-0.094724[/C][C]-1.7948[/C][C]0.036766[/C][/ROW]
[ROW][C]55[/C][C]-0.031072[/C][C]-0.5887[/C][C]0.278205[/C][/ROW]
[ROW][C]56[/C][C]-0.039711[/C][C]-0.7524[/C][C]0.226149[/C][/ROW]
[ROW][C]57[/C][C]-0.062938[/C][C]-1.1925[/C][C]0.116924[/C][/ROW]
[ROW][C]58[/C][C]0.037402[/C][C]0.7087[/C][C]0.239495[/C][/ROW]
[ROW][C]59[/C][C]0.004845[/C][C]0.0918[/C][C]0.463457[/C][/ROW]
[ROW][C]60[/C][C]-0.046568[/C][C]-0.8823[/C][C]0.189091[/C][/ROW]
[/TABLE]
Source: https://freestatistics.org/blog/index.php?pk=29855&T=2

Globally Unique Identifier (entire table): ba.freestatistics.org/blog/index.php?pk=29855&T=2

As an alternative you can also use a QR Code:  

The GUIDs for individual cells are displayed in the table below:

Partial Autocorrelation Function
Time lag kPACF(k)T-STATP-value
10.1752783.3210.000494
20.2848315.39680
30.1078442.04340.020874
40.0291530.55240.290517
50.0423020.80150.211685
6-0.024381-0.4620.322198
7-0.137788-2.61070.004707
8-0.030739-0.58240.280323
9-0.050056-0.94840.171777
10-0.159388-3.020.001355
110.0417140.79040.214918
12-0.422224-80
13-0.044203-0.83750.201429
140.1075642.0380.021139
150.0467250.88530.188292
16-0.065466-1.24040.107818
17-0.010171-0.19270.423643
180.0065090.12330.450959
190.0293870.55680.289004
200.0613071.16160.123084
21-0.048452-0.9180.17961
22-0.155409-2.94460.001722
230.0065020.12320.451008
24-0.253997-4.81251e-06
250.0576711.09270.137626
260.0257820.48850.312749
270.0015520.02940.488277
280.0273490.51820.302321
290.0165330.31330.377131
30-0.029202-0.55330.290204
310.041790.79180.214496
32-0.075172-1.42430.077614
33-0.053731-1.01810.154669
34-0.087263-1.65340.049563
35-0.08393-1.59020.05633
36-0.210182-3.98244.1e-05
37-0.005922-0.11220.455358
380.0633431.20020.115432
39-0.05345-1.01270.155934
40-0.029687-0.56250.287069
41-0.052421-0.99320.160633
42-0.002404-0.04550.48185
43-0.111941-2.1210.017304
44-0.004508-0.08540.465988
45-0.019826-0.37560.353703
46-0.001122-0.02130.491525
47-0.025458-0.48240.314925
48-0.056383-1.06830.143052
490.0440240.83410.202377
500.0363680.68910.245613
51-0.029473-0.55840.28845
520.0655121.24130.107659
530.0203870.38630.349759
54-0.094724-1.79480.036766
55-0.031072-0.58870.278205
56-0.039711-0.75240.226149
57-0.062938-1.19250.116924
580.0374020.70870.239495
590.0048450.09180.463457
60-0.046568-0.88230.189091


Parameters (Session):
par1 = 60 ; par2 = 0.3 ; par3 = 1 ; par4 = 1 ; par5 = 12 ;
Parameters (R input):
par1 = 60 ; par2 = 0.3 ; par3 = 1 ; par4 = 1 ; par5 = 12 ;
R code (references can be found in the software module):
if (par1 == 'Default') {
par1 = 10*log10(length(x))
} else {
par1 <- as.numeric(par1)
}
par2 <- as.numeric(par2)
par3 <- as.numeric(par3)
par4 <- as.numeric(par4)
par5 <- as.numeric(par5)
if (par2 == 0) {
x <- log(x)
} else {
x <- (x ^ par2 - 1) / par2
}
if (par3 > 0) x <- diff(x,lag=1,difference=par3)
if (par4 > 0) x <- diff(x,lag=par5,difference=par4)
bitmap(file='pic1.png')
racf <- acf(x,par1,main='Autocorrelation',xlab='lags',ylab='ACF')
dev.off()
bitmap(file='pic2.png')
rpacf <- pacf(x,par1,main='Partial Autocorrelation',xlab='lags',ylab='PACF')
dev.off()
(myacf <- c(racf$acf))
(mypacf <- c(rpacf$acf))
lengthx <- length(x)
sqrtn <- sqrt(lengthx)
load(file='createtable')
a<-table.start()
a<-table.row.start(a)
a<-table.element(a,'Autocorrelation Function',4,TRUE)
a<-table.row.end(a)
a<-table.row.start(a)
a<-table.element(a,'Time lag k',header=TRUE)
a<-table.element(a,hyperlink('basics.htm','ACF(k)','click here for more information about the Autocorrelation Function'),header=TRUE)
a<-table.element(a,'T-STAT',header=TRUE)
a<-table.element(a,'P-value',header=TRUE)
a<-table.row.end(a)
for (i in 2:(par1+1)) {
a<-table.row.start(a)
a<-table.element(a,i-1,header=TRUE)
a<-table.element(a,round(myacf[i],6))
mytstat <- myacf[i]*sqrtn
a<-table.element(a,round(mytstat,4))
a<-table.element(a,round(1-pt(abs(mytstat),lengthx),6))
a<-table.row.end(a)
}
a<-table.end(a)
table.save(a,file='mytable.tab')
a<-table.start()
a<-table.row.start(a)
a<-table.element(a,'Partial Autocorrelation Function',4,TRUE)
a<-table.row.end(a)
a<-table.row.start(a)
a<-table.element(a,'Time lag k',header=TRUE)
a<-table.element(a,hyperlink('basics.htm','PACF(k)','click here for more information about the Partial Autocorrelation Function'),header=TRUE)
a<-table.element(a,'T-STAT',header=TRUE)
a<-table.element(a,'P-value',header=TRUE)
a<-table.row.end(a)
for (i in 1:par1) {
a<-table.row.start(a)
a<-table.element(a,i,header=TRUE)
a<-table.element(a,round(mypacf[i],6))
mytstat <- mypacf[i]*sqrtn
a<-table.element(a,round(mytstat,4))
a<-table.element(a,round(1-pt(abs(mytstat),lengthx),6))
a<-table.row.end(a)
}
a<-table.end(a)
table.save(a,file='mytable1.tab')