Free Statistics

of Irreproducible Research!

Author's title

Author*The author of this computation has been verified*
R Software Modulerwasp_arimabackwardselection.wasp
Title produced by softwareARIMA Backward Selection
Date of computationSat, 06 Dec 2008 11:45:54 -0700
Cite this page as followsStatistical Computations at FreeStatistics.org, Office for Research Development and Education, URL https://freestatistics.org/blog/index.php?v=date/2008/Dec/06/t1228589250ykv7vhh2n3psn0u.htm/, Retrieved Sun, 19 May 2024 09:36:52 +0000
Statistical Computations at FreeStatistics.org, Office for Research Development and Education, URL https://freestatistics.org/blog/index.php?pk=29799, Retrieved Sun, 19 May 2024 09:36:52 +0000
QR Codes:

Original text written by user:
IsPrivate?No (this computation is public)
User-defined keywords
Estimated Impact463
Family? (F = Feedback message, R = changed R code, M = changed R Module, P = changed Parameters, D = changed Data)
-     [Univariate Data Series] [data set] [2008-12-01 19:54:57] [b98453cac15ba1066b407e146608df68]
F RMP   [Spectral Analysis] [step 2] [2008-12-06 09:28:49] [9f5bfe3b95f9ec3d2ed4c0a560a9648a]
F   P     [Spectral Analysis] [step 3] [2008-12-06 10:26:00] [9f5bfe3b95f9ec3d2ed4c0a560a9648a]
F RM        [ARIMA Backward Selection] [step 5] [2008-12-06 10:48:10] [9f5bfe3b95f9ec3d2ed4c0a560a9648a]
F   PD          [ARIMA Backward Selection] [step 5] [2008-12-06 18:45:54] [a9e6d7cd6e144e8b311d9f96a24c5a25] [Current]
Feedback Forum
2008-12-13 11:24:57 [Sam De Cuyper] [reply
Geen uitleg bij de belangrijkste figuur. In de output berekend de pc alle parameters in rij 1 en indien je steeds een rij lager kijkt kom je helemaal op het laatste uit op de stap waar de pc de juiste waarden kiest voor de parameters. Dit kan aangetoond worden door de p-waarden die telkens zijn weergegeven. Hierdoor zijn de waarden van de parameters die in het begin maximaal werden gekozen, niet meer voldaan.
2008-12-13 11:35:16 [Ken Wright] [reply
De tabel met veel kleurtjes geeft een mooi overzicht. In de eerste rij gaat hij alle processen in acht nemen en dan rij per rij gaat hij processen die het minst relevant zijn voor de tijdreeks. De driehoekjes stellen de p waarde voor dus ze moeten minstens rood zien om te mogen gebruiken. In de laatste rij ziet men die processen die het meest relevant zijn voor jouw tijdreeks. Nu gaan we naar de verdelingen zien ofdat zij wel normaal verdeeld zijn. Men kan zien dat ze normaal verdeeld zijn, bij de qq plot zie je dat er nog linksscheefheid is, maar dit is te wijten aan omstandigheden die wij niet kunnen verklaren. Het cumulative periodogram wijkt niet veel af van een diagonaal dus we kunnen besluiten dat de juiste processen gebruikt zijn.
2008-12-16 19:27:14 [Kevin Vermeiren] [reply
De student geeft hier een uitermate beperkt antwoord. Veel nuttige informatie ontbreekt. Hier dient zeker vermeld te worden dat bij de berekening van voorgaande figuur de parameters p, P, q en Q de maximum waarde kregen. De kolom van AR 1, AR 2, AR 3 komt overeen met respectievelijk Ø 1, Ø 2 en Ø 3. De berekende getallen (in de vierkanten) in de grafiek kunnen we substitueren met Ø 1, Ø 2, Ø 3. Het belangrijkste van de grafiek zijn de driehoeken in de onderhoek van de vierkanten. Deze representeren de p-waarden. Onderaan de grafiek wordt vermeld welke kleur voor welke waarde staat. We merken bij AR 3 een zwart driehoekje. Dit wil zeggen dat deze niet significant verschillend is van 0 en kan dus ontstaan zijn door toeval. Bijgevolg valt Ø 3 weg uit de vergelijking. Ook kunnen we nog vermelden dat de verschillende rijen in de grafiek verschillende berekeningen voorstellen met enkel niet significante parameters weggelaten. We kunnen dus concluderen dat Ø1 = -0.72 , Ø 2 = -0.5 en  = -0.68. Indien we nu de bekomen resultaten invullen in de formule bekomen we het volgende:
(1+0.72B+0.5B²)1 112 (Yt)^-0.1 =(1+0.68B12)et
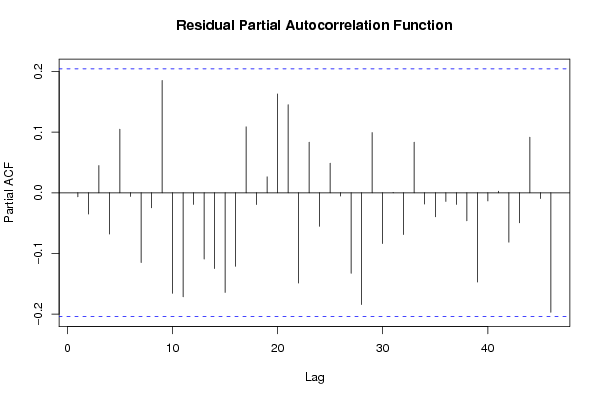
Nu moet er inderdaad nagekeken worden hoe gesteld is met de assumpties van de residu’s.

Residual autocorrelation function
De student zegt hier dat alle autocorrelatie coëfficiënten binnen het betrouwbaarheidsinterval liggen. Dit is hier niet juist. Wat wel had gezegd moeten worden is het feit dat er nu geen enkel patroon meer waar te nemen is. We kunnen dus stellen dat deze assumptie voldaan is.

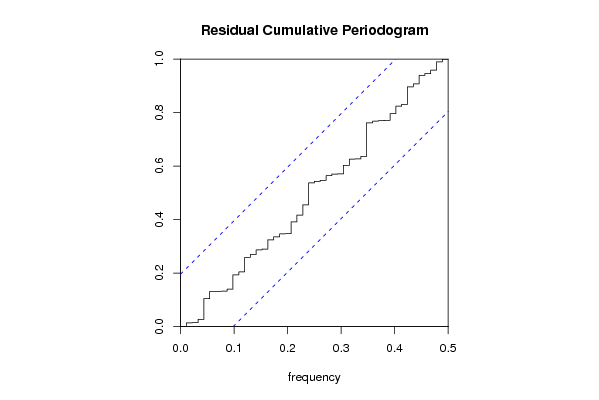
residual cumulative periodogram
Het klopt dat er toch nog een trapsgewijsverloop te merken valt in het cumulative periodogram. Verder is het juist dat deze curve zich binnen het betrouwbaarheidsinterval bevindt. Hier had nog vermeld mogen worden dat de curve zeer dicht aan leunt bij de diagonaal.

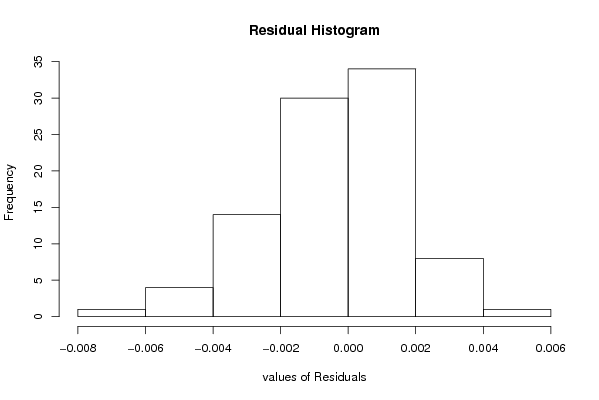
residual histogram
De student bespreekt het histogram zeer beperkt. Hier had nog vermeld mogen worden dat hoe meer normaal de residu’s verdeeld zijn hoe meer het model verklaart. We zien inderdaad dat de residu’s redelijk normaal verdeeld zijn.

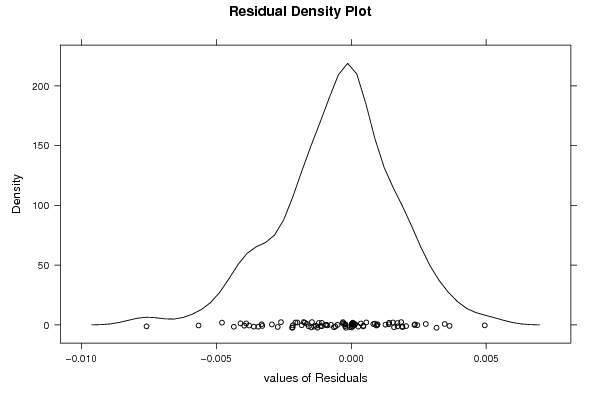
Residual density plot
Ook de density plot moet een zo goed mogelijke weergave zijn van de Gauss-curve. We zien inderdaad dat dit het geval is. De density plot geeft een vrij normale verdeling van de residu’s weer.

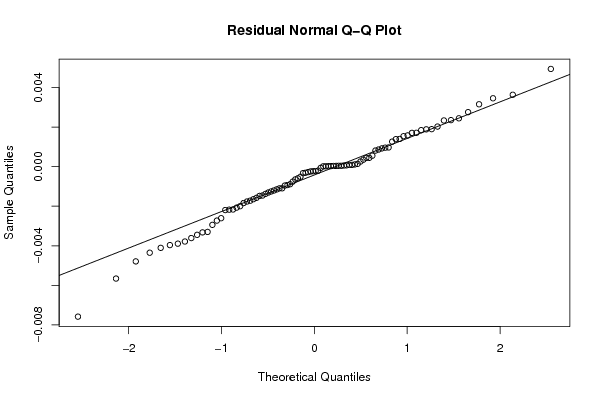
residual normal q-q plot
De student geeft weer een zeer beperkt antwoord. Hier had nog vermeld mogen worden dat de de quantielen van de residu’s vergeleken worden met de quantielen van de theoretische normaalverdeling. Wanneer de punten op de rechte liggen hebben we te maken met een perfecte normaalverdeling van de residu’s. We zien dat deze zeer goed op de rechte liggen enkel aan de linker staart is er nog een probleem. Ook is er rechts bovenaan een outlier aanwezig.

Post a new message
Dataseries X:
2648,9
2669,6
3042,3
2604,2
2732,1
2621,7
2483,7
2479,3
2684,6
2834,7
2566,1
2251,2
2350
2299,8
2542,8
2530,2
2508,1
2616,8
2534,1
2181,8
2578,9
2841,9
2529,9
2103,2
2326,2
2452,6
2782,1
2727,3
2648,2
2760,7
2613
2225,4
2713,9
2923,3
2707
2473,9
2521
2531,8
3068,8
2826,9
2674,2
2966,6
2798,8
2629,6
3124,6
3115,7
3083
2863,9
2728,7
2789,4
3225,7
3148,2
2836,5
3153,5
2656,9
2834,7
3172,5
2998,8
3103,1
2735,6
2818,1
2874,4
3438,5
2949,1
3306,8
3530
3003,8
3206,4
3514,6
3522,6
3525,5
2996,2
3231,1
3030
3541,7
3113,2
3390,8
3424,2
3079,8
3123,4
3317,1
3579,9
3317,9
2668,1
3609,2
3535,2
3644,7
3925,7
3663,2
3905,3
3990
3695,8


Summary of computational transaction
Raw Inputview raw input (R code)
Raw Outputview raw output of R engine
Computing time15 seconds
R Server'Sir Ronald Aylmer Fisher' @ 193.190.124.24

\begin{tabular}{lllllllll}
\hline
Summary of computational transaction \tabularnewline
Raw Input & view raw input (R code)  \tabularnewline
Raw Output & view raw output of R engine  \tabularnewline
Computing time & 15 seconds \tabularnewline
R Server & 'Sir Ronald Aylmer Fisher' @ 193.190.124.24 \tabularnewline
\hline
\end{tabular}
%Source: https://freestatistics.org/blog/index.php?pk=29799&T=0

[TABLE]
[ROW][C]Summary of computational transaction[/C][/ROW]
[ROW][C]Raw Input[/C][C]view raw input (R code) [/C][/ROW]
[ROW][C]Raw Output[/C][C]view raw output of R engine [/C][/ROW]
[ROW][C]Computing time[/C][C]15 seconds[/C][/ROW]
[ROW][C]R Server[/C][C]'Sir Ronald Aylmer Fisher' @ 193.190.124.24[/C][/ROW]
[/TABLE]
Source: https://freestatistics.org/blog/index.php?pk=29799&T=0

Globally Unique Identifier (entire table): ba.freestatistics.org/blog/index.php?pk=29799&T=0

As an alternative you can also use a QR Code:  

The GUIDs for individual cells are displayed in the table below:

Summary of computational transaction
Raw Inputview raw input (R code)
Raw Outputview raw output of R engine
Computing time15 seconds
R Server'Sir Ronald Aylmer Fisher' @ 193.190.124.24


ARIMA Parameter Estimation and Backward Selection
Iterationar1ar2ar3ma1sar1sar2sma1
Estimates ( 1 )-0.8474-0.47070.04850.27820.3293-0.1487-0.9955
(p-val)(1e-04 )(2e-04 )(0.6413 )(0.2451 )(0.0022 )(0.1765 )(0.1054 )
Estimates ( 2 )-0.9425-0.538200.36890.3265-0.1463-0.9991
(p-val)(0 )(0 )(NA )(0.1336 )(0.0365 )(0.3716 )(0.0959 )
Estimates ( 3 )-0.9192-0.552300.31440.31910-1.0001
(p-val)(0 )(0 )(NA )(0.1657 )(0.0458 )(NA )(8e-04 )
Estimates ( 4 )-0.6705-0.4388000.3210-0.9997
(p-val)(0 )(1e-04 )(NA )(NA )(0.0539 )(NA )(0.0016 )
Estimates ( 5 )-0.7194-0.49570000-0.6808
(p-val)(0 )(0 )(NA )(NA )(NA )(NA )(0.001 )
Estimates ( 6 )NANANANANANANA
(p-val)(NA )(NA )(NA )(NA )(NA )(NA )(NA )
Estimates ( 7 )NANANANANANANA
(p-val)(NA )(NA )(NA )(NA )(NA )(NA )(NA )
Estimates ( 8 )NANANANANANANA
(p-val)(NA )(NA )(NA )(NA )(NA )(NA )(NA )
Estimates ( 9 )NANANANANANANA
(p-val)(NA )(NA )(NA )(NA )(NA )(NA )(NA )
Estimates ( 10 )NANANANANANANA
(p-val)(NA )(NA )(NA )(NA )(NA )(NA )(NA )
Estimates ( 11 )NANANANANANANA
(p-val)(NA )(NA )(NA )(NA )(NA )(NA )(NA )
Estimates ( 12 )NANANANANANANA
(p-val)(NA )(NA )(NA )(NA )(NA )(NA )(NA )
Estimates ( 13 )NANANANANANANA
(p-val)(NA )(NA )(NA )(NA )(NA )(NA )(NA )

\begin{tabular}{lllllllll}
\hline
ARIMA Parameter Estimation and Backward Selection \tabularnewline
Iteration & ar1 & ar2 & ar3 & ma1 & sar1 & sar2 & sma1 \tabularnewline
Estimates ( 1 ) & -0.8474 & -0.4707 & 0.0485 & 0.2782 & 0.3293 & -0.1487 & -0.9955 \tabularnewline
(p-val) & (1e-04 ) & (2e-04 ) & (0.6413 ) & (0.2451 ) & (0.0022 ) & (0.1765 ) & (0.1054 ) \tabularnewline
Estimates ( 2 ) & -0.9425 & -0.5382 & 0 & 0.3689 & 0.3265 & -0.1463 & -0.9991 \tabularnewline
(p-val) & (0 ) & (0 ) & (NA ) & (0.1336 ) & (0.0365 ) & (0.3716 ) & (0.0959 ) \tabularnewline
Estimates ( 3 ) & -0.9192 & -0.5523 & 0 & 0.3144 & 0.3191 & 0 & -1.0001 \tabularnewline
(p-val) & (0 ) & (0 ) & (NA ) & (0.1657 ) & (0.0458 ) & (NA ) & (8e-04 ) \tabularnewline
Estimates ( 4 ) & -0.6705 & -0.4388 & 0 & 0 & 0.321 & 0 & -0.9997 \tabularnewline
(p-val) & (0 ) & (1e-04 ) & (NA ) & (NA ) & (0.0539 ) & (NA ) & (0.0016 ) \tabularnewline
Estimates ( 5 ) & -0.7194 & -0.4957 & 0 & 0 & 0 & 0 & -0.6808 \tabularnewline
(p-val) & (0 ) & (0 ) & (NA ) & (NA ) & (NA ) & (NA ) & (0.001 ) \tabularnewline
Estimates ( 6 ) & NA & NA & NA & NA & NA & NA & NA \tabularnewline
(p-val) & (NA ) & (NA ) & (NA ) & (NA ) & (NA ) & (NA ) & (NA ) \tabularnewline
Estimates ( 7 ) & NA & NA & NA & NA & NA & NA & NA \tabularnewline
(p-val) & (NA ) & (NA ) & (NA ) & (NA ) & (NA ) & (NA ) & (NA ) \tabularnewline
Estimates ( 8 ) & NA & NA & NA & NA & NA & NA & NA \tabularnewline
(p-val) & (NA ) & (NA ) & (NA ) & (NA ) & (NA ) & (NA ) & (NA ) \tabularnewline
Estimates ( 9 ) & NA & NA & NA & NA & NA & NA & NA \tabularnewline
(p-val) & (NA ) & (NA ) & (NA ) & (NA ) & (NA ) & (NA ) & (NA ) \tabularnewline
Estimates ( 10 ) & NA & NA & NA & NA & NA & NA & NA \tabularnewline
(p-val) & (NA ) & (NA ) & (NA ) & (NA ) & (NA ) & (NA ) & (NA ) \tabularnewline
Estimates ( 11 ) & NA & NA & NA & NA & NA & NA & NA \tabularnewline
(p-val) & (NA ) & (NA ) & (NA ) & (NA ) & (NA ) & (NA ) & (NA ) \tabularnewline
Estimates ( 12 ) & NA & NA & NA & NA & NA & NA & NA \tabularnewline
(p-val) & (NA ) & (NA ) & (NA ) & (NA ) & (NA ) & (NA ) & (NA ) \tabularnewline
Estimates ( 13 ) & NA & NA & NA & NA & NA & NA & NA \tabularnewline
(p-val) & (NA ) & (NA ) & (NA ) & (NA ) & (NA ) & (NA ) & (NA ) \tabularnewline
\hline
\end{tabular}
%Source: https://freestatistics.org/blog/index.php?pk=29799&T=1

[TABLE]
[ROW][C]ARIMA Parameter Estimation and Backward Selection[/C][/ROW]
[ROW][C]Iteration[/C][C]ar1[/C][C]ar2[/C][C]ar3[/C][C]ma1[/C][C]sar1[/C][C]sar2[/C][C]sma1[/C][/ROW]
[ROW][C]Estimates ( 1 )[/C][C]-0.8474[/C][C]-0.4707[/C][C]0.0485[/C][C]0.2782[/C][C]0.3293[/C][C]-0.1487[/C][C]-0.9955[/C][/ROW]
[ROW][C](p-val)[/C][C](1e-04 )[/C][C](2e-04 )[/C][C](0.6413 )[/C][C](0.2451 )[/C][C](0.0022 )[/C][C](0.1765 )[/C][C](0.1054 )[/C][/ROW]
[ROW][C]Estimates ( 2 )[/C][C]-0.9425[/C][C]-0.5382[/C][C]0[/C][C]0.3689[/C][C]0.3265[/C][C]-0.1463[/C][C]-0.9991[/C][/ROW]
[ROW][C](p-val)[/C][C](0 )[/C][C](0 )[/C][C](NA )[/C][C](0.1336 )[/C][C](0.0365 )[/C][C](0.3716 )[/C][C](0.0959 )[/C][/ROW]
[ROW][C]Estimates ( 3 )[/C][C]-0.9192[/C][C]-0.5523[/C][C]0[/C][C]0.3144[/C][C]0.3191[/C][C]0[/C][C]-1.0001[/C][/ROW]
[ROW][C](p-val)[/C][C](0 )[/C][C](0 )[/C][C](NA )[/C][C](0.1657 )[/C][C](0.0458 )[/C][C](NA )[/C][C](8e-04 )[/C][/ROW]
[ROW][C]Estimates ( 4 )[/C][C]-0.6705[/C][C]-0.4388[/C][C]0[/C][C]0[/C][C]0.321[/C][C]0[/C][C]-0.9997[/C][/ROW]
[ROW][C](p-val)[/C][C](0 )[/C][C](1e-04 )[/C][C](NA )[/C][C](NA )[/C][C](0.0539 )[/C][C](NA )[/C][C](0.0016 )[/C][/ROW]
[ROW][C]Estimates ( 5 )[/C][C]-0.7194[/C][C]-0.4957[/C][C]0[/C][C]0[/C][C]0[/C][C]0[/C][C]-0.6808[/C][/ROW]
[ROW][C](p-val)[/C][C](0 )[/C][C](0 )[/C][C](NA )[/C][C](NA )[/C][C](NA )[/C][C](NA )[/C][C](0.001 )[/C][/ROW]
[ROW][C]Estimates ( 6 )[/C][C]NA[/C][C]NA[/C][C]NA[/C][C]NA[/C][C]NA[/C][C]NA[/C][C]NA[/C][/ROW]
[ROW][C](p-val)[/C][C](NA )[/C][C](NA )[/C][C](NA )[/C][C](NA )[/C][C](NA )[/C][C](NA )[/C][C](NA )[/C][/ROW]
[ROW][C]Estimates ( 7 )[/C][C]NA[/C][C]NA[/C][C]NA[/C][C]NA[/C][C]NA[/C][C]NA[/C][C]NA[/C][/ROW]
[ROW][C](p-val)[/C][C](NA )[/C][C](NA )[/C][C](NA )[/C][C](NA )[/C][C](NA )[/C][C](NA )[/C][C](NA )[/C][/ROW]
[ROW][C]Estimates ( 8 )[/C][C]NA[/C][C]NA[/C][C]NA[/C][C]NA[/C][C]NA[/C][C]NA[/C][C]NA[/C][/ROW]
[ROW][C](p-val)[/C][C](NA )[/C][C](NA )[/C][C](NA )[/C][C](NA )[/C][C](NA )[/C][C](NA )[/C][C](NA )[/C][/ROW]
[ROW][C]Estimates ( 9 )[/C][C]NA[/C][C]NA[/C][C]NA[/C][C]NA[/C][C]NA[/C][C]NA[/C][C]NA[/C][/ROW]
[ROW][C](p-val)[/C][C](NA )[/C][C](NA )[/C][C](NA )[/C][C](NA )[/C][C](NA )[/C][C](NA )[/C][C](NA )[/C][/ROW]
[ROW][C]Estimates ( 10 )[/C][C]NA[/C][C]NA[/C][C]NA[/C][C]NA[/C][C]NA[/C][C]NA[/C][C]NA[/C][/ROW]
[ROW][C](p-val)[/C][C](NA )[/C][C](NA )[/C][C](NA )[/C][C](NA )[/C][C](NA )[/C][C](NA )[/C][C](NA )[/C][/ROW]
[ROW][C]Estimates ( 11 )[/C][C]NA[/C][C]NA[/C][C]NA[/C][C]NA[/C][C]NA[/C][C]NA[/C][C]NA[/C][/ROW]
[ROW][C](p-val)[/C][C](NA )[/C][C](NA )[/C][C](NA )[/C][C](NA )[/C][C](NA )[/C][C](NA )[/C][C](NA )[/C][/ROW]
[ROW][C]Estimates ( 12 )[/C][C]NA[/C][C]NA[/C][C]NA[/C][C]NA[/C][C]NA[/C][C]NA[/C][C]NA[/C][/ROW]
[ROW][C](p-val)[/C][C](NA )[/C][C](NA )[/C][C](NA )[/C][C](NA )[/C][C](NA )[/C][C](NA )[/C][C](NA )[/C][/ROW]
[ROW][C]Estimates ( 13 )[/C][C]NA[/C][C]NA[/C][C]NA[/C][C]NA[/C][C]NA[/C][C]NA[/C][C]NA[/C][/ROW]
[ROW][C](p-val)[/C][C](NA )[/C][C](NA )[/C][C](NA )[/C][C](NA )[/C][C](NA )[/C][C](NA )[/C][C](NA )[/C][/ROW]
[/TABLE]
Source: https://freestatistics.org/blog/index.php?pk=29799&T=1

Globally Unique Identifier (entire table): ba.freestatistics.org/blog/index.php?pk=29799&T=1

As an alternative you can also use a QR Code:  

The GUIDs for individual cells are displayed in the table below:

ARIMA Parameter Estimation and Backward Selection
Iterationar1ar2ar3ma1sar1sar2sma1
Estimates ( 1 )-0.8474-0.47070.04850.27820.3293-0.1487-0.9955
(p-val)(1e-04 )(2e-04 )(0.6413 )(0.2451 )(0.0022 )(0.1765 )(0.1054 )
Estimates ( 2 )-0.9425-0.538200.36890.3265-0.1463-0.9991
(p-val)(0 )(0 )(NA )(0.1336 )(0.0365 )(0.3716 )(0.0959 )
Estimates ( 3 )-0.9192-0.552300.31440.31910-1.0001
(p-val)(0 )(0 )(NA )(0.1657 )(0.0458 )(NA )(8e-04 )
Estimates ( 4 )-0.6705-0.4388000.3210-0.9997
(p-val)(0 )(1e-04 )(NA )(NA )(0.0539 )(NA )(0.0016 )
Estimates ( 5 )-0.7194-0.49570000-0.6808
(p-val)(0 )(0 )(NA )(NA )(NA )(NA )(0.001 )
Estimates ( 6 )NANANANANANANA
(p-val)(NA )(NA )(NA )(NA )(NA )(NA )(NA )
Estimates ( 7 )NANANANANANANA
(p-val)(NA )(NA )(NA )(NA )(NA )(NA )(NA )
Estimates ( 8 )NANANANANANANA
(p-val)(NA )(NA )(NA )(NA )(NA )(NA )(NA )
Estimates ( 9 )NANANANANANANA
(p-val)(NA )(NA )(NA )(NA )(NA )(NA )(NA )
Estimates ( 10 )NANANANANANANA
(p-val)(NA )(NA )(NA )(NA )(NA )(NA )(NA )
Estimates ( 11 )NANANANANANANA
(p-val)(NA )(NA )(NA )(NA )(NA )(NA )(NA )
Estimates ( 12 )NANANANANANANA
(p-val)(NA )(NA )(NA )(NA )(NA )(NA )(NA )
Estimates ( 13 )NANANANANANANA
(p-val)(NA )(NA )(NA )(NA )(NA )(NA )(NA )


Estimated ARIMA Residuals
Value
-0.00157423141143631
0.000869154151855067
0.00140268522227166
-0.00435066723997138
-0.00114701115827459
-0.00410466607122167
-0.00199690574919727
0.00363935281143241
8.84940765809324e-05
-0.00145721600227902
-0.00183736910690726
0.00189914667188653
-0.000885791247033812
-0.00329874339826981
-0.00332187469102409
-0.00294110065550461
0.000354507570629704
-0.000642406785734519
0.000556507432561835
0.00234030992976468
-0.000509620446696747
-0.000240593735114316
-0.00217318675427778
-0.00378446029372935
-0.000197652250105270
0.00126772127449596
-0.00109300827933936
-0.000217715214387358
0.00158459576749298
-0.00147798887430931
-0.00109399621178047
-0.00360980146783404
-0.00171987833409845
0.00184841124814354
-0.00125237749063053
-0.00260475053230412
0.000927134666295852
0.000974800944882709
0.00171518001366642
-0.00206961856918368
0.00203071375087551
-0.000755193433573157
0.00494495591328214
-0.00344535732411151
9.10639968375282e-05
0.00235690934355267
-0.000272934066708348
0.000144102846696382
-0.00219392058915817
-0.000586617183137023
-0.00216535505044334
0.00315881999726173
-0.00478966684160182
-0.00272591688673126
-0.000926511250973599
-0.00176206104166176
0.000448152704782326
-0.00032474859626513
-0.000306399717001517
0.000816650486143645
-0.00130596335106050
0.00276024083499204
0.00154300249337619
0.00244877250272728
-0.00120229570678871
0.000962328647736495
4.73126450910292e-05
-5.78268501196146e-05
0.00188999493998035
-0.000953813220688592
0.00139409778806645
0.00346170342462002
-0.00758482824767873
-0.00565741601927461
0.000445674240865594
-0.00396464745154297
0.00171037920214271
-0.00164508892217419
-0.00389297762859833
-0.00137455909721287

\begin{tabular}{lllllllll}
\hline
Estimated ARIMA Residuals \tabularnewline
Value \tabularnewline
-0.00157423141143631 \tabularnewline
0.000869154151855067 \tabularnewline
0.00140268522227166 \tabularnewline
-0.00435066723997138 \tabularnewline
-0.00114701115827459 \tabularnewline
-0.00410466607122167 \tabularnewline
-0.00199690574919727 \tabularnewline
0.00363935281143241 \tabularnewline
8.84940765809324e-05 \tabularnewline
-0.00145721600227902 \tabularnewline
-0.00183736910690726 \tabularnewline
0.00189914667188653 \tabularnewline
-0.000885791247033812 \tabularnewline
-0.00329874339826981 \tabularnewline
-0.00332187469102409 \tabularnewline
-0.00294110065550461 \tabularnewline
0.000354507570629704 \tabularnewline
-0.000642406785734519 \tabularnewline
0.000556507432561835 \tabularnewline
0.00234030992976468 \tabularnewline
-0.000509620446696747 \tabularnewline
-0.000240593735114316 \tabularnewline
-0.00217318675427778 \tabularnewline
-0.00378446029372935 \tabularnewline
-0.000197652250105270 \tabularnewline
0.00126772127449596 \tabularnewline
-0.00109300827933936 \tabularnewline
-0.000217715214387358 \tabularnewline
0.00158459576749298 \tabularnewline
-0.00147798887430931 \tabularnewline
-0.00109399621178047 \tabularnewline
-0.00360980146783404 \tabularnewline
-0.00171987833409845 \tabularnewline
0.00184841124814354 \tabularnewline
-0.00125237749063053 \tabularnewline
-0.00260475053230412 \tabularnewline
0.000927134666295852 \tabularnewline
0.000974800944882709 \tabularnewline
0.00171518001366642 \tabularnewline
-0.00206961856918368 \tabularnewline
0.00203071375087551 \tabularnewline
-0.000755193433573157 \tabularnewline
0.00494495591328214 \tabularnewline
-0.00344535732411151 \tabularnewline
9.10639968375282e-05 \tabularnewline
0.00235690934355267 \tabularnewline
-0.000272934066708348 \tabularnewline
0.000144102846696382 \tabularnewline
-0.00219392058915817 \tabularnewline
-0.000586617183137023 \tabularnewline
-0.00216535505044334 \tabularnewline
0.00315881999726173 \tabularnewline
-0.00478966684160182 \tabularnewline
-0.00272591688673126 \tabularnewline
-0.000926511250973599 \tabularnewline
-0.00176206104166176 \tabularnewline
0.000448152704782326 \tabularnewline
-0.00032474859626513 \tabularnewline
-0.000306399717001517 \tabularnewline
0.000816650486143645 \tabularnewline
-0.00130596335106050 \tabularnewline
0.00276024083499204 \tabularnewline
0.00154300249337619 \tabularnewline
0.00244877250272728 \tabularnewline
-0.00120229570678871 \tabularnewline
0.000962328647736495 \tabularnewline
4.73126450910292e-05 \tabularnewline
-5.78268501196146e-05 \tabularnewline
0.00188999493998035 \tabularnewline
-0.000953813220688592 \tabularnewline
0.00139409778806645 \tabularnewline
0.00346170342462002 \tabularnewline
-0.00758482824767873 \tabularnewline
-0.00565741601927461 \tabularnewline
0.000445674240865594 \tabularnewline
-0.00396464745154297 \tabularnewline
0.00171037920214271 \tabularnewline
-0.00164508892217419 \tabularnewline
-0.00389297762859833 \tabularnewline
-0.00137455909721287 \tabularnewline
\hline
\end{tabular}
%Source: https://freestatistics.org/blog/index.php?pk=29799&T=2

[TABLE]
[ROW][C]Estimated ARIMA Residuals[/C][/ROW]
[ROW][C]Value[/C][/ROW]
[ROW][C]-0.00157423141143631[/C][/ROW]
[ROW][C]0.000869154151855067[/C][/ROW]
[ROW][C]0.00140268522227166[/C][/ROW]
[ROW][C]-0.00435066723997138[/C][/ROW]
[ROW][C]-0.00114701115827459[/C][/ROW]
[ROW][C]-0.00410466607122167[/C][/ROW]
[ROW][C]-0.00199690574919727[/C][/ROW]
[ROW][C]0.00363935281143241[/C][/ROW]
[ROW][C]8.84940765809324e-05[/C][/ROW]
[ROW][C]-0.00145721600227902[/C][/ROW]
[ROW][C]-0.00183736910690726[/C][/ROW]
[ROW][C]0.00189914667188653[/C][/ROW]
[ROW][C]-0.000885791247033812[/C][/ROW]
[ROW][C]-0.00329874339826981[/C][/ROW]
[ROW][C]-0.00332187469102409[/C][/ROW]
[ROW][C]-0.00294110065550461[/C][/ROW]
[ROW][C]0.000354507570629704[/C][/ROW]
[ROW][C]-0.000642406785734519[/C][/ROW]
[ROW][C]0.000556507432561835[/C][/ROW]
[ROW][C]0.00234030992976468[/C][/ROW]
[ROW][C]-0.000509620446696747[/C][/ROW]
[ROW][C]-0.000240593735114316[/C][/ROW]
[ROW][C]-0.00217318675427778[/C][/ROW]
[ROW][C]-0.00378446029372935[/C][/ROW]
[ROW][C]-0.000197652250105270[/C][/ROW]
[ROW][C]0.00126772127449596[/C][/ROW]
[ROW][C]-0.00109300827933936[/C][/ROW]
[ROW][C]-0.000217715214387358[/C][/ROW]
[ROW][C]0.00158459576749298[/C][/ROW]
[ROW][C]-0.00147798887430931[/C][/ROW]
[ROW][C]-0.00109399621178047[/C][/ROW]
[ROW][C]-0.00360980146783404[/C][/ROW]
[ROW][C]-0.00171987833409845[/C][/ROW]
[ROW][C]0.00184841124814354[/C][/ROW]
[ROW][C]-0.00125237749063053[/C][/ROW]
[ROW][C]-0.00260475053230412[/C][/ROW]
[ROW][C]0.000927134666295852[/C][/ROW]
[ROW][C]0.000974800944882709[/C][/ROW]
[ROW][C]0.00171518001366642[/C][/ROW]
[ROW][C]-0.00206961856918368[/C][/ROW]
[ROW][C]0.00203071375087551[/C][/ROW]
[ROW][C]-0.000755193433573157[/C][/ROW]
[ROW][C]0.00494495591328214[/C][/ROW]
[ROW][C]-0.00344535732411151[/C][/ROW]
[ROW][C]9.10639968375282e-05[/C][/ROW]
[ROW][C]0.00235690934355267[/C][/ROW]
[ROW][C]-0.000272934066708348[/C][/ROW]
[ROW][C]0.000144102846696382[/C][/ROW]
[ROW][C]-0.00219392058915817[/C][/ROW]
[ROW][C]-0.000586617183137023[/C][/ROW]
[ROW][C]-0.00216535505044334[/C][/ROW]
[ROW][C]0.00315881999726173[/C][/ROW]
[ROW][C]-0.00478966684160182[/C][/ROW]
[ROW][C]-0.00272591688673126[/C][/ROW]
[ROW][C]-0.000926511250973599[/C][/ROW]
[ROW][C]-0.00176206104166176[/C][/ROW]
[ROW][C]0.000448152704782326[/C][/ROW]
[ROW][C]-0.00032474859626513[/C][/ROW]
[ROW][C]-0.000306399717001517[/C][/ROW]
[ROW][C]0.000816650486143645[/C][/ROW]
[ROW][C]-0.00130596335106050[/C][/ROW]
[ROW][C]0.00276024083499204[/C][/ROW]
[ROW][C]0.00154300249337619[/C][/ROW]
[ROW][C]0.00244877250272728[/C][/ROW]
[ROW][C]-0.00120229570678871[/C][/ROW]
[ROW][C]0.000962328647736495[/C][/ROW]
[ROW][C]4.73126450910292e-05[/C][/ROW]
[ROW][C]-5.78268501196146e-05[/C][/ROW]
[ROW][C]0.00188999493998035[/C][/ROW]
[ROW][C]-0.000953813220688592[/C][/ROW]
[ROW][C]0.00139409778806645[/C][/ROW]
[ROW][C]0.00346170342462002[/C][/ROW]
[ROW][C]-0.00758482824767873[/C][/ROW]
[ROW][C]-0.00565741601927461[/C][/ROW]
[ROW][C]0.000445674240865594[/C][/ROW]
[ROW][C]-0.00396464745154297[/C][/ROW]
[ROW][C]0.00171037920214271[/C][/ROW]
[ROW][C]-0.00164508892217419[/C][/ROW]
[ROW][C]-0.00389297762859833[/C][/ROW]
[ROW][C]-0.00137455909721287[/C][/ROW]
[/TABLE]
Source: https://freestatistics.org/blog/index.php?pk=29799&T=2

Globally Unique Identifier (entire table): ba.freestatistics.org/blog/index.php?pk=29799&T=2

As an alternative you can also use a QR Code:  

The GUIDs for individual cells are displayed in the table below:

Estimated ARIMA Residuals
Value
-0.00157423141143631
0.000869154151855067
0.00140268522227166
-0.00435066723997138
-0.00114701115827459
-0.00410466607122167
-0.00199690574919727
0.00363935281143241
8.84940765809324e-05
-0.00145721600227902
-0.00183736910690726
0.00189914667188653
-0.000885791247033812
-0.00329874339826981
-0.00332187469102409
-0.00294110065550461
0.000354507570629704
-0.000642406785734519
0.000556507432561835
0.00234030992976468
-0.000509620446696747
-0.000240593735114316
-0.00217318675427778
-0.00378446029372935
-0.000197652250105270
0.00126772127449596
-0.00109300827933936
-0.000217715214387358
0.00158459576749298
-0.00147798887430931
-0.00109399621178047
-0.00360980146783404
-0.00171987833409845
0.00184841124814354
-0.00125237749063053
-0.00260475053230412
0.000927134666295852
0.000974800944882709
0.00171518001366642
-0.00206961856918368
0.00203071375087551
-0.000755193433573157
0.00494495591328214
-0.00344535732411151
9.10639968375282e-05
0.00235690934355267
-0.000272934066708348
0.000144102846696382
-0.00219392058915817
-0.000586617183137023
-0.00216535505044334
0.00315881999726173
-0.00478966684160182
-0.00272591688673126
-0.000926511250973599
-0.00176206104166176
0.000448152704782326
-0.00032474859626513
-0.000306399717001517
0.000816650486143645
-0.00130596335106050
0.00276024083499204
0.00154300249337619
0.00244877250272728
-0.00120229570678871
0.000962328647736495
4.73126450910292e-05
-5.78268501196146e-05
0.00188999493998035
-0.000953813220688592
0.00139409778806645
0.00346170342462002
-0.00758482824767873
-0.00565741601927461
0.000445674240865594
-0.00396464745154297
0.00171037920214271
-0.00164508892217419
-0.00389297762859833
-0.00137455909721287


Parameters (Session):
par1 = -0.1 ; par2 = 1 ; par3 = 1 ; par4 = 12 ;
Parameters (R input):
par1 = FALSE ; par2 = -0.1 ; par3 = 1 ; par4 = 1 ; par5 = 12 ; par6 = 3 ; par7 = 1 ; par8 = 2 ; par9 = 1 ;
R code (references can be found in the software module):
library(lattice)
if (par1 == 'TRUE') par1 <- TRUE
if (par1 == 'FALSE') par1 <- FALSE
par2 <- as.numeric(par2) #Box-Cox lambda transformation parameter
par3 <- as.numeric(par3) #degree of non-seasonal differencing
par4 <- as.numeric(par4) #degree of seasonal differencing
par5 <- as.numeric(par5) #seasonal period
par6 <- as.numeric(par6) #degree (p) of the non-seasonal AR(p) polynomial
par7 <- as.numeric(par7) #degree (q) of the non-seasonal MA(q) polynomial
par8 <- as.numeric(par8) #degree (P) of the seasonal AR(P) polynomial
par9 <- as.numeric(par9) #degree (Q) of the seasonal MA(Q) polynomial
armaGR <- function(arima.out, names, n){
try1 <- arima.out$coef
try2 <- sqrt(diag(arima.out$var.coef))
try.data.frame <- data.frame(matrix(NA,ncol=4,nrow=length(names)))
dimnames(try.data.frame) <- list(names,c('coef','std','tstat','pv'))
try.data.frame[,1] <- try1
for(i in 1:length(try2)) try.data.frame[which(rownames(try.data.frame)==names(try2)[i]),2] <- try2[i]
try.data.frame[,3] <- try.data.frame[,1] / try.data.frame[,2]
try.data.frame[,4] <- round((1-pt(abs(try.data.frame[,3]),df=n-(length(try2)+1)))*2,5)
vector <- rep(NA,length(names))
vector[is.na(try.data.frame[,4])] <- 0
maxi <- which.max(try.data.frame[,4])
continue <- max(try.data.frame[,4],na.rm=TRUE) > .05
vector[maxi] <- 0
list(summary=try.data.frame,next.vector=vector,continue=continue)
}
arimaSelect <- function(series, order=c(13,0,0), seasonal=list(order=c(2,0,0),period=12), include.mean=F){
nrc <- order[1]+order[3]+seasonal$order[1]+seasonal$order[3]
coeff <- matrix(NA, nrow=nrc*2, ncol=nrc)
pval <- matrix(NA, nrow=nrc*2, ncol=nrc)
mylist <- rep(list(NULL), nrc)
names <- NULL
if(order[1] > 0) names <- paste('ar',1:order[1],sep='')
if(order[3] > 0) names <- c( names , paste('ma',1:order[3],sep='') )
if(seasonal$order[1] > 0) names <- c(names, paste('sar',1:seasonal$order[1],sep=''))
if(seasonal$order[3] > 0) names <- c(names, paste('sma',1:seasonal$order[3],sep=''))
arima.out <- arima(series, order=order, seasonal=seasonal, include.mean=include.mean, method='ML')
mylist[[1]] <- arima.out
last.arma <- armaGR(arima.out, names, length(series))
mystop <- FALSE
i <- 1
coeff[i,] <- last.arma[[1]][,1]
pval [i,] <- last.arma[[1]][,4]
i <- 2
aic <- arima.out$aic
while(!mystop){
mylist[[i]] <- arima.out
arima.out <- arima(series, order=order, seasonal=seasonal, include.mean=include.mean, method='ML', fixed=last.arma$next.vector)
aic <- c(aic, arima.out$aic)
last.arma <- armaGR(arima.out, names, length(series))
mystop <- !last.arma$continue
coeff[i,] <- last.arma[[1]][,1]
pval [i,] <- last.arma[[1]][,4]
i <- i+1
}
list(coeff, pval, mylist, aic=aic)
}
arimaSelectplot <- function(arimaSelect.out,noms,choix){
noms <- names(arimaSelect.out[[3]][[1]]$coef)
coeff <- arimaSelect.out[[1]]
k <- min(which(is.na(coeff[,1])))-1
coeff <- coeff[1:k,]
pval <- arimaSelect.out[[2]][1:k,]
aic <- arimaSelect.out$aic[1:k]
coeff[coeff==0] <- NA
n <- ncol(coeff)
if(missing(choix)) choix <- k
layout(matrix(c(1,1,1,2,
3,3,3,2,
3,3,3,4,
5,6,7,7),nr=4),
widths=c(10,35,45,15),
heights=c(30,30,15,15))
couleurs <- rainbow(75)[1:50]#(50)
ticks <- pretty(coeff)
par(mar=c(1,1,3,1))
plot(aic,k:1-.5,type='o',pch=21,bg='blue',cex=2,axes=F,lty=2,xpd=NA)
points(aic[choix],k-choix+.5,pch=21,cex=4,bg=2,xpd=NA)
title('aic',line=2)
par(mar=c(3,0,0,0))
plot(0,axes=F,xlab='',ylab='',xlim=range(ticks),ylim=c(.1,1))
rect(xleft = min(ticks) + (0:49)/50*(max(ticks)-min(ticks)),
xright = min(ticks) + (1:50)/50*(max(ticks)-min(ticks)),
ytop = rep(1,50),
ybottom= rep(0,50),col=couleurs,border=NA)
axis(1,ticks)
rect(xleft=min(ticks),xright=max(ticks),ytop=1,ybottom=0)
text(mean(coeff,na.rm=T),.5,'coefficients',cex=2,font=2)
par(mar=c(1,1,3,1))
image(1:n,1:k,t(coeff[k:1,]),axes=F,col=couleurs,zlim=range(ticks))
for(i in 1:n) for(j in 1:k) if(!is.na(coeff[j,i])) {
if(pval[j,i]<.01) symb = 'green'
else if( (pval[j,i]<.05) & (pval[j,i]>=.01)) symb = 'orange'
else if( (pval[j,i]<.1) & (pval[j,i]>=.05)) symb = 'red'
else symb = 'black'
polygon(c(i+.5 ,i+.2 ,i+.5 ,i+.5),
c(k-j+0.5,k-j+0.5,k-j+0.8,k-j+0.5),
col=symb)
if(j==choix) {
rect(xleft=i-.5,
xright=i+.5,
ybottom=k-j+1.5,
ytop=k-j+.5,
lwd=4)
text(i,
k-j+1,
round(coeff[j,i],2),
cex=1.2,
font=2)
}
else{
rect(xleft=i-.5,xright=i+.5,ybottom=k-j+1.5,ytop=k-j+.5)
text(i,k-j+1,round(coeff[j,i],2),cex=1.2,font=1)
}
}
axis(3,1:n,noms)
par(mar=c(0.5,0,0,0.5))
plot(0,axes=F,xlab='',ylab='',type='n',xlim=c(0,8),ylim=c(-.2,.8))
cols <- c('green','orange','red','black')
niv <- c('0','0.01','0.05','0.1')
for(i in 0:3){
polygon(c(1+2*i ,1+2*i ,1+2*i-.5 ,1+2*i),
c(.4 ,.7 , .4 , .4),
col=cols[i+1])
text(2*i,0.5,niv[i+1],cex=1.5)
}
text(8,.5,1,cex=1.5)
text(4,0,'p-value',cex=2)
box()
residus <- arimaSelect.out[[3]][[choix]]$res
par(mar=c(1,2,4,1))
acf(residus,main='')
title('acf',line=.5)
par(mar=c(1,2,4,1))
pacf(residus,main='')
title('pacf',line=.5)
par(mar=c(2,2,4,1))
qqnorm(residus,main='')
title('qq-norm',line=.5)
qqline(residus)
residus
}
if (par2 == 0) x <- log(x)
if (par2 != 0) x <- x^par2
(selection <- arimaSelect(x, order=c(par6,par3,par7), seasonal=list(order=c(par8,par4,par9), period=par5)))
bitmap(file='test1.png')
resid <- arimaSelectplot(selection)
dev.off()
resid
bitmap(file='test2.png')
acf(resid,length(resid)/2, main='Residual Autocorrelation Function')
dev.off()
bitmap(file='test3.png')
pacf(resid,length(resid)/2, main='Residual Partial Autocorrelation Function')
dev.off()
bitmap(file='test4.png')
cpgram(resid, main='Residual Cumulative Periodogram')
dev.off()
bitmap(file='test5.png')
hist(resid, main='Residual Histogram', xlab='values of Residuals')
dev.off()
bitmap(file='test6.png')
densityplot(~resid,col='black',main='Residual Density Plot', xlab='values of Residuals')
dev.off()
bitmap(file='test7.png')
qqnorm(resid, main='Residual Normal Q-Q Plot')
qqline(resid)
dev.off()
ncols <- length(selection[[1]][1,])
nrows <- length(selection[[2]][,1])-1
load(file='createtable')
a<-table.start()
a<-table.row.start(a)
a<-table.element(a,'ARIMA Parameter Estimation and Backward Selection', ncols+1,TRUE)
a<-table.row.end(a)
a<-table.row.start(a)
a<-table.element(a,'Iteration', header=TRUE)
for (i in 1:ncols) {
a<-table.element(a,names(selection[[3]][[1]]$coef)[i],header=TRUE)
}
a<-table.row.end(a)
for (j in 1:nrows) {
a<-table.row.start(a)
mydum <- 'Estimates ('
mydum <- paste(mydum,j)
mydum <- paste(mydum,')')
a<-table.element(a,mydum, header=TRUE)
for (i in 1:ncols) {
a<-table.element(a,round(selection[[1]][j,i],4))
}
a<-table.row.end(a)
a<-table.row.start(a)
a<-table.element(a,'(p-val)', header=TRUE)
for (i in 1:ncols) {
mydum <- '('
mydum <- paste(mydum,round(selection[[2]][j,i],4),sep='')
mydum <- paste(mydum,')')
a<-table.element(a,mydum)
}
a<-table.row.end(a)
}
a<-table.end(a)
table.save(a,file='mytable.tab')
a<-table.start()
a<-table.row.start(a)
a<-table.element(a,'Estimated ARIMA Residuals', 1,TRUE)
a<-table.row.end(a)
a<-table.row.start(a)
a<-table.element(a,'Value', 1,TRUE)
a<-table.row.end(a)
for (i in (par4*par5+par3):length(resid)) {
a<-table.row.start(a)
a<-table.element(a,resid[i])
a<-table.row.end(a)
}
a<-table.end(a)
table.save(a,file='mytable1.tab')