Free Statistics

of Irreproducible Research!

Author's title

Author*The author of this computation has been verified*
R Software Modulerwasp_autocorrelation.wasp
Title produced by software(Partial) Autocorrelation Function
Date of computationSat, 06 Dec 2008 11:14:47 -0700
Cite this page as followsStatistical Computations at FreeStatistics.org, Office for Research Development and Education, URL https://freestatistics.org/blog/index.php?v=date/2008/Dec/06/t122858738813tcuskyxw27rct.htm/, Retrieved Sun, 19 May 2024 10:45:04 +0000
Statistical Computations at FreeStatistics.org, Office for Research Development and Education, URL https://freestatistics.org/blog/index.php?pk=29789, Retrieved Sun, 19 May 2024 10:45:04 +0000
QR Codes:

Original text written by user:
IsPrivate?No (this computation is public)
User-defined keywords
Estimated Impact171
Family? (F = Feedback message, R = changed R code, M = changed R Module, P = changed Parameters, D = changed Data)
-     [Univariate Data Series] [data set] [2008-12-01 19:54:57] [b98453cac15ba1066b407e146608df68]
F RMP   [Variance Reduction Matrix] [step 2] [2008-12-06 09:12:19] [9f5bfe3b95f9ec3d2ed4c0a560a9648a]
F RMPD      [(Partial) Autocorrelation Function] [step 2] [2008-12-06 18:14:47] [a9e6d7cd6e144e8b311d9f96a24c5a25] [Current]
Feedback Forum
2008-12-13 11:09:37 [Sam De Cuyper] [reply
Correcte berekening en interpretatie.
2008-12-16 19:02:41 [Kevin Vermeiren] [reply
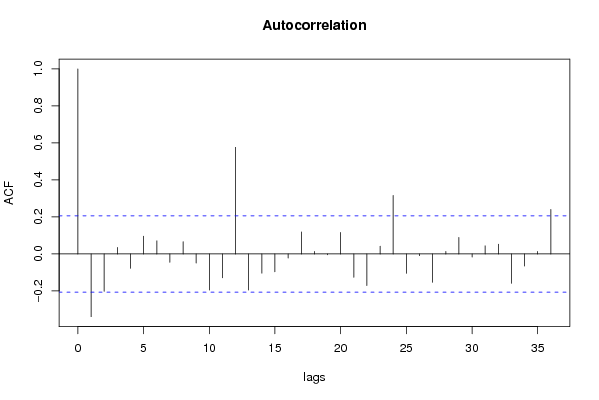
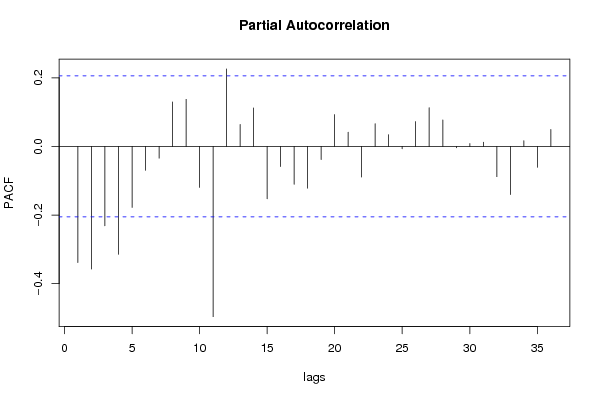
De conclusie van de student is correct, namelijk dat de lange termijn trend nu verdwenen is. De student vermeldt zeer terecht dat er een daling plaats vindt van de seizoenale autocorrelatiecoëfficiënten. Dit is inderdaad duidelijk te zien aan lag 12,24,36.. Het klopt dat we deze uitgesproken seizoenaliteit verwijderen door te differentiëren met parameter D nu ook op 1 ingesteld.

Post a new message
Dataseries X:
2648.9
2669.6
3042.3
2604.2
2732.1
2621.7
2483.7
2479.3
2684.6
2834.7
2566.1
2251.2
2350
2299.8
2542.8
2530.2
2508.1
2616.8
2534.1
2181.8
2578.9
2841.9
2529.9
2103.2
2326.2
2452.6
2782.1
2727.3
2648.2
2760.7
2613
2225.4
2713.9
2923.3
2707
2473.9
2521
2531.8
3068.8
2826.9
2674.2
2966.6
2798.8
2629.6
3124.6
3115.7
3083
2863.9
2728.7
2789.4
3225.7
3148.2
2836.5
3153.5
2656.9
2834.7
3172.5
2998.8
3103.1
2735.6
2818.1
2874.4
3438.5
2949.1
3306.8
3530
3003.8
3206.4
3514.6
3522.6
3525.5
2996.2
3231.1
3030
3541.7
3113.2
3390.8
3424.2
3079.8
3123.4
3317.1
3579.9
3317.9
2668.1
3609.2
3535.2
3644.7
3925.7
3663.2
3905.3
3990
3695.8


Summary of computational transaction
Raw Inputview raw input (R code)
Raw Outputview raw output of R engine
Computing time1 seconds
R Server'Sir Ronald Aylmer Fisher' @ 193.190.124.24

\begin{tabular}{lllllllll}
\hline
Summary of computational transaction \tabularnewline
Raw Input & view raw input (R code)  \tabularnewline
Raw Output & view raw output of R engine  \tabularnewline
Computing time & 1 seconds \tabularnewline
R Server & 'Sir Ronald Aylmer Fisher' @ 193.190.124.24 \tabularnewline
\hline
\end{tabular}
%Source: https://freestatistics.org/blog/index.php?pk=29789&T=0

[TABLE]
[ROW][C]Summary of computational transaction[/C][/ROW]
[ROW][C]Raw Input[/C][C]view raw input (R code) [/C][/ROW]
[ROW][C]Raw Output[/C][C]view raw output of R engine [/C][/ROW]
[ROW][C]Computing time[/C][C]1 seconds[/C][/ROW]
[ROW][C]R Server[/C][C]'Sir Ronald Aylmer Fisher' @ 193.190.124.24[/C][/ROW]
[/TABLE]
Source: https://freestatistics.org/blog/index.php?pk=29789&T=0

Globally Unique Identifier (entire table): ba.freestatistics.org/blog/index.php?pk=29789&T=0

As an alternative you can also use a QR Code:  

The GUIDs for individual cells are displayed in the table below:

Summary of computational transaction
Raw Inputview raw input (R code)
Raw Outputview raw output of R engine
Computing time1 seconds
R Server'Sir Ronald Aylmer Fisher' @ 193.190.124.24


Autocorrelation Function
Time lag kACF(k)T-STATP-value
1-0.338704-3.2310.000859
2-0.201711-1.92420.028727
30.0351230.33510.369177
4-0.076866-0.73330.232644
50.0963810.91940.180155
60.0710020.67730.249963
7-0.044482-0.42430.336162
80.0666530.63580.263242
9-0.048539-0.4630.322222
10-0.194742-1.85770.033221
11-0.128628-1.2270.111487
120.5762695.49730
13-0.195294-1.8630.032845
14-0.10372-0.98940.16254
15-0.096152-0.91720.180722
16-0.021876-0.20870.417582
170.118781.13310.130076
180.0131880.12580.450082
19-0.004495-0.04290.482946
200.1159591.10620.135782
21-0.125961-1.20160.11632
22-0.170966-1.63090.053183
230.0419270.40.345061
240.3165343.01950.001642
25-0.104069-0.99280.16173
26-0.009041-0.08620.465732
27-0.153203-1.46150.073666
280.0130670.12460.450538
290.0890190.84920.199004
30-0.016807-0.16030.436489
310.044010.41980.3378
320.0529570.50520.307328
33-0.158708-1.5140.066748
34-0.064771-0.61790.269099
350.0134440.12820.449119
360.2406232.29540.012004

\begin{tabular}{lllllllll}
\hline
Autocorrelation Function \tabularnewline
Time lag k & ACF(k) & T-STAT & P-value \tabularnewline
1 & -0.338704 & -3.231 & 0.000859 \tabularnewline
2 & -0.201711 & -1.9242 & 0.028727 \tabularnewline
3 & 0.035123 & 0.3351 & 0.369177 \tabularnewline
4 & -0.076866 & -0.7333 & 0.232644 \tabularnewline
5 & 0.096381 & 0.9194 & 0.180155 \tabularnewline
6 & 0.071002 & 0.6773 & 0.249963 \tabularnewline
7 & -0.044482 & -0.4243 & 0.336162 \tabularnewline
8 & 0.066653 & 0.6358 & 0.263242 \tabularnewline
9 & -0.048539 & -0.463 & 0.322222 \tabularnewline
10 & -0.194742 & -1.8577 & 0.033221 \tabularnewline
11 & -0.128628 & -1.227 & 0.111487 \tabularnewline
12 & 0.576269 & 5.4973 & 0 \tabularnewline
13 & -0.195294 & -1.863 & 0.032845 \tabularnewline
14 & -0.10372 & -0.9894 & 0.16254 \tabularnewline
15 & -0.096152 & -0.9172 & 0.180722 \tabularnewline
16 & -0.021876 & -0.2087 & 0.417582 \tabularnewline
17 & 0.11878 & 1.1331 & 0.130076 \tabularnewline
18 & 0.013188 & 0.1258 & 0.450082 \tabularnewline
19 & -0.004495 & -0.0429 & 0.482946 \tabularnewline
20 & 0.115959 & 1.1062 & 0.135782 \tabularnewline
21 & -0.125961 & -1.2016 & 0.11632 \tabularnewline
22 & -0.170966 & -1.6309 & 0.053183 \tabularnewline
23 & 0.041927 & 0.4 & 0.345061 \tabularnewline
24 & 0.316534 & 3.0195 & 0.001642 \tabularnewline
25 & -0.104069 & -0.9928 & 0.16173 \tabularnewline
26 & -0.009041 & -0.0862 & 0.465732 \tabularnewline
27 & -0.153203 & -1.4615 & 0.073666 \tabularnewline
28 & 0.013067 & 0.1246 & 0.450538 \tabularnewline
29 & 0.089019 & 0.8492 & 0.199004 \tabularnewline
30 & -0.016807 & -0.1603 & 0.436489 \tabularnewline
31 & 0.04401 & 0.4198 & 0.3378 \tabularnewline
32 & 0.052957 & 0.5052 & 0.307328 \tabularnewline
33 & -0.158708 & -1.514 & 0.066748 \tabularnewline
34 & -0.064771 & -0.6179 & 0.269099 \tabularnewline
35 & 0.013444 & 0.1282 & 0.449119 \tabularnewline
36 & 0.240623 & 2.2954 & 0.012004 \tabularnewline
\hline
\end{tabular}
%Source: https://freestatistics.org/blog/index.php?pk=29789&T=1

[TABLE]
[ROW][C]Autocorrelation Function[/C][/ROW]
[ROW][C]Time lag k[/C][C]ACF(k)[/C][C]T-STAT[/C][C]P-value[/C][/ROW]
[ROW][C]1[/C][C]-0.338704[/C][C]-3.231[/C][C]0.000859[/C][/ROW]
[ROW][C]2[/C][C]-0.201711[/C][C]-1.9242[/C][C]0.028727[/C][/ROW]
[ROW][C]3[/C][C]0.035123[/C][C]0.3351[/C][C]0.369177[/C][/ROW]
[ROW][C]4[/C][C]-0.076866[/C][C]-0.7333[/C][C]0.232644[/C][/ROW]
[ROW][C]5[/C][C]0.096381[/C][C]0.9194[/C][C]0.180155[/C][/ROW]
[ROW][C]6[/C][C]0.071002[/C][C]0.6773[/C][C]0.249963[/C][/ROW]
[ROW][C]7[/C][C]-0.044482[/C][C]-0.4243[/C][C]0.336162[/C][/ROW]
[ROW][C]8[/C][C]0.066653[/C][C]0.6358[/C][C]0.263242[/C][/ROW]
[ROW][C]9[/C][C]-0.048539[/C][C]-0.463[/C][C]0.322222[/C][/ROW]
[ROW][C]10[/C][C]-0.194742[/C][C]-1.8577[/C][C]0.033221[/C][/ROW]
[ROW][C]11[/C][C]-0.128628[/C][C]-1.227[/C][C]0.111487[/C][/ROW]
[ROW][C]12[/C][C]0.576269[/C][C]5.4973[/C][C]0[/C][/ROW]
[ROW][C]13[/C][C]-0.195294[/C][C]-1.863[/C][C]0.032845[/C][/ROW]
[ROW][C]14[/C][C]-0.10372[/C][C]-0.9894[/C][C]0.16254[/C][/ROW]
[ROW][C]15[/C][C]-0.096152[/C][C]-0.9172[/C][C]0.180722[/C][/ROW]
[ROW][C]16[/C][C]-0.021876[/C][C]-0.2087[/C][C]0.417582[/C][/ROW]
[ROW][C]17[/C][C]0.11878[/C][C]1.1331[/C][C]0.130076[/C][/ROW]
[ROW][C]18[/C][C]0.013188[/C][C]0.1258[/C][C]0.450082[/C][/ROW]
[ROW][C]19[/C][C]-0.004495[/C][C]-0.0429[/C][C]0.482946[/C][/ROW]
[ROW][C]20[/C][C]0.115959[/C][C]1.1062[/C][C]0.135782[/C][/ROW]
[ROW][C]21[/C][C]-0.125961[/C][C]-1.2016[/C][C]0.11632[/C][/ROW]
[ROW][C]22[/C][C]-0.170966[/C][C]-1.6309[/C][C]0.053183[/C][/ROW]
[ROW][C]23[/C][C]0.041927[/C][C]0.4[/C][C]0.345061[/C][/ROW]
[ROW][C]24[/C][C]0.316534[/C][C]3.0195[/C][C]0.001642[/C][/ROW]
[ROW][C]25[/C][C]-0.104069[/C][C]-0.9928[/C][C]0.16173[/C][/ROW]
[ROW][C]26[/C][C]-0.009041[/C][C]-0.0862[/C][C]0.465732[/C][/ROW]
[ROW][C]27[/C][C]-0.153203[/C][C]-1.4615[/C][C]0.073666[/C][/ROW]
[ROW][C]28[/C][C]0.013067[/C][C]0.1246[/C][C]0.450538[/C][/ROW]
[ROW][C]29[/C][C]0.089019[/C][C]0.8492[/C][C]0.199004[/C][/ROW]
[ROW][C]30[/C][C]-0.016807[/C][C]-0.1603[/C][C]0.436489[/C][/ROW]
[ROW][C]31[/C][C]0.04401[/C][C]0.4198[/C][C]0.3378[/C][/ROW]
[ROW][C]32[/C][C]0.052957[/C][C]0.5052[/C][C]0.307328[/C][/ROW]
[ROW][C]33[/C][C]-0.158708[/C][C]-1.514[/C][C]0.066748[/C][/ROW]
[ROW][C]34[/C][C]-0.064771[/C][C]-0.6179[/C][C]0.269099[/C][/ROW]
[ROW][C]35[/C][C]0.013444[/C][C]0.1282[/C][C]0.449119[/C][/ROW]
[ROW][C]36[/C][C]0.240623[/C][C]2.2954[/C][C]0.012004[/C][/ROW]
[/TABLE]
Source: https://freestatistics.org/blog/index.php?pk=29789&T=1

Globally Unique Identifier (entire table): ba.freestatistics.org/blog/index.php?pk=29789&T=1

As an alternative you can also use a QR Code:  

The GUIDs for individual cells are displayed in the table below:

Autocorrelation Function
Time lag kACF(k)T-STATP-value
1-0.338704-3.2310.000859
2-0.201711-1.92420.028727
30.0351230.33510.369177
4-0.076866-0.73330.232644
50.0963810.91940.180155
60.0710020.67730.249963
7-0.044482-0.42430.336162
80.0666530.63580.263242
9-0.048539-0.4630.322222
10-0.194742-1.85770.033221
11-0.128628-1.2270.111487
120.5762695.49730
13-0.195294-1.8630.032845
14-0.10372-0.98940.16254
15-0.096152-0.91720.180722
16-0.021876-0.20870.417582
170.118781.13310.130076
180.0131880.12580.450082
19-0.004495-0.04290.482946
200.1159591.10620.135782
21-0.125961-1.20160.11632
22-0.170966-1.63090.053183
230.0419270.40.345061
240.3165343.01950.001642
25-0.104069-0.99280.16173
26-0.009041-0.08620.465732
27-0.153203-1.46150.073666
280.0130670.12460.450538
290.0890190.84920.199004
30-0.016807-0.16030.436489
310.044010.41980.3378
320.0529570.50520.307328
33-0.158708-1.5140.066748
34-0.064771-0.61790.269099
350.0134440.12820.449119
360.2406232.29540.012004


Partial Autocorrelation Function
Time lag kPACF(k)T-STATP-value
1-0.338704-3.2310.000859
2-0.357437-3.40970.000486
3-0.231401-2.20740.014899
4-0.314367-2.99890.001747
5-0.177724-1.69540.046712
6-0.069627-0.66420.254121
7-0.034241-0.32660.372347
80.129391.23430.110134
90.137111.30790.097093
10-0.119565-1.14060.12852
11-0.49615-4.7334e-06
120.2256832.15290.016987
130.0639670.61020.271622
140.1122131.07040.143626
15-0.152841-1.4580.07414
16-0.058535-0.55840.288974
17-0.110217-1.05140.147929
18-0.12175-1.16140.124255
19-0.03818-0.36420.35827
200.0927510.88480.189301
210.041060.39170.348102
22-0.089322-0.85210.198204
230.0658940.62860.265595
240.03410.32530.372853
25-0.006962-0.06640.473599
260.0722650.68940.246173
270.1127781.07580.142422
280.0771130.73560.231931
29-0.004127-0.03940.484341
300.0081630.07790.469052
310.012010.11460.45452
32-0.088115-0.84060.201397
33-0.140346-1.33880.091982
340.0167610.15990.436661
35-0.060655-0.57860.282141
360.0493980.47120.319302

\begin{tabular}{lllllllll}
\hline
Partial Autocorrelation Function \tabularnewline
Time lag k & PACF(k) & T-STAT & P-value \tabularnewline
1 & -0.338704 & -3.231 & 0.000859 \tabularnewline
2 & -0.357437 & -3.4097 & 0.000486 \tabularnewline
3 & -0.231401 & -2.2074 & 0.014899 \tabularnewline
4 & -0.314367 & -2.9989 & 0.001747 \tabularnewline
5 & -0.177724 & -1.6954 & 0.046712 \tabularnewline
6 & -0.069627 & -0.6642 & 0.254121 \tabularnewline
7 & -0.034241 & -0.3266 & 0.372347 \tabularnewline
8 & 0.12939 & 1.2343 & 0.110134 \tabularnewline
9 & 0.13711 & 1.3079 & 0.097093 \tabularnewline
10 & -0.119565 & -1.1406 & 0.12852 \tabularnewline
11 & -0.49615 & -4.733 & 4e-06 \tabularnewline
12 & 0.225683 & 2.1529 & 0.016987 \tabularnewline
13 & 0.063967 & 0.6102 & 0.271622 \tabularnewline
14 & 0.112213 & 1.0704 & 0.143626 \tabularnewline
15 & -0.152841 & -1.458 & 0.07414 \tabularnewline
16 & -0.058535 & -0.5584 & 0.288974 \tabularnewline
17 & -0.110217 & -1.0514 & 0.147929 \tabularnewline
18 & -0.12175 & -1.1614 & 0.124255 \tabularnewline
19 & -0.03818 & -0.3642 & 0.35827 \tabularnewline
20 & 0.092751 & 0.8848 & 0.189301 \tabularnewline
21 & 0.04106 & 0.3917 & 0.348102 \tabularnewline
22 & -0.089322 & -0.8521 & 0.198204 \tabularnewline
23 & 0.065894 & 0.6286 & 0.265595 \tabularnewline
24 & 0.0341 & 0.3253 & 0.372853 \tabularnewline
25 & -0.006962 & -0.0664 & 0.473599 \tabularnewline
26 & 0.072265 & 0.6894 & 0.246173 \tabularnewline
27 & 0.112778 & 1.0758 & 0.142422 \tabularnewline
28 & 0.077113 & 0.7356 & 0.231931 \tabularnewline
29 & -0.004127 & -0.0394 & 0.484341 \tabularnewline
30 & 0.008163 & 0.0779 & 0.469052 \tabularnewline
31 & 0.01201 & 0.1146 & 0.45452 \tabularnewline
32 & -0.088115 & -0.8406 & 0.201397 \tabularnewline
33 & -0.140346 & -1.3388 & 0.091982 \tabularnewline
34 & 0.016761 & 0.1599 & 0.436661 \tabularnewline
35 & -0.060655 & -0.5786 & 0.282141 \tabularnewline
36 & 0.049398 & 0.4712 & 0.319302 \tabularnewline
\hline
\end{tabular}
%Source: https://freestatistics.org/blog/index.php?pk=29789&T=2

[TABLE]
[ROW][C]Partial Autocorrelation Function[/C][/ROW]
[ROW][C]Time lag k[/C][C]PACF(k)[/C][C]T-STAT[/C][C]P-value[/C][/ROW]
[ROW][C]1[/C][C]-0.338704[/C][C]-3.231[/C][C]0.000859[/C][/ROW]
[ROW][C]2[/C][C]-0.357437[/C][C]-3.4097[/C][C]0.000486[/C][/ROW]
[ROW][C]3[/C][C]-0.231401[/C][C]-2.2074[/C][C]0.014899[/C][/ROW]
[ROW][C]4[/C][C]-0.314367[/C][C]-2.9989[/C][C]0.001747[/C][/ROW]
[ROW][C]5[/C][C]-0.177724[/C][C]-1.6954[/C][C]0.046712[/C][/ROW]
[ROW][C]6[/C][C]-0.069627[/C][C]-0.6642[/C][C]0.254121[/C][/ROW]
[ROW][C]7[/C][C]-0.034241[/C][C]-0.3266[/C][C]0.372347[/C][/ROW]
[ROW][C]8[/C][C]0.12939[/C][C]1.2343[/C][C]0.110134[/C][/ROW]
[ROW][C]9[/C][C]0.13711[/C][C]1.3079[/C][C]0.097093[/C][/ROW]
[ROW][C]10[/C][C]-0.119565[/C][C]-1.1406[/C][C]0.12852[/C][/ROW]
[ROW][C]11[/C][C]-0.49615[/C][C]-4.733[/C][C]4e-06[/C][/ROW]
[ROW][C]12[/C][C]0.225683[/C][C]2.1529[/C][C]0.016987[/C][/ROW]
[ROW][C]13[/C][C]0.063967[/C][C]0.6102[/C][C]0.271622[/C][/ROW]
[ROW][C]14[/C][C]0.112213[/C][C]1.0704[/C][C]0.143626[/C][/ROW]
[ROW][C]15[/C][C]-0.152841[/C][C]-1.458[/C][C]0.07414[/C][/ROW]
[ROW][C]16[/C][C]-0.058535[/C][C]-0.5584[/C][C]0.288974[/C][/ROW]
[ROW][C]17[/C][C]-0.110217[/C][C]-1.0514[/C][C]0.147929[/C][/ROW]
[ROW][C]18[/C][C]-0.12175[/C][C]-1.1614[/C][C]0.124255[/C][/ROW]
[ROW][C]19[/C][C]-0.03818[/C][C]-0.3642[/C][C]0.35827[/C][/ROW]
[ROW][C]20[/C][C]0.092751[/C][C]0.8848[/C][C]0.189301[/C][/ROW]
[ROW][C]21[/C][C]0.04106[/C][C]0.3917[/C][C]0.348102[/C][/ROW]
[ROW][C]22[/C][C]-0.089322[/C][C]-0.8521[/C][C]0.198204[/C][/ROW]
[ROW][C]23[/C][C]0.065894[/C][C]0.6286[/C][C]0.265595[/C][/ROW]
[ROW][C]24[/C][C]0.0341[/C][C]0.3253[/C][C]0.372853[/C][/ROW]
[ROW][C]25[/C][C]-0.006962[/C][C]-0.0664[/C][C]0.473599[/C][/ROW]
[ROW][C]26[/C][C]0.072265[/C][C]0.6894[/C][C]0.246173[/C][/ROW]
[ROW][C]27[/C][C]0.112778[/C][C]1.0758[/C][C]0.142422[/C][/ROW]
[ROW][C]28[/C][C]0.077113[/C][C]0.7356[/C][C]0.231931[/C][/ROW]
[ROW][C]29[/C][C]-0.004127[/C][C]-0.0394[/C][C]0.484341[/C][/ROW]
[ROW][C]30[/C][C]0.008163[/C][C]0.0779[/C][C]0.469052[/C][/ROW]
[ROW][C]31[/C][C]0.01201[/C][C]0.1146[/C][C]0.45452[/C][/ROW]
[ROW][C]32[/C][C]-0.088115[/C][C]-0.8406[/C][C]0.201397[/C][/ROW]
[ROW][C]33[/C][C]-0.140346[/C][C]-1.3388[/C][C]0.091982[/C][/ROW]
[ROW][C]34[/C][C]0.016761[/C][C]0.1599[/C][C]0.436661[/C][/ROW]
[ROW][C]35[/C][C]-0.060655[/C][C]-0.5786[/C][C]0.282141[/C][/ROW]
[ROW][C]36[/C][C]0.049398[/C][C]0.4712[/C][C]0.319302[/C][/ROW]
[/TABLE]
Source: https://freestatistics.org/blog/index.php?pk=29789&T=2

Globally Unique Identifier (entire table): ba.freestatistics.org/blog/index.php?pk=29789&T=2

As an alternative you can also use a QR Code:  

The GUIDs for individual cells are displayed in the table below:

Partial Autocorrelation Function
Time lag kPACF(k)T-STATP-value
1-0.338704-3.2310.000859
2-0.357437-3.40970.000486
3-0.231401-2.20740.014899
4-0.314367-2.99890.001747
5-0.177724-1.69540.046712
6-0.069627-0.66420.254121
7-0.034241-0.32660.372347
80.129391.23430.110134
90.137111.30790.097093
10-0.119565-1.14060.12852
11-0.49615-4.7334e-06
120.2256832.15290.016987
130.0639670.61020.271622
140.1122131.07040.143626
15-0.152841-1.4580.07414
16-0.058535-0.55840.288974
17-0.110217-1.05140.147929
18-0.12175-1.16140.124255
19-0.03818-0.36420.35827
200.0927510.88480.189301
210.041060.39170.348102
22-0.089322-0.85210.198204
230.0658940.62860.265595
240.03410.32530.372853
25-0.006962-0.06640.473599
260.0722650.68940.246173
270.1127781.07580.142422
280.0771130.73560.231931
29-0.004127-0.03940.484341
300.0081630.07790.469052
310.012010.11460.45452
32-0.088115-0.84060.201397
33-0.140346-1.33880.091982
340.0167610.15990.436661
35-0.060655-0.57860.282141
360.0493980.47120.319302


Parameters (Session):
par1 = 36 ; par2 = 1 ; par3 = 1 ; par4 = 0 ; par5 = 12 ;
Parameters (R input):
par1 = 36 ; par2 = 1 ; par3 = 1 ; par4 = 0 ; par5 = 12 ;
R code (references can be found in the software module):
if (par1 == 'Default') {
par1 = 10*log10(length(x))
} else {
par1 <- as.numeric(par1)
}
par2 <- as.numeric(par2)
par3 <- as.numeric(par3)
par4 <- as.numeric(par4)
par5 <- as.numeric(par5)
if (par2 == 0) {
x <- log(x)
} else {
x <- (x ^ par2 - 1) / par2
}
if (par3 > 0) x <- diff(x,lag=1,difference=par3)
if (par4 > 0) x <- diff(x,lag=par5,difference=par4)
bitmap(file='pic1.png')
racf <- acf(x,par1,main='Autocorrelation',xlab='lags',ylab='ACF')
dev.off()
bitmap(file='pic2.png')
rpacf <- pacf(x,par1,main='Partial Autocorrelation',xlab='lags',ylab='PACF')
dev.off()
(myacf <- c(racf$acf))
(mypacf <- c(rpacf$acf))
lengthx <- length(x)
sqrtn <- sqrt(lengthx)
load(file='createtable')
a<-table.start()
a<-table.row.start(a)
a<-table.element(a,'Autocorrelation Function',4,TRUE)
a<-table.row.end(a)
a<-table.row.start(a)
a<-table.element(a,'Time lag k',header=TRUE)
a<-table.element(a,hyperlink('basics.htm','ACF(k)','click here for more information about the Autocorrelation Function'),header=TRUE)
a<-table.element(a,'T-STAT',header=TRUE)
a<-table.element(a,'P-value',header=TRUE)
a<-table.row.end(a)
for (i in 2:(par1+1)) {
a<-table.row.start(a)
a<-table.element(a,i-1,header=TRUE)
a<-table.element(a,round(myacf[i],6))
mytstat <- myacf[i]*sqrtn
a<-table.element(a,round(mytstat,4))
a<-table.element(a,round(1-pt(abs(mytstat),lengthx),6))
a<-table.row.end(a)
}
a<-table.end(a)
table.save(a,file='mytable.tab')
a<-table.start()
a<-table.row.start(a)
a<-table.element(a,'Partial Autocorrelation Function',4,TRUE)
a<-table.row.end(a)
a<-table.row.start(a)
a<-table.element(a,'Time lag k',header=TRUE)
a<-table.element(a,hyperlink('basics.htm','PACF(k)','click here for more information about the Partial Autocorrelation Function'),header=TRUE)
a<-table.element(a,'T-STAT',header=TRUE)
a<-table.element(a,'P-value',header=TRUE)
a<-table.row.end(a)
for (i in 1:par1) {
a<-table.row.start(a)
a<-table.element(a,i,header=TRUE)
a<-table.element(a,round(mypacf[i],6))
mytstat <- mypacf[i]*sqrtn
a<-table.element(a,round(mytstat,4))
a<-table.element(a,round(1-pt(abs(mytstat),lengthx),6))
a<-table.row.end(a)
}
a<-table.end(a)
table.save(a,file='mytable1.tab')