Free Statistics

of Irreproducible Research!

Author's title

Author*The author of this computation has been verified*
R Software Modulerwasp_autocorrelation.wasp
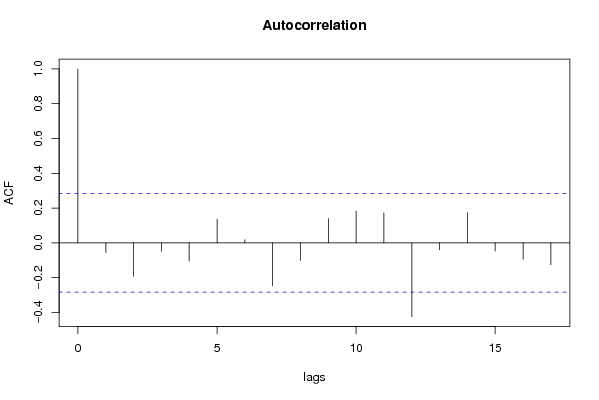
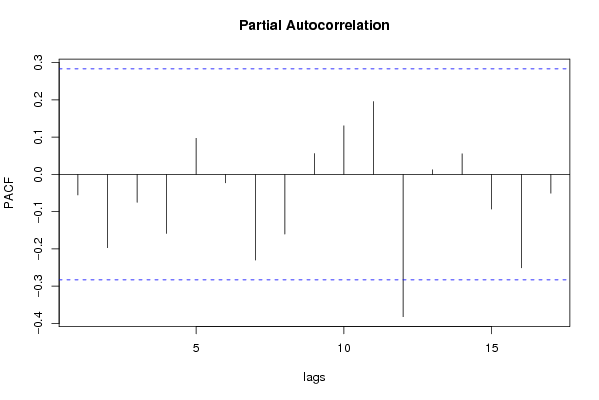
Title produced by software(Partial) Autocorrelation Function
Date of computationSat, 06 Dec 2008 11:01:53 -0700
Cite this page as followsStatistical Computations at FreeStatistics.org, Office for Research Development and Education, URL https://freestatistics.org/blog/index.php?v=date/2008/Dec/06/t1228586602v9agnuap56jxcw4.htm/, Retrieved Sun, 19 May 2024 09:37:28 +0000
Statistical Computations at FreeStatistics.org, Office for Research Development and Education, URL https://freestatistics.org/blog/index.php?pk=29775, Retrieved Sun, 19 May 2024 09:37:28 +0000
QR Codes:

Original text written by user:
IsPrivate?No (this computation is public)
User-defined keywords
Estimated Impact153
Family? (F = Feedback message, R = changed R code, M = changed R Module, P = changed Parameters, D = changed Data)
-     [Univariate Data Series] [data set] [2008-12-01 19:54:57] [b98453cac15ba1066b407e146608df68]
F RMPD    [(Partial) Autocorrelation Function] [ACF diesel] [2008-12-06 18:01:53] [9ba97de59bb4d2edf0cfeac4ca7d2b73] [Current]
F   P       [(Partial) Autocorrelation Function] [step 3 ACF] [2008-12-13 13:20:33] [82970caad4b026be9dd352fdec547fe4]
F RMP       [ARIMA Backward Selection] [Step 5] [2008-12-13 13:35:28] [82970caad4b026be9dd352fdec547fe4]
Feedback Forum
2008-12-13 13:10:24 [Ruben Jacobs] [reply
Hier neem je best als time lags 60. Dit geeft een beter overzicht. Je kan altijd best beginnen met d=0 en D=0, zo kan je de evolutie zien. Als je dus niet differentieert zie je een sterke significante autocorrelatie met een dalende trend. Dit wijst op een lange termijn trend.
Het is dus nodig om met d=1 te differentieren. Als je dit doet zie je dat er geen autocorrelatie meer is en het dus niet nodig is om verder te differentieren.

Post a new message
Dataseries X:
0.84
0.76
0.77
0.76
0.77
0.78
0.79
0.78
0.76
0.78
0.76
0.74
0.73
0.72
0.71
0.73
0.75
0.75
0.72
0.72
0.72
0.74
0.78
0.74
0.74
0.75
0.78
0.81
0.75
0.7
0.71
0.71
0.73
0.74
0.74
0.75
0.74
0.74
0.73
0.76
0.8
0.83
0.81
0.83
0.88
0.89
0.93
0.91
0.9
0.86
0.88
0.93
0.98
0.97
1.03
1.06
1.06
1.09
1.04
1
1.04


Summary of computational transaction
Raw Inputview raw input (R code)
Raw Outputview raw output of R engine
Computing time2 seconds
R Server'Sir Ronald Aylmer Fisher' @ 193.190.124.24

\begin{tabular}{lllllllll}
\hline
Summary of computational transaction \tabularnewline
Raw Input & view raw input (R code)  \tabularnewline
Raw Output & view raw output of R engine  \tabularnewline
Computing time & 2 seconds \tabularnewline
R Server & 'Sir Ronald Aylmer Fisher' @ 193.190.124.24 \tabularnewline
\hline
\end{tabular}
%Source: https://freestatistics.org/blog/index.php?pk=29775&T=0

[TABLE]
[ROW][C]Summary of computational transaction[/C][/ROW]
[ROW][C]Raw Input[/C][C]view raw input (R code) [/C][/ROW]
[ROW][C]Raw Output[/C][C]view raw output of R engine [/C][/ROW]
[ROW][C]Computing time[/C][C]2 seconds[/C][/ROW]
[ROW][C]R Server[/C][C]'Sir Ronald Aylmer Fisher' @ 193.190.124.24[/C][/ROW]
[/TABLE]
Source: https://freestatistics.org/blog/index.php?pk=29775&T=0

Globally Unique Identifier (entire table): ba.freestatistics.org/blog/index.php?pk=29775&T=0

As an alternative you can also use a QR Code:  

The GUIDs for individual cells are displayed in the table below:

Summary of computational transaction
Raw Inputview raw input (R code)
Raw Outputview raw output of R engine
Computing time2 seconds
R Server'Sir Ronald Aylmer Fisher' @ 193.190.124.24


Autocorrelation Function
Time lag kACF(k)T-STATP-value
1-0.05503-0.38130.352346
2-0.192933-1.33670.093815
3-0.04816-0.33370.370045
4-0.104063-0.7210.237213
50.1362630.94410.174934
60.0186760.12940.448794
7-0.246493-1.70780.047072
8-0.101611-0.7040.242423
90.139560.96690.16922
100.1839271.27430.104349
110.1724731.19490.118993
12-0.424184-2.93880.002526
13-0.039657-0.27480.392342
140.1740261.20570.116924
15-0.046748-0.32390.373717
16-0.094443-0.65430.258013
17-0.126267-0.87480.193018

\begin{tabular}{lllllllll}
\hline
Autocorrelation Function \tabularnewline
Time lag k & ACF(k) & T-STAT & P-value \tabularnewline
1 & -0.05503 & -0.3813 & 0.352346 \tabularnewline
2 & -0.192933 & -1.3367 & 0.093815 \tabularnewline
3 & -0.04816 & -0.3337 & 0.370045 \tabularnewline
4 & -0.104063 & -0.721 & 0.237213 \tabularnewline
5 & 0.136263 & 0.9441 & 0.174934 \tabularnewline
6 & 0.018676 & 0.1294 & 0.448794 \tabularnewline
7 & -0.246493 & -1.7078 & 0.047072 \tabularnewline
8 & -0.101611 & -0.704 & 0.242423 \tabularnewline
9 & 0.13956 & 0.9669 & 0.16922 \tabularnewline
10 & 0.183927 & 1.2743 & 0.104349 \tabularnewline
11 & 0.172473 & 1.1949 & 0.118993 \tabularnewline
12 & -0.424184 & -2.9388 & 0.002526 \tabularnewline
13 & -0.039657 & -0.2748 & 0.392342 \tabularnewline
14 & 0.174026 & 1.2057 & 0.116924 \tabularnewline
15 & -0.046748 & -0.3239 & 0.373717 \tabularnewline
16 & -0.094443 & -0.6543 & 0.258013 \tabularnewline
17 & -0.126267 & -0.8748 & 0.193018 \tabularnewline
\hline
\end{tabular}
%Source: https://freestatistics.org/blog/index.php?pk=29775&T=1

[TABLE]
[ROW][C]Autocorrelation Function[/C][/ROW]
[ROW][C]Time lag k[/C][C]ACF(k)[/C][C]T-STAT[/C][C]P-value[/C][/ROW]
[ROW][C]1[/C][C]-0.05503[/C][C]-0.3813[/C][C]0.352346[/C][/ROW]
[ROW][C]2[/C][C]-0.192933[/C][C]-1.3367[/C][C]0.093815[/C][/ROW]
[ROW][C]3[/C][C]-0.04816[/C][C]-0.3337[/C][C]0.370045[/C][/ROW]
[ROW][C]4[/C][C]-0.104063[/C][C]-0.721[/C][C]0.237213[/C][/ROW]
[ROW][C]5[/C][C]0.136263[/C][C]0.9441[/C][C]0.174934[/C][/ROW]
[ROW][C]6[/C][C]0.018676[/C][C]0.1294[/C][C]0.448794[/C][/ROW]
[ROW][C]7[/C][C]-0.246493[/C][C]-1.7078[/C][C]0.047072[/C][/ROW]
[ROW][C]8[/C][C]-0.101611[/C][C]-0.704[/C][C]0.242423[/C][/ROW]
[ROW][C]9[/C][C]0.13956[/C][C]0.9669[/C][C]0.16922[/C][/ROW]
[ROW][C]10[/C][C]0.183927[/C][C]1.2743[/C][C]0.104349[/C][/ROW]
[ROW][C]11[/C][C]0.172473[/C][C]1.1949[/C][C]0.118993[/C][/ROW]
[ROW][C]12[/C][C]-0.424184[/C][C]-2.9388[/C][C]0.002526[/C][/ROW]
[ROW][C]13[/C][C]-0.039657[/C][C]-0.2748[/C][C]0.392342[/C][/ROW]
[ROW][C]14[/C][C]0.174026[/C][C]1.2057[/C][C]0.116924[/C][/ROW]
[ROW][C]15[/C][C]-0.046748[/C][C]-0.3239[/C][C]0.373717[/C][/ROW]
[ROW][C]16[/C][C]-0.094443[/C][C]-0.6543[/C][C]0.258013[/C][/ROW]
[ROW][C]17[/C][C]-0.126267[/C][C]-0.8748[/C][C]0.193018[/C][/ROW]
[/TABLE]
Source: https://freestatistics.org/blog/index.php?pk=29775&T=1

Globally Unique Identifier (entire table): ba.freestatistics.org/blog/index.php?pk=29775&T=1

As an alternative you can also use a QR Code:  

The GUIDs for individual cells are displayed in the table below:

Autocorrelation Function
Time lag kACF(k)T-STATP-value
1-0.05503-0.38130.352346
2-0.192933-1.33670.093815
3-0.04816-0.33370.370045
4-0.104063-0.7210.237213
50.1362630.94410.174934
60.0186760.12940.448794
7-0.246493-1.70780.047072
8-0.101611-0.7040.242423
90.139560.96690.16922
100.1839271.27430.104349
110.1724731.19490.118993
12-0.424184-2.93880.002526
13-0.039657-0.27480.392342
140.1740261.20570.116924
15-0.046748-0.32390.373717
16-0.094443-0.65430.258013
17-0.126267-0.87480.193018


Partial Autocorrelation Function
Time lag kPACF(k)T-STATP-value
1-0.05503-0.38130.352346
2-0.196556-1.36180.089812
3-0.074787-0.51810.30337
4-0.158358-1.09710.139028
50.0966480.66960.253162
6-0.022669-0.15710.43793
7-0.229642-1.5910.059087
8-0.160133-1.10940.136386
90.0558640.3870.350219
100.130210.90210.185748
110.1953741.35360.091103
12-0.381625-2.6440.005519
130.0121710.08430.466576
140.0551870.38230.351947
15-0.093085-0.64490.261029
16-0.250512-1.73560.044526
17-0.050359-0.34890.364345

\begin{tabular}{lllllllll}
\hline
Partial Autocorrelation Function \tabularnewline
Time lag k & PACF(k) & T-STAT & P-value \tabularnewline
1 & -0.05503 & -0.3813 & 0.352346 \tabularnewline
2 & -0.196556 & -1.3618 & 0.089812 \tabularnewline
3 & -0.074787 & -0.5181 & 0.30337 \tabularnewline
4 & -0.158358 & -1.0971 & 0.139028 \tabularnewline
5 & 0.096648 & 0.6696 & 0.253162 \tabularnewline
6 & -0.022669 & -0.1571 & 0.43793 \tabularnewline
7 & -0.229642 & -1.591 & 0.059087 \tabularnewline
8 & -0.160133 & -1.1094 & 0.136386 \tabularnewline
9 & 0.055864 & 0.387 & 0.350219 \tabularnewline
10 & 0.13021 & 0.9021 & 0.185748 \tabularnewline
11 & 0.195374 & 1.3536 & 0.091103 \tabularnewline
12 & -0.381625 & -2.644 & 0.005519 \tabularnewline
13 & 0.012171 & 0.0843 & 0.466576 \tabularnewline
14 & 0.055187 & 0.3823 & 0.351947 \tabularnewline
15 & -0.093085 & -0.6449 & 0.261029 \tabularnewline
16 & -0.250512 & -1.7356 & 0.044526 \tabularnewline
17 & -0.050359 & -0.3489 & 0.364345 \tabularnewline
\hline
\end{tabular}
%Source: https://freestatistics.org/blog/index.php?pk=29775&T=2

[TABLE]
[ROW][C]Partial Autocorrelation Function[/C][/ROW]
[ROW][C]Time lag k[/C][C]PACF(k)[/C][C]T-STAT[/C][C]P-value[/C][/ROW]
[ROW][C]1[/C][C]-0.05503[/C][C]-0.3813[/C][C]0.352346[/C][/ROW]
[ROW][C]2[/C][C]-0.196556[/C][C]-1.3618[/C][C]0.089812[/C][/ROW]
[ROW][C]3[/C][C]-0.074787[/C][C]-0.5181[/C][C]0.30337[/C][/ROW]
[ROW][C]4[/C][C]-0.158358[/C][C]-1.0971[/C][C]0.139028[/C][/ROW]
[ROW][C]5[/C][C]0.096648[/C][C]0.6696[/C][C]0.253162[/C][/ROW]
[ROW][C]6[/C][C]-0.022669[/C][C]-0.1571[/C][C]0.43793[/C][/ROW]
[ROW][C]7[/C][C]-0.229642[/C][C]-1.591[/C][C]0.059087[/C][/ROW]
[ROW][C]8[/C][C]-0.160133[/C][C]-1.1094[/C][C]0.136386[/C][/ROW]
[ROW][C]9[/C][C]0.055864[/C][C]0.387[/C][C]0.350219[/C][/ROW]
[ROW][C]10[/C][C]0.13021[/C][C]0.9021[/C][C]0.185748[/C][/ROW]
[ROW][C]11[/C][C]0.195374[/C][C]1.3536[/C][C]0.091103[/C][/ROW]
[ROW][C]12[/C][C]-0.381625[/C][C]-2.644[/C][C]0.005519[/C][/ROW]
[ROW][C]13[/C][C]0.012171[/C][C]0.0843[/C][C]0.466576[/C][/ROW]
[ROW][C]14[/C][C]0.055187[/C][C]0.3823[/C][C]0.351947[/C][/ROW]
[ROW][C]15[/C][C]-0.093085[/C][C]-0.6449[/C][C]0.261029[/C][/ROW]
[ROW][C]16[/C][C]-0.250512[/C][C]-1.7356[/C][C]0.044526[/C][/ROW]
[ROW][C]17[/C][C]-0.050359[/C][C]-0.3489[/C][C]0.364345[/C][/ROW]
[/TABLE]
Source: https://freestatistics.org/blog/index.php?pk=29775&T=2

Globally Unique Identifier (entire table): ba.freestatistics.org/blog/index.php?pk=29775&T=2

As an alternative you can also use a QR Code:  

The GUIDs for individual cells are displayed in the table below:

Partial Autocorrelation Function
Time lag kPACF(k)T-STATP-value
1-0.05503-0.38130.352346
2-0.196556-1.36180.089812
3-0.074787-0.51810.30337
4-0.158358-1.09710.139028
50.0966480.66960.253162
6-0.022669-0.15710.43793
7-0.229642-1.5910.059087
8-0.160133-1.10940.136386
90.0558640.3870.350219
100.130210.90210.185748
110.1953741.35360.091103
12-0.381625-2.6440.005519
130.0121710.08430.466576
140.0551870.38230.351947
15-0.093085-0.64490.261029
16-0.250512-1.73560.044526
17-0.050359-0.34890.364345


Parameters (Session):
par1 = Default ; par2 = 1 ; par3 = 1 ; par4 = 1 ; par5 = 12 ;
Parameters (R input):
par1 = Default ; par2 = 1 ; par3 = 1 ; par4 = 1 ; par5 = 12 ;
R code (references can be found in the software module):
if (par1 == 'Default') {
par1 = 10*log10(length(x))
} else {
par1 <- as.numeric(par1)
}
par2 <- as.numeric(par2)
par3 <- as.numeric(par3)
par4 <- as.numeric(par4)
par5 <- as.numeric(par5)
if (par2 == 0) {
x <- log(x)
} else {
x <- (x ^ par2 - 1) / par2
}
if (par3 > 0) x <- diff(x,lag=1,difference=par3)
if (par4 > 0) x <- diff(x,lag=par5,difference=par4)
bitmap(file='pic1.png')
racf <- acf(x,par1,main='Autocorrelation',xlab='lags',ylab='ACF')
dev.off()
bitmap(file='pic2.png')
rpacf <- pacf(x,par1,main='Partial Autocorrelation',xlab='lags',ylab='PACF')
dev.off()
(myacf <- c(racf$acf))
(mypacf <- c(rpacf$acf))
lengthx <- length(x)
sqrtn <- sqrt(lengthx)
load(file='createtable')
a<-table.start()
a<-table.row.start(a)
a<-table.element(a,'Autocorrelation Function',4,TRUE)
a<-table.row.end(a)
a<-table.row.start(a)
a<-table.element(a,'Time lag k',header=TRUE)
a<-table.element(a,hyperlink('basics.htm','ACF(k)','click here for more information about the Autocorrelation Function'),header=TRUE)
a<-table.element(a,'T-STAT',header=TRUE)
a<-table.element(a,'P-value',header=TRUE)
a<-table.row.end(a)
for (i in 2:(par1+1)) {
a<-table.row.start(a)
a<-table.element(a,i-1,header=TRUE)
a<-table.element(a,round(myacf[i],6))
mytstat <- myacf[i]*sqrtn
a<-table.element(a,round(mytstat,4))
a<-table.element(a,round(1-pt(abs(mytstat),lengthx),6))
a<-table.row.end(a)
}
a<-table.end(a)
table.save(a,file='mytable.tab')
a<-table.start()
a<-table.row.start(a)
a<-table.element(a,'Partial Autocorrelation Function',4,TRUE)
a<-table.row.end(a)
a<-table.row.start(a)
a<-table.element(a,'Time lag k',header=TRUE)
a<-table.element(a,hyperlink('basics.htm','PACF(k)','click here for more information about the Partial Autocorrelation Function'),header=TRUE)
a<-table.element(a,'T-STAT',header=TRUE)
a<-table.element(a,'P-value',header=TRUE)
a<-table.row.end(a)
for (i in 1:par1) {
a<-table.row.start(a)
a<-table.element(a,i,header=TRUE)
a<-table.element(a,round(mypacf[i],6))
mytstat <- mypacf[i]*sqrtn
a<-table.element(a,round(mytstat,4))
a<-table.element(a,round(1-pt(abs(mytstat),lengthx),6))
a<-table.row.end(a)
}
a<-table.end(a)
table.save(a,file='mytable1.tab')