Free Statistics

of Irreproducible Research!

Author's title

Author*Unverified author*
R Software Modulerwasp_autocorrelation.wasp
Title produced by software(Partial) Autocorrelation Function
Date of computationSat, 06 Dec 2008 08:00:43 -0700
Cite this page as followsStatistical Computations at FreeStatistics.org, Office for Research Development and Education, URL https://freestatistics.org/blog/index.php?v=date/2008/Dec/06/t1228575706jszuula637pmtlc.htm/, Retrieved Sun, 19 May 2024 11:34:25 +0000
Statistical Computations at FreeStatistics.org, Office for Research Development and Education, URL https://freestatistics.org/blog/index.php?pk=29684, Retrieved Sun, 19 May 2024 11:34:25 +0000
QR Codes:

Original text written by user:
IsPrivate?No (this computation is public)
User-defined keywords
Estimated Impact153
Family? (F = Feedback message, R = changed R code, M = changed R Module, P = changed Parameters, D = changed Data)
-     [Mean Plot] [Opgave 6-1/2- Ins...] [2008-12-04 18:02:51] [ad379bf1a8c2f692a4d6e13d12ca6606]
- RMPD    [(Partial) Autocorrelation Function] [Opgave 6bis - 2/2...] [2008-12-06 15:00:43] [c3b8efbffd908bee7ef47d968749a3e1] [Current]
Feedback Forum

Post a new message
Dataseries X:
105.6
110.2
104.9
102.9
102.6
103.6
107.8
106.6
106
105.2
107.9
107.5
107.5
113.3
107.8
104.5
105.1
104.2
106.6
103.8
107.7
106.4
110
113.2
113.9
112
113.9
113.1
111.7
110.7
113.5
114
112.7
112.2
115.8
118.4
118.8
123.9
118
120.2
118.7
119.8
124.8
121.3
120.2
118.3
129.6
130.2
127.19
133.1
129.12
123.28
123.36
124.13
126.96
127.14
123.7
123.67
130.19
134.01
124.96
129.96
128.32
132.38
126.25
128.91
131.42
129.44
126.86
126.71
131.63
132.78
126.61
132.84
123.14
128.13
125.49
126.48
130.86
127.32
126.56
126.64
129.26
126.47
135.38
135.5
132.22
122.62
125.16
128.5
133.86
128.87
125.07
125.25
132.16
130.24


Summary of computational transaction
Raw Inputview raw input (R code)
Raw Outputview raw output of R engine
Computing time1 seconds
R Server'Gwilym Jenkins' @ 72.249.127.135

\begin{tabular}{lllllllll}
\hline
Summary of computational transaction \tabularnewline
Raw Input & view raw input (R code)  \tabularnewline
Raw Output & view raw output of R engine  \tabularnewline
Computing time & 1 seconds \tabularnewline
R Server & 'Gwilym Jenkins' @ 72.249.127.135 \tabularnewline
\hline
\end{tabular}
%Source: https://freestatistics.org/blog/index.php?pk=29684&T=0

[TABLE]
[ROW][C]Summary of computational transaction[/C][/ROW]
[ROW][C]Raw Input[/C][C]view raw input (R code) [/C][/ROW]
[ROW][C]Raw Output[/C][C]view raw output of R engine [/C][/ROW]
[ROW][C]Computing time[/C][C]1 seconds[/C][/ROW]
[ROW][C]R Server[/C][C]'Gwilym Jenkins' @ 72.249.127.135[/C][/ROW]
[/TABLE]
Source: https://freestatistics.org/blog/index.php?pk=29684&T=0

Globally Unique Identifier (entire table): ba.freestatistics.org/blog/index.php?pk=29684&T=0

As an alternative you can also use a QR Code:  

The GUIDs for individual cells are displayed in the table below:

Summary of computational transaction
Raw Inputview raw input (R code)
Raw Outputview raw output of R engine
Computing time1 seconds
R Server'Gwilym Jenkins' @ 72.249.127.135


Autocorrelation Function
Time lag kACF(k)T-STATP-value
1-0.299745-2.92160.002176
2-0.108104-1.05370.147353
3-0.178464-1.73940.042598
40.0904830.88190.190024
50.1020590.99480.161192
6-0.096009-0.93580.175879
70.0536910.52330.300987
8-0.057958-0.56490.286735
9-0.023082-0.2250.411239
10-0.043841-0.42730.335062
11-0.103223-1.00610.158464
120.3522333.43310.000443
13-0.021286-0.20750.418044
14-0.09993-0.9740.166265
15-0.008391-0.08180.467495
16-0.038506-0.37530.354133
170.1108441.08040.141356
18-0.184506-1.79830.037649
190.1889361.84150.034333
20-0.1211-1.18030.120406
210.0098590.09610.461823
22-0.122284-1.19190.11814
230.0965460.9410.174541
240.2105232.05190.021464
25-0.144923-1.41250.080531
260.0195380.19040.424686
270.0262640.2560.399256
28-0.12464-1.21480.113719
290.1261491.22950.110952
30-0.173688-1.69290.046876
310.1631181.58990.057592
32-0.064054-0.62430.266958
33-0.057299-0.55850.288914
34-0.129324-1.26050.105289
350.0411270.40090.344711
360.3448583.36130.000559
37-0.148606-1.44840.075394
38-0.058093-0.56620.286289
39-0.010722-0.10450.458495
40-0.034943-0.34060.367083
410.0513520.50050.308933
42-0.026242-0.25580.399337
430.0605660.59030.278188
44-0.101941-0.99360.161472
450.0311150.30330.381175
46-0.099931-0.9740.166264
470.0184850.18020.4287
480.1619081.57810.058935

\begin{tabular}{lllllllll}
\hline
Autocorrelation Function \tabularnewline
Time lag k & ACF(k) & T-STAT & P-value \tabularnewline
1 & -0.299745 & -2.9216 & 0.002176 \tabularnewline
2 & -0.108104 & -1.0537 & 0.147353 \tabularnewline
3 & -0.178464 & -1.7394 & 0.042598 \tabularnewline
4 & 0.090483 & 0.8819 & 0.190024 \tabularnewline
5 & 0.102059 & 0.9948 & 0.161192 \tabularnewline
6 & -0.096009 & -0.9358 & 0.175879 \tabularnewline
7 & 0.053691 & 0.5233 & 0.300987 \tabularnewline
8 & -0.057958 & -0.5649 & 0.286735 \tabularnewline
9 & -0.023082 & -0.225 & 0.411239 \tabularnewline
10 & -0.043841 & -0.4273 & 0.335062 \tabularnewline
11 & -0.103223 & -1.0061 & 0.158464 \tabularnewline
12 & 0.352233 & 3.4331 & 0.000443 \tabularnewline
13 & -0.021286 & -0.2075 & 0.418044 \tabularnewline
14 & -0.09993 & -0.974 & 0.166265 \tabularnewline
15 & -0.008391 & -0.0818 & 0.467495 \tabularnewline
16 & -0.038506 & -0.3753 & 0.354133 \tabularnewline
17 & 0.110844 & 1.0804 & 0.141356 \tabularnewline
18 & -0.184506 & -1.7983 & 0.037649 \tabularnewline
19 & 0.188936 & 1.8415 & 0.034333 \tabularnewline
20 & -0.1211 & -1.1803 & 0.120406 \tabularnewline
21 & 0.009859 & 0.0961 & 0.461823 \tabularnewline
22 & -0.122284 & -1.1919 & 0.11814 \tabularnewline
23 & 0.096546 & 0.941 & 0.174541 \tabularnewline
24 & 0.210523 & 2.0519 & 0.021464 \tabularnewline
25 & -0.144923 & -1.4125 & 0.080531 \tabularnewline
26 & 0.019538 & 0.1904 & 0.424686 \tabularnewline
27 & 0.026264 & 0.256 & 0.399256 \tabularnewline
28 & -0.12464 & -1.2148 & 0.113719 \tabularnewline
29 & 0.126149 & 1.2295 & 0.110952 \tabularnewline
30 & -0.173688 & -1.6929 & 0.046876 \tabularnewline
31 & 0.163118 & 1.5899 & 0.057592 \tabularnewline
32 & -0.064054 & -0.6243 & 0.266958 \tabularnewline
33 & -0.057299 & -0.5585 & 0.288914 \tabularnewline
34 & -0.129324 & -1.2605 & 0.105289 \tabularnewline
35 & 0.041127 & 0.4009 & 0.344711 \tabularnewline
36 & 0.344858 & 3.3613 & 0.000559 \tabularnewline
37 & -0.148606 & -1.4484 & 0.075394 \tabularnewline
38 & -0.058093 & -0.5662 & 0.286289 \tabularnewline
39 & -0.010722 & -0.1045 & 0.458495 \tabularnewline
40 & -0.034943 & -0.3406 & 0.367083 \tabularnewline
41 & 0.051352 & 0.5005 & 0.308933 \tabularnewline
42 & -0.026242 & -0.2558 & 0.399337 \tabularnewline
43 & 0.060566 & 0.5903 & 0.278188 \tabularnewline
44 & -0.101941 & -0.9936 & 0.161472 \tabularnewline
45 & 0.031115 & 0.3033 & 0.381175 \tabularnewline
46 & -0.099931 & -0.974 & 0.166264 \tabularnewline
47 & 0.018485 & 0.1802 & 0.4287 \tabularnewline
48 & 0.161908 & 1.5781 & 0.058935 \tabularnewline
\hline
\end{tabular}
%Source: https://freestatistics.org/blog/index.php?pk=29684&T=1

[TABLE]
[ROW][C]Autocorrelation Function[/C][/ROW]
[ROW][C]Time lag k[/C][C]ACF(k)[/C][C]T-STAT[/C][C]P-value[/C][/ROW]
[ROW][C]1[/C][C]-0.299745[/C][C]-2.9216[/C][C]0.002176[/C][/ROW]
[ROW][C]2[/C][C]-0.108104[/C][C]-1.0537[/C][C]0.147353[/C][/ROW]
[ROW][C]3[/C][C]-0.178464[/C][C]-1.7394[/C][C]0.042598[/C][/ROW]
[ROW][C]4[/C][C]0.090483[/C][C]0.8819[/C][C]0.190024[/C][/ROW]
[ROW][C]5[/C][C]0.102059[/C][C]0.9948[/C][C]0.161192[/C][/ROW]
[ROW][C]6[/C][C]-0.096009[/C][C]-0.9358[/C][C]0.175879[/C][/ROW]
[ROW][C]7[/C][C]0.053691[/C][C]0.5233[/C][C]0.300987[/C][/ROW]
[ROW][C]8[/C][C]-0.057958[/C][C]-0.5649[/C][C]0.286735[/C][/ROW]
[ROW][C]9[/C][C]-0.023082[/C][C]-0.225[/C][C]0.411239[/C][/ROW]
[ROW][C]10[/C][C]-0.043841[/C][C]-0.4273[/C][C]0.335062[/C][/ROW]
[ROW][C]11[/C][C]-0.103223[/C][C]-1.0061[/C][C]0.158464[/C][/ROW]
[ROW][C]12[/C][C]0.352233[/C][C]3.4331[/C][C]0.000443[/C][/ROW]
[ROW][C]13[/C][C]-0.021286[/C][C]-0.2075[/C][C]0.418044[/C][/ROW]
[ROW][C]14[/C][C]-0.09993[/C][C]-0.974[/C][C]0.166265[/C][/ROW]
[ROW][C]15[/C][C]-0.008391[/C][C]-0.0818[/C][C]0.467495[/C][/ROW]
[ROW][C]16[/C][C]-0.038506[/C][C]-0.3753[/C][C]0.354133[/C][/ROW]
[ROW][C]17[/C][C]0.110844[/C][C]1.0804[/C][C]0.141356[/C][/ROW]
[ROW][C]18[/C][C]-0.184506[/C][C]-1.7983[/C][C]0.037649[/C][/ROW]
[ROW][C]19[/C][C]0.188936[/C][C]1.8415[/C][C]0.034333[/C][/ROW]
[ROW][C]20[/C][C]-0.1211[/C][C]-1.1803[/C][C]0.120406[/C][/ROW]
[ROW][C]21[/C][C]0.009859[/C][C]0.0961[/C][C]0.461823[/C][/ROW]
[ROW][C]22[/C][C]-0.122284[/C][C]-1.1919[/C][C]0.11814[/C][/ROW]
[ROW][C]23[/C][C]0.096546[/C][C]0.941[/C][C]0.174541[/C][/ROW]
[ROW][C]24[/C][C]0.210523[/C][C]2.0519[/C][C]0.021464[/C][/ROW]
[ROW][C]25[/C][C]-0.144923[/C][C]-1.4125[/C][C]0.080531[/C][/ROW]
[ROW][C]26[/C][C]0.019538[/C][C]0.1904[/C][C]0.424686[/C][/ROW]
[ROW][C]27[/C][C]0.026264[/C][C]0.256[/C][C]0.399256[/C][/ROW]
[ROW][C]28[/C][C]-0.12464[/C][C]-1.2148[/C][C]0.113719[/C][/ROW]
[ROW][C]29[/C][C]0.126149[/C][C]1.2295[/C][C]0.110952[/C][/ROW]
[ROW][C]30[/C][C]-0.173688[/C][C]-1.6929[/C][C]0.046876[/C][/ROW]
[ROW][C]31[/C][C]0.163118[/C][C]1.5899[/C][C]0.057592[/C][/ROW]
[ROW][C]32[/C][C]-0.064054[/C][C]-0.6243[/C][C]0.266958[/C][/ROW]
[ROW][C]33[/C][C]-0.057299[/C][C]-0.5585[/C][C]0.288914[/C][/ROW]
[ROW][C]34[/C][C]-0.129324[/C][C]-1.2605[/C][C]0.105289[/C][/ROW]
[ROW][C]35[/C][C]0.041127[/C][C]0.4009[/C][C]0.344711[/C][/ROW]
[ROW][C]36[/C][C]0.344858[/C][C]3.3613[/C][C]0.000559[/C][/ROW]
[ROW][C]37[/C][C]-0.148606[/C][C]-1.4484[/C][C]0.075394[/C][/ROW]
[ROW][C]38[/C][C]-0.058093[/C][C]-0.5662[/C][C]0.286289[/C][/ROW]
[ROW][C]39[/C][C]-0.010722[/C][C]-0.1045[/C][C]0.458495[/C][/ROW]
[ROW][C]40[/C][C]-0.034943[/C][C]-0.3406[/C][C]0.367083[/C][/ROW]
[ROW][C]41[/C][C]0.051352[/C][C]0.5005[/C][C]0.308933[/C][/ROW]
[ROW][C]42[/C][C]-0.026242[/C][C]-0.2558[/C][C]0.399337[/C][/ROW]
[ROW][C]43[/C][C]0.060566[/C][C]0.5903[/C][C]0.278188[/C][/ROW]
[ROW][C]44[/C][C]-0.101941[/C][C]-0.9936[/C][C]0.161472[/C][/ROW]
[ROW][C]45[/C][C]0.031115[/C][C]0.3033[/C][C]0.381175[/C][/ROW]
[ROW][C]46[/C][C]-0.099931[/C][C]-0.974[/C][C]0.166264[/C][/ROW]
[ROW][C]47[/C][C]0.018485[/C][C]0.1802[/C][C]0.4287[/C][/ROW]
[ROW][C]48[/C][C]0.161908[/C][C]1.5781[/C][C]0.058935[/C][/ROW]
[/TABLE]
Source: https://freestatistics.org/blog/index.php?pk=29684&T=1

Globally Unique Identifier (entire table): ba.freestatistics.org/blog/index.php?pk=29684&T=1

As an alternative you can also use a QR Code:  

The GUIDs for individual cells are displayed in the table below:

Autocorrelation Function
Time lag kACF(k)T-STATP-value
1-0.299745-2.92160.002176
2-0.108104-1.05370.147353
3-0.178464-1.73940.042598
40.0904830.88190.190024
50.1020590.99480.161192
6-0.096009-0.93580.175879
70.0536910.52330.300987
8-0.057958-0.56490.286735
9-0.023082-0.2250.411239
10-0.043841-0.42730.335062
11-0.103223-1.00610.158464
120.3522333.43310.000443
13-0.021286-0.20750.418044
14-0.09993-0.9740.166265
15-0.008391-0.08180.467495
16-0.038506-0.37530.354133
170.1108441.08040.141356
18-0.184506-1.79830.037649
190.1889361.84150.034333
20-0.1211-1.18030.120406
210.0098590.09610.461823
22-0.122284-1.19190.11814
230.0965460.9410.174541
240.2105232.05190.021464
25-0.144923-1.41250.080531
260.0195380.19040.424686
270.0262640.2560.399256
28-0.12464-1.21480.113719
290.1261491.22950.110952
30-0.173688-1.69290.046876
310.1631181.58990.057592
32-0.064054-0.62430.266958
33-0.057299-0.55850.288914
34-0.129324-1.26050.105289
350.0411270.40090.344711
360.3448583.36130.000559
37-0.148606-1.44840.075394
38-0.058093-0.56620.286289
39-0.010722-0.10450.458495
40-0.034943-0.34060.367083
410.0513520.50050.308933
42-0.026242-0.25580.399337
430.0605660.59030.278188
44-0.101941-0.99360.161472
450.0311150.30330.381175
46-0.099931-0.9740.166264
470.0184850.18020.4287
480.1619081.57810.058935


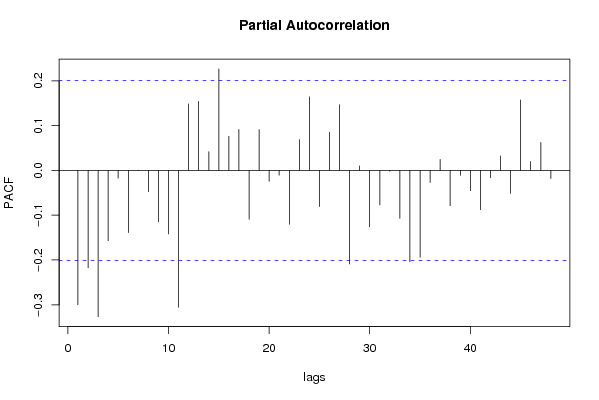
Partial Autocorrelation Function
Time lag kPACF(k)T-STATP-value
1-0.299745-2.92160.002176
2-0.217492-2.11990.018312
3-0.326499-3.18230.000987
4-0.156942-1.52970.06471
5-0.017339-0.1690.43308
6-0.138886-1.35370.089523
70.0005520.00540.497859
8-0.047515-0.46310.322171
9-0.114782-1.11880.133032
10-0.141812-1.38220.085073
11-0.305781-2.98040.001828
120.1484141.44660.075655
130.1538731.49980.068496
140.0417320.40680.342552
150.226452.20720.014856
160.0759660.74040.230434
170.0914130.8910.187596
18-0.108839-1.06080.145728
190.0911690.88860.18823
20-0.024438-0.23820.406122
21-0.010704-0.10430.458563
22-0.120253-1.17210.122048
230.0688760.67130.251822
240.1643551.60190.056245
25-0.080665-0.78620.216847
260.0852130.83050.204155
270.1465871.42880.078177
28-0.208819-2.03530.022303
290.0098160.09570.461989
30-0.125856-1.22670.111485
31-0.077124-0.75170.22704
32-0.001987-0.01940.492293
33-0.106862-1.04160.15013
34-0.203947-1.98780.024855
35-0.194068-1.89150.030799
36-0.02691-0.26230.396836
370.0244690.23850.406006
38-0.078745-0.76750.222342
39-0.011191-0.10910.456688
40-0.045327-0.44180.329823
41-0.087625-0.85410.197609
42-0.016606-0.16190.435883
430.0319840.31170.377962
44-0.051503-0.5020.308417
450.1572041.53220.064393
460.0198430.19340.423527
470.0623570.60780.272391
48-0.018223-0.17760.429703

\begin{tabular}{lllllllll}
\hline
Partial Autocorrelation Function \tabularnewline
Time lag k & PACF(k) & T-STAT & P-value \tabularnewline
1 & -0.299745 & -2.9216 & 0.002176 \tabularnewline
2 & -0.217492 & -2.1199 & 0.018312 \tabularnewline
3 & -0.326499 & -3.1823 & 0.000987 \tabularnewline
4 & -0.156942 & -1.5297 & 0.06471 \tabularnewline
5 & -0.017339 & -0.169 & 0.43308 \tabularnewline
6 & -0.138886 & -1.3537 & 0.089523 \tabularnewline
7 & 0.000552 & 0.0054 & 0.497859 \tabularnewline
8 & -0.047515 & -0.4631 & 0.322171 \tabularnewline
9 & -0.114782 & -1.1188 & 0.133032 \tabularnewline
10 & -0.141812 & -1.3822 & 0.085073 \tabularnewline
11 & -0.305781 & -2.9804 & 0.001828 \tabularnewline
12 & 0.148414 & 1.4466 & 0.075655 \tabularnewline
13 & 0.153873 & 1.4998 & 0.068496 \tabularnewline
14 & 0.041732 & 0.4068 & 0.342552 \tabularnewline
15 & 0.22645 & 2.2072 & 0.014856 \tabularnewline
16 & 0.075966 & 0.7404 & 0.230434 \tabularnewline
17 & 0.091413 & 0.891 & 0.187596 \tabularnewline
18 & -0.108839 & -1.0608 & 0.145728 \tabularnewline
19 & 0.091169 & 0.8886 & 0.18823 \tabularnewline
20 & -0.024438 & -0.2382 & 0.406122 \tabularnewline
21 & -0.010704 & -0.1043 & 0.458563 \tabularnewline
22 & -0.120253 & -1.1721 & 0.122048 \tabularnewline
23 & 0.068876 & 0.6713 & 0.251822 \tabularnewline
24 & 0.164355 & 1.6019 & 0.056245 \tabularnewline
25 & -0.080665 & -0.7862 & 0.216847 \tabularnewline
26 & 0.085213 & 0.8305 & 0.204155 \tabularnewline
27 & 0.146587 & 1.4288 & 0.078177 \tabularnewline
28 & -0.208819 & -2.0353 & 0.022303 \tabularnewline
29 & 0.009816 & 0.0957 & 0.461989 \tabularnewline
30 & -0.125856 & -1.2267 & 0.111485 \tabularnewline
31 & -0.077124 & -0.7517 & 0.22704 \tabularnewline
32 & -0.001987 & -0.0194 & 0.492293 \tabularnewline
33 & -0.106862 & -1.0416 & 0.15013 \tabularnewline
34 & -0.203947 & -1.9878 & 0.024855 \tabularnewline
35 & -0.194068 & -1.8915 & 0.030799 \tabularnewline
36 & -0.02691 & -0.2623 & 0.396836 \tabularnewline
37 & 0.024469 & 0.2385 & 0.406006 \tabularnewline
38 & -0.078745 & -0.7675 & 0.222342 \tabularnewline
39 & -0.011191 & -0.1091 & 0.456688 \tabularnewline
40 & -0.045327 & -0.4418 & 0.329823 \tabularnewline
41 & -0.087625 & -0.8541 & 0.197609 \tabularnewline
42 & -0.016606 & -0.1619 & 0.435883 \tabularnewline
43 & 0.031984 & 0.3117 & 0.377962 \tabularnewline
44 & -0.051503 & -0.502 & 0.308417 \tabularnewline
45 & 0.157204 & 1.5322 & 0.064393 \tabularnewline
46 & 0.019843 & 0.1934 & 0.423527 \tabularnewline
47 & 0.062357 & 0.6078 & 0.272391 \tabularnewline
48 & -0.018223 & -0.1776 & 0.429703 \tabularnewline
\hline
\end{tabular}
%Source: https://freestatistics.org/blog/index.php?pk=29684&T=2

[TABLE]
[ROW][C]Partial Autocorrelation Function[/C][/ROW]
[ROW][C]Time lag k[/C][C]PACF(k)[/C][C]T-STAT[/C][C]P-value[/C][/ROW]
[ROW][C]1[/C][C]-0.299745[/C][C]-2.9216[/C][C]0.002176[/C][/ROW]
[ROW][C]2[/C][C]-0.217492[/C][C]-2.1199[/C][C]0.018312[/C][/ROW]
[ROW][C]3[/C][C]-0.326499[/C][C]-3.1823[/C][C]0.000987[/C][/ROW]
[ROW][C]4[/C][C]-0.156942[/C][C]-1.5297[/C][C]0.06471[/C][/ROW]
[ROW][C]5[/C][C]-0.017339[/C][C]-0.169[/C][C]0.43308[/C][/ROW]
[ROW][C]6[/C][C]-0.138886[/C][C]-1.3537[/C][C]0.089523[/C][/ROW]
[ROW][C]7[/C][C]0.000552[/C][C]0.0054[/C][C]0.497859[/C][/ROW]
[ROW][C]8[/C][C]-0.047515[/C][C]-0.4631[/C][C]0.322171[/C][/ROW]
[ROW][C]9[/C][C]-0.114782[/C][C]-1.1188[/C][C]0.133032[/C][/ROW]
[ROW][C]10[/C][C]-0.141812[/C][C]-1.3822[/C][C]0.085073[/C][/ROW]
[ROW][C]11[/C][C]-0.305781[/C][C]-2.9804[/C][C]0.001828[/C][/ROW]
[ROW][C]12[/C][C]0.148414[/C][C]1.4466[/C][C]0.075655[/C][/ROW]
[ROW][C]13[/C][C]0.153873[/C][C]1.4998[/C][C]0.068496[/C][/ROW]
[ROW][C]14[/C][C]0.041732[/C][C]0.4068[/C][C]0.342552[/C][/ROW]
[ROW][C]15[/C][C]0.22645[/C][C]2.2072[/C][C]0.014856[/C][/ROW]
[ROW][C]16[/C][C]0.075966[/C][C]0.7404[/C][C]0.230434[/C][/ROW]
[ROW][C]17[/C][C]0.091413[/C][C]0.891[/C][C]0.187596[/C][/ROW]
[ROW][C]18[/C][C]-0.108839[/C][C]-1.0608[/C][C]0.145728[/C][/ROW]
[ROW][C]19[/C][C]0.091169[/C][C]0.8886[/C][C]0.18823[/C][/ROW]
[ROW][C]20[/C][C]-0.024438[/C][C]-0.2382[/C][C]0.406122[/C][/ROW]
[ROW][C]21[/C][C]-0.010704[/C][C]-0.1043[/C][C]0.458563[/C][/ROW]
[ROW][C]22[/C][C]-0.120253[/C][C]-1.1721[/C][C]0.122048[/C][/ROW]
[ROW][C]23[/C][C]0.068876[/C][C]0.6713[/C][C]0.251822[/C][/ROW]
[ROW][C]24[/C][C]0.164355[/C][C]1.6019[/C][C]0.056245[/C][/ROW]
[ROW][C]25[/C][C]-0.080665[/C][C]-0.7862[/C][C]0.216847[/C][/ROW]
[ROW][C]26[/C][C]0.085213[/C][C]0.8305[/C][C]0.204155[/C][/ROW]
[ROW][C]27[/C][C]0.146587[/C][C]1.4288[/C][C]0.078177[/C][/ROW]
[ROW][C]28[/C][C]-0.208819[/C][C]-2.0353[/C][C]0.022303[/C][/ROW]
[ROW][C]29[/C][C]0.009816[/C][C]0.0957[/C][C]0.461989[/C][/ROW]
[ROW][C]30[/C][C]-0.125856[/C][C]-1.2267[/C][C]0.111485[/C][/ROW]
[ROW][C]31[/C][C]-0.077124[/C][C]-0.7517[/C][C]0.22704[/C][/ROW]
[ROW][C]32[/C][C]-0.001987[/C][C]-0.0194[/C][C]0.492293[/C][/ROW]
[ROW][C]33[/C][C]-0.106862[/C][C]-1.0416[/C][C]0.15013[/C][/ROW]
[ROW][C]34[/C][C]-0.203947[/C][C]-1.9878[/C][C]0.024855[/C][/ROW]
[ROW][C]35[/C][C]-0.194068[/C][C]-1.8915[/C][C]0.030799[/C][/ROW]
[ROW][C]36[/C][C]-0.02691[/C][C]-0.2623[/C][C]0.396836[/C][/ROW]
[ROW][C]37[/C][C]0.024469[/C][C]0.2385[/C][C]0.406006[/C][/ROW]
[ROW][C]38[/C][C]-0.078745[/C][C]-0.7675[/C][C]0.222342[/C][/ROW]
[ROW][C]39[/C][C]-0.011191[/C][C]-0.1091[/C][C]0.456688[/C][/ROW]
[ROW][C]40[/C][C]-0.045327[/C][C]-0.4418[/C][C]0.329823[/C][/ROW]
[ROW][C]41[/C][C]-0.087625[/C][C]-0.8541[/C][C]0.197609[/C][/ROW]
[ROW][C]42[/C][C]-0.016606[/C][C]-0.1619[/C][C]0.435883[/C][/ROW]
[ROW][C]43[/C][C]0.031984[/C][C]0.3117[/C][C]0.377962[/C][/ROW]
[ROW][C]44[/C][C]-0.051503[/C][C]-0.502[/C][C]0.308417[/C][/ROW]
[ROW][C]45[/C][C]0.157204[/C][C]1.5322[/C][C]0.064393[/C][/ROW]
[ROW][C]46[/C][C]0.019843[/C][C]0.1934[/C][C]0.423527[/C][/ROW]
[ROW][C]47[/C][C]0.062357[/C][C]0.6078[/C][C]0.272391[/C][/ROW]
[ROW][C]48[/C][C]-0.018223[/C][C]-0.1776[/C][C]0.429703[/C][/ROW]
[/TABLE]
Source: https://freestatistics.org/blog/index.php?pk=29684&T=2

Globally Unique Identifier (entire table): ba.freestatistics.org/blog/index.php?pk=29684&T=2

As an alternative you can also use a QR Code:  

The GUIDs for individual cells are displayed in the table below:

Partial Autocorrelation Function
Time lag kPACF(k)T-STATP-value
1-0.299745-2.92160.002176
2-0.217492-2.11990.018312
3-0.326499-3.18230.000987
4-0.156942-1.52970.06471
5-0.017339-0.1690.43308
6-0.138886-1.35370.089523
70.0005520.00540.497859
8-0.047515-0.46310.322171
9-0.114782-1.11880.133032
10-0.141812-1.38220.085073
11-0.305781-2.98040.001828
120.1484141.44660.075655
130.1538731.49980.068496
140.0417320.40680.342552
150.226452.20720.014856
160.0759660.74040.230434
170.0914130.8910.187596
18-0.108839-1.06080.145728
190.0911690.88860.18823
20-0.024438-0.23820.406122
21-0.010704-0.10430.458563
22-0.120253-1.17210.122048
230.0688760.67130.251822
240.1643551.60190.056245
25-0.080665-0.78620.216847
260.0852130.83050.204155
270.1465871.42880.078177
28-0.208819-2.03530.022303
290.0098160.09570.461989
30-0.125856-1.22670.111485
31-0.077124-0.75170.22704
32-0.001987-0.01940.492293
33-0.106862-1.04160.15013
34-0.203947-1.98780.024855
35-0.194068-1.89150.030799
36-0.02691-0.26230.396836
370.0244690.23850.406006
38-0.078745-0.76750.222342
39-0.011191-0.10910.456688
40-0.045327-0.44180.329823
41-0.087625-0.85410.197609
42-0.016606-0.16190.435883
430.0319840.31170.377962
44-0.051503-0.5020.308417
450.1572041.53220.064393
460.0198430.19340.423527
470.0623570.60780.272391
48-0.018223-0.17760.429703


Parameters (Session):
par1 = 48 ; par2 = 1 ; par3 = 1 ; par4 = 0 ; par5 = 12 ;
Parameters (R input):
par1 = 48 ; par2 = 1 ; par3 = 1 ; par4 = 0 ; par5 = 12 ;
R code (references can be found in the software module):
if (par1 == 'Default') {
par1 = 10*log10(length(x))
} else {
par1 <- as.numeric(par1)
}
par2 <- as.numeric(par2)
par3 <- as.numeric(par3)
par4 <- as.numeric(par4)
par5 <- as.numeric(par5)
if (par2 == 0) {
x <- log(x)
} else {
x <- (x ^ par2 - 1) / par2
}
if (par3 > 0) x <- diff(x,lag=1,difference=par3)
if (par4 > 0) x <- diff(x,lag=par5,difference=par4)
bitmap(file='pic1.png')
racf <- acf(x,par1,main='Autocorrelation',xlab='lags',ylab='ACF')
dev.off()
bitmap(file='pic2.png')
rpacf <- pacf(x,par1,main='Partial Autocorrelation',xlab='lags',ylab='PACF')
dev.off()
(myacf <- c(racf$acf))
(mypacf <- c(rpacf$acf))
lengthx <- length(x)
sqrtn <- sqrt(lengthx)
load(file='createtable')
a<-table.start()
a<-table.row.start(a)
a<-table.element(a,'Autocorrelation Function',4,TRUE)
a<-table.row.end(a)
a<-table.row.start(a)
a<-table.element(a,'Time lag k',header=TRUE)
a<-table.element(a,hyperlink('basics.htm','ACF(k)','click here for more information about the Autocorrelation Function'),header=TRUE)
a<-table.element(a,'T-STAT',header=TRUE)
a<-table.element(a,'P-value',header=TRUE)
a<-table.row.end(a)
for (i in 2:(par1+1)) {
a<-table.row.start(a)
a<-table.element(a,i-1,header=TRUE)
a<-table.element(a,round(myacf[i],6))
mytstat <- myacf[i]*sqrtn
a<-table.element(a,round(mytstat,4))
a<-table.element(a,round(1-pt(abs(mytstat),lengthx),6))
a<-table.row.end(a)
}
a<-table.end(a)
table.save(a,file='mytable.tab')
a<-table.start()
a<-table.row.start(a)
a<-table.element(a,'Partial Autocorrelation Function',4,TRUE)
a<-table.row.end(a)
a<-table.row.start(a)
a<-table.element(a,'Time lag k',header=TRUE)
a<-table.element(a,hyperlink('basics.htm','PACF(k)','click here for more information about the Partial Autocorrelation Function'),header=TRUE)
a<-table.element(a,'T-STAT',header=TRUE)
a<-table.element(a,'P-value',header=TRUE)
a<-table.row.end(a)
for (i in 1:par1) {
a<-table.row.start(a)
a<-table.element(a,i,header=TRUE)
a<-table.element(a,round(mypacf[i],6))
mytstat <- mypacf[i]*sqrtn
a<-table.element(a,round(mytstat,4))
a<-table.element(a,round(1-pt(abs(mytstat),lengthx),6))
a<-table.row.end(a)
}
a<-table.end(a)
table.save(a,file='mytable1.tab')