Free Statistics
of Irreproducible Research!
Description of Statistical Computation | |||||||||||||||||||||
|---|---|---|---|---|---|---|---|---|---|---|---|---|---|---|---|---|---|---|---|---|---|
| Author's title | |||||||||||||||||||||
| Author | *The author of this computation has been verified* | ||||||||||||||||||||
| R Software Module | rwasp_backtobackhist.wasp | ||||||||||||||||||||
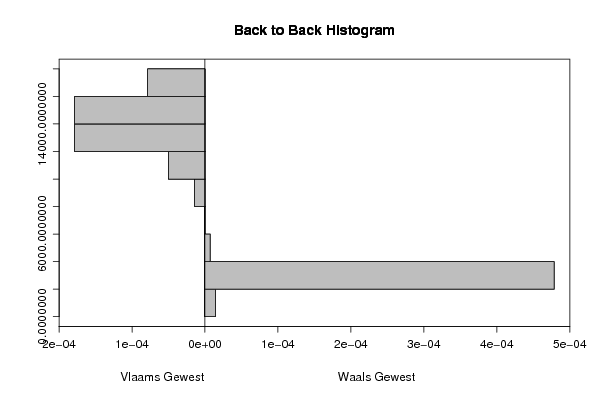
| Title produced by software | Back to Back Histogram | ||||||||||||||||||||
| Date of computation | Sat, 06 Dec 2008 07:15:54 -0700 | ||||||||||||||||||||
| Cite this page as follows | Statistical Computations at FreeStatistics.org, Office for Research Development and Education, URL https://freestatistics.org/blog/index.php?v=date/2008/Dec/06/t1228573020qjqq2ncviq3ejyc.htm/, Retrieved Sun, 19 May 2024 10:45:15 +0000 | ||||||||||||||||||||
| Statistical Computations at FreeStatistics.org, Office for Research Development and Education, URL https://freestatistics.org/blog/index.php?pk=29627, Retrieved Sun, 19 May 2024 10:45:15 +0000 | |||||||||||||||||||||
| QR Codes: | |||||||||||||||||||||
|
| |||||||||||||||||||||
| Original text written by user: | |||||||||||||||||||||
| IsPrivate? | No (this computation is public) | ||||||||||||||||||||
| User-defined keywords | |||||||||||||||||||||
| Estimated Impact | 154 | ||||||||||||||||||||
Tree of Dependent Computations | |||||||||||||||||||||
| Family? (F = Feedback message, R = changed R code, M = changed R Module, P = changed Parameters, D = changed Data) | |||||||||||||||||||||
| - [Back to Back Histogram] [] [2008-12-06 14:15:54] [6d40a467de0f28bd2350f82ac9522c51] [Current] - PD [Back to Back Histogram] [] [2008-12-06 14:41:51] [4c8dfb519edec2da3492d7e6be9a5685] - RMP [Pearson Correlation] [] [2008-12-06 14:47:15] [4c8dfb519edec2da3492d7e6be9a5685] - D [Pearson Correlation] [] [2008-12-06 14:54:12] [4c8dfb519edec2da3492d7e6be9a5685] - D [Pearson Correlation] [] [2008-12-06 14:58:38] [4c8dfb519edec2da3492d7e6be9a5685] | |||||||||||||||||||||
| Feedback Forum | |||||||||||||||||||||
Post a new message | |||||||||||||||||||||
Dataset | |||||||||||||||||||||
| Dataseries X: | |||||||||||||||||||||
12055 12113 9617 12646 13581 12162 10970 11880 11888 12927 12300 12093 12381 12197 9455 13168 13428 11981 11885 11692 12234 14341 13131 12421 14286 12865 11160 14316 14389 14014 13419 12770 13316 15333 14243 13824 14963 13203 12199 15509 14200 15170 14058 13786 14148 16542 13588 15582 15803 14131 12923 15612 16034 16037 14038 15331 15038 17402 14993 16044 16930 15921 14417 15961 17852 16484 14216 17430 17840 17629 | |||||||||||||||||||||
| Dataseries Y: | |||||||||||||||||||||
2411 2361 1924 2487 2675 2296 2102 2322 2274 2501 2435 2273 2455 2329 1897 2608 2712 2322 2283 2241 2417 2829 2601 2321 2769 2457 2143 2764 2789 2680 2537 2683 2700 3098 3015 2878 3011 2612 2419 3097 3013 3397 3423 3299 3066 3918 3154 3335 3462 3019 2832 3301 3343 3464 3017 3201 3135 3550 3247 3442 3536 3385 2997 3403 3900 3776 3198 4022 3845 3818 | |||||||||||||||||||||
Tables (Output of Computation) | |||||||||||||||||||||
| |||||||||||||||||||||
Figures (Output of Computation) | |||||||||||||||||||||
Input Parameters & R Code | |||||||||||||||||||||
| Parameters (Session): | |||||||||||||||||||||
| par1 = grey ; par2 = grey ; par3 = TRUE ; par4 = Vlaams Gewest ; par5 = Waals Gewest ; | |||||||||||||||||||||
| Parameters (R input): | |||||||||||||||||||||
| par1 = grey ; par2 = grey ; par3 = TRUE ; par4 = Vlaams Gewest ; par5 = Waals Gewest ; | |||||||||||||||||||||
| R code (references can be found in the software module): | |||||||||||||||||||||
if (par3 == 'TRUE') par3 <- TRUE | |||||||||||||||||||||