Free Statistics

of Irreproducible Research!

Author's title

Standard Deviation-Mean Plot toegepast op het aantal faillissementen in het...

Author*The author of this computation has been verified*
R Software Modulerwasp_smp.wasp
Title produced by softwareStandard Deviation-Mean Plot
Date of computationSat, 06 Dec 2008 01:32:54 -0700
Cite this page as followsStatistical Computations at FreeStatistics.org, Office for Research Development and Education, URL https://freestatistics.org/blog/index.php?v=date/2008/Dec/06/t1228552459p6v2xo7q3a4oqdh.htm/, Retrieved Tue, 28 May 2024 01:05:42 +0000
Statistical Computations at FreeStatistics.org, Office for Research Development and Education, URL https://freestatistics.org/blog/index.php?pk=29420, Retrieved Tue, 28 May 2024 01:05:42 +0000
QR Codes:

Original text written by user:
IsPrivate?No (this computation is public)
User-defined keywords
Estimated Impact220
Family? (F = Feedback message, R = changed R code, M = changed R Module, P = changed Parameters, D = changed Data)
-       [Standard Deviation-Mean Plot] [Standard Deviatio...] [2008-12-06 08:32:54] [6fc58909ffe15c247a4f6748c8841ab4] [Current]
Feedback Forum

Post a new message
Dataseries X:
293
301
362
330
328
405
232
159
336
361
329
339
290
328
375
294
340
364
248
145
380
305
291
319
334
318
362
296
300
342
215
185
343
333
316
252
320
324
343
295
301
367
196
182
342
361
334
330
345
323
366
323
316
358
235
169
430
409
407
341
326
374
364
349
300
385
304
196
443
414
325
388
356
386
444
387
327
448
225
182
460
411
342
361
377
331
428
340
352
461
221
198
422
329
320
375
364
351
380
319
322
386
221
187
344
342
365
313
356
337
389
326
343
357
220
218
391
425
332
298


Summary of computational transaction
Raw Inputview raw input (R code)
Raw Outputview raw output of R engine
Computing time2 seconds
R Server'Gwilym Jenkins' @ 72.249.127.135

\begin{tabular}{lllllllll}
\hline
Summary of computational transaction \tabularnewline
Raw Input & view raw input (R code)  \tabularnewline
Raw Output & view raw output of R engine  \tabularnewline
Computing time & 2 seconds \tabularnewline
R Server & 'Gwilym Jenkins' @ 72.249.127.135 \tabularnewline
\hline
\end{tabular}
%Source: https://freestatistics.org/blog/index.php?pk=29420&T=0

[TABLE]
[ROW][C]Summary of computational transaction[/C][/ROW]
[ROW][C]Raw Input[/C][C]view raw input (R code) [/C][/ROW]
[ROW][C]Raw Output[/C][C]view raw output of R engine [/C][/ROW]
[ROW][C]Computing time[/C][C]2 seconds[/C][/ROW]
[ROW][C]R Server[/C][C]'Gwilym Jenkins' @ 72.249.127.135[/C][/ROW]
[/TABLE]
Source: https://freestatistics.org/blog/index.php?pk=29420&T=0

Globally Unique Identifier (entire table): ba.freestatistics.org/blog/index.php?pk=29420&T=0

As an alternative you can also use a QR Code:  

The GUIDs for individual cells are displayed in the table below:

Summary of computational transaction
Raw Inputview raw input (R code)
Raw Outputview raw output of R engine
Computing time2 seconds
R Server'Gwilym Jenkins' @ 72.249.127.135


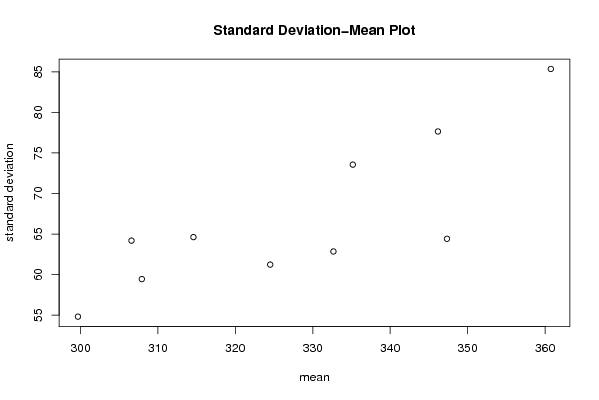
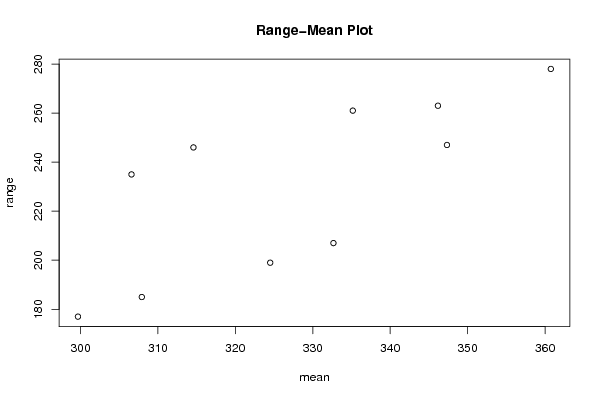
Standard Deviation-Mean Plot
SectionMeanStandard DeviationRange
1314.58333333333364.6212156737361246
2306.58333333333364.1850426265317235
3299.66666666666754.8142870117459177
4307.91666666666759.443568859784185
5335.16666666666773.5562040314422261
6347.33333333333364.4096736570374247
7360.7585.3539422320109278
8346.16666666666777.645854930439263
9324.561.2290780593665199
10332.66666666666762.8509540440113207

\begin{tabular}{lllllllll}
\hline
Standard Deviation-Mean Plot \tabularnewline
Section & Mean & Standard Deviation & Range \tabularnewline
1 & 314.583333333333 & 64.6212156737361 & 246 \tabularnewline
2 & 306.583333333333 & 64.1850426265317 & 235 \tabularnewline
3 & 299.666666666667 & 54.8142870117459 & 177 \tabularnewline
4 & 307.916666666667 & 59.443568859784 & 185 \tabularnewline
5 & 335.166666666667 & 73.5562040314422 & 261 \tabularnewline
6 & 347.333333333333 & 64.4096736570374 & 247 \tabularnewline
7 & 360.75 & 85.3539422320109 & 278 \tabularnewline
8 & 346.166666666667 & 77.645854930439 & 263 \tabularnewline
9 & 324.5 & 61.2290780593665 & 199 \tabularnewline
10 & 332.666666666667 & 62.8509540440113 & 207 \tabularnewline
\hline
\end{tabular}
%Source: https://freestatistics.org/blog/index.php?pk=29420&T=1

[TABLE]
[ROW][C]Standard Deviation-Mean Plot[/C][/ROW]
[ROW][C]Section[/C][C]Mean[/C][C]Standard Deviation[/C][C]Range[/C][/ROW]
[ROW][C]1[/C][C]314.583333333333[/C][C]64.6212156737361[/C][C]246[/C][/ROW]
[ROW][C]2[/C][C]306.583333333333[/C][C]64.1850426265317[/C][C]235[/C][/ROW]
[ROW][C]3[/C][C]299.666666666667[/C][C]54.8142870117459[/C][C]177[/C][/ROW]
[ROW][C]4[/C][C]307.916666666667[/C][C]59.443568859784[/C][C]185[/C][/ROW]
[ROW][C]5[/C][C]335.166666666667[/C][C]73.5562040314422[/C][C]261[/C][/ROW]
[ROW][C]6[/C][C]347.333333333333[/C][C]64.4096736570374[/C][C]247[/C][/ROW]
[ROW][C]7[/C][C]360.75[/C][C]85.3539422320109[/C][C]278[/C][/ROW]
[ROW][C]8[/C][C]346.166666666667[/C][C]77.645854930439[/C][C]263[/C][/ROW]
[ROW][C]9[/C][C]324.5[/C][C]61.2290780593665[/C][C]199[/C][/ROW]
[ROW][C]10[/C][C]332.666666666667[/C][C]62.8509540440113[/C][C]207[/C][/ROW]
[/TABLE]
Source: https://freestatistics.org/blog/index.php?pk=29420&T=1

Globally Unique Identifier (entire table): ba.freestatistics.org/blog/index.php?pk=29420&T=1

As an alternative you can also use a QR Code:  

The GUIDs for individual cells are displayed in the table below:

Standard Deviation-Mean Plot
SectionMeanStandard DeviationRange
1314.58333333333364.6212156737361246
2306.58333333333364.1850426265317235
3299.66666666666754.8142870117459177
4307.91666666666759.443568859784185
5335.16666666666773.5562040314422261
6347.33333333333364.4096736570374247
7360.7585.3539422320109278
8346.16666666666777.645854930439263
9324.561.2290780593665199
10332.66666666666762.8509540440113207


Regression: S.E.(k) = alpha + beta * Mean(k)
alpha-55.2565070083138
beta0.37268722507915
S.D.0.0927081873914138
T-STAT4.02000336287091
p-value0.00384113904299498

\begin{tabular}{lllllllll}
\hline
Regression: S.E.(k) = alpha + beta * Mean(k) \tabularnewline
alpha & -55.2565070083138 \tabularnewline
beta & 0.37268722507915 \tabularnewline
S.D. & 0.0927081873914138 \tabularnewline
T-STAT & 4.02000336287091 \tabularnewline
p-value & 0.00384113904299498 \tabularnewline
\hline
\end{tabular}
%Source: https://freestatistics.org/blog/index.php?pk=29420&T=2

[TABLE]
[ROW][C]Regression: S.E.(k) = alpha + beta * Mean(k)[/C][/ROW]
[ROW][C]alpha[/C][C]-55.2565070083138[/C][/ROW]
[ROW][C]beta[/C][C]0.37268722507915[/C][/ROW]
[ROW][C]S.D.[/C][C]0.0927081873914138[/C][/ROW]
[ROW][C]T-STAT[/C][C]4.02000336287091[/C][/ROW]
[ROW][C]p-value[/C][C]0.00384113904299498[/C][/ROW]
[/TABLE]
Source: https://freestatistics.org/blog/index.php?pk=29420&T=2

Globally Unique Identifier (entire table): ba.freestatistics.org/blog/index.php?pk=29420&T=2

As an alternative you can also use a QR Code:  

The GUIDs for individual cells are displayed in the table below:

Regression: S.E.(k) = alpha + beta * Mean(k)
alpha-55.2565070083138
beta0.37268722507915
S.D.0.0927081873914138
T-STAT4.02000336287091
p-value0.00384113904299498


Regression: ln S.E.(k) = alpha + beta * ln Mean(k)
alpha-6.00605362009176
beta1.76165481007016
S.D.0.437629200143368
T-STAT4.02545079143037
p-value0.00381211493205236
Lambda-0.76165481007016

\begin{tabular}{lllllllll}
\hline
Regression: ln S.E.(k) = alpha + beta * ln Mean(k) \tabularnewline
alpha & -6.00605362009176 \tabularnewline
beta & 1.76165481007016 \tabularnewline
S.D. & 0.437629200143368 \tabularnewline
T-STAT & 4.02545079143037 \tabularnewline
p-value & 0.00381211493205236 \tabularnewline
Lambda & -0.76165481007016 \tabularnewline
\hline
\end{tabular}
%Source: https://freestatistics.org/blog/index.php?pk=29420&T=3

[TABLE]
[ROW][C]Regression: ln S.E.(k) = alpha + beta * ln Mean(k)[/C][/ROW]
[ROW][C]alpha[/C][C]-6.00605362009176[/C][/ROW]
[ROW][C]beta[/C][C]1.76165481007016[/C][/ROW]
[ROW][C]S.D.[/C][C]0.437629200143368[/C][/ROW]
[ROW][C]T-STAT[/C][C]4.02545079143037[/C][/ROW]
[ROW][C]p-value[/C][C]0.00381211493205236[/C][/ROW]
[ROW][C]Lambda[/C][C]-0.76165481007016[/C][/ROW]
[/TABLE]
Source: https://freestatistics.org/blog/index.php?pk=29420&T=3

Globally Unique Identifier (entire table): ba.freestatistics.org/blog/index.php?pk=29420&T=3

As an alternative you can also use a QR Code:  

The GUIDs for individual cells are displayed in the table below:

Regression: ln S.E.(k) = alpha + beta * ln Mean(k)
alpha-6.00605362009176
beta1.76165481007016
S.D.0.437629200143368
T-STAT4.02545079143037
p-value0.00381211493205236
Lambda-0.76165481007016


Parameters (Session):
par1 = 12 ;
Parameters (R input):
par1 = 12 ;
R code (references can be found in the software module):
par1 <- as.numeric(par1)
(n <- length(x))
(np <- floor(n / par1))
arr <- array(NA,dim=c(par1,np))
j <- 0
k <- 1
for (i in 1:(np*par1))
{
j = j + 1
arr[j,k] <- x[i]
if (j == par1) {
j = 0
k=k+1
}
}
arr
arr.mean <- array(NA,dim=np)
arr.sd <- array(NA,dim=np)
arr.range <- array(NA,dim=np)
for (j in 1:np)
{
arr.mean[j] <- mean(arr[,j],na.rm=TRUE)
arr.sd[j] <- sd(arr[,j],na.rm=TRUE)
arr.range[j] <- max(arr[,j],na.rm=TRUE) - min(arr[,j],na.rm=TRUE)
}
arr.mean
arr.sd
arr.range
(lm1 <- lm(arr.sd~arr.mean))
(lnlm1 <- lm(log(arr.sd)~log(arr.mean)))
(lm2 <- lm(arr.range~arr.mean))
bitmap(file='test1.png')
plot(arr.mean,arr.sd,main='Standard Deviation-Mean Plot',xlab='mean',ylab='standard deviation')
dev.off()
bitmap(file='test2.png')
plot(arr.mean,arr.range,main='Range-Mean Plot',xlab='mean',ylab='range')
dev.off()
load(file='createtable')
a<-table.start()
a<-table.row.start(a)
a<-table.element(a,'Standard Deviation-Mean Plot',4,TRUE)
a<-table.row.end(a)
a<-table.row.start(a)
a<-table.element(a,'Section',header=TRUE)
a<-table.element(a,'Mean',header=TRUE)
a<-table.element(a,'Standard Deviation',header=TRUE)
a<-table.element(a,'Range',header=TRUE)
a<-table.row.end(a)
for (j in 1:np) {
a<-table.row.start(a)
a<-table.element(a,j,header=TRUE)
a<-table.element(a,arr.mean[j])
a<-table.element(a,arr.sd[j] )
a<-table.element(a,arr.range[j] )
a<-table.row.end(a)
}
a<-table.end(a)
table.save(a,file='mytable.tab')
a<-table.start()
a<-table.row.start(a)
a<-table.element(a,'Regression: S.E.(k) = alpha + beta * Mean(k)',2,TRUE)
a<-table.row.end(a)
a<-table.row.start(a)
a<-table.element(a,'alpha',header=TRUE)
a<-table.element(a,lm1$coefficients[[1]])
a<-table.row.end(a)
a<-table.row.start(a)
a<-table.element(a,'beta',header=TRUE)
a<-table.element(a,lm1$coefficients[[2]])
a<-table.row.end(a)
a<-table.row.start(a)
a<-table.element(a,'S.D.',header=TRUE)
a<-table.element(a,summary(lm1)$coefficients[2,2])
a<-table.row.end(a)
a<-table.row.start(a)
a<-table.element(a,'T-STAT',header=TRUE)
a<-table.element(a,summary(lm1)$coefficients[2,3])
a<-table.row.end(a)
a<-table.row.start(a)
a<-table.element(a,'p-value',header=TRUE)
a<-table.element(a,summary(lm1)$coefficients[2,4])
a<-table.row.end(a)
a<-table.end(a)
table.save(a,file='mytable1.tab')
a<-table.start()
a<-table.row.start(a)
a<-table.element(a,'Regression: ln S.E.(k) = alpha + beta * ln Mean(k)',2,TRUE)
a<-table.row.end(a)
a<-table.row.start(a)
a<-table.element(a,'alpha',header=TRUE)
a<-table.element(a,lnlm1$coefficients[[1]])
a<-table.row.end(a)
a<-table.row.start(a)
a<-table.element(a,'beta',header=TRUE)
a<-table.element(a,lnlm1$coefficients[[2]])
a<-table.row.end(a)
a<-table.row.start(a)
a<-table.element(a,'S.D.',header=TRUE)
a<-table.element(a,summary(lnlm1)$coefficients[2,2])
a<-table.row.end(a)
a<-table.row.start(a)
a<-table.element(a,'T-STAT',header=TRUE)
a<-table.element(a,summary(lnlm1)$coefficients[2,3])
a<-table.row.end(a)
a<-table.row.start(a)
a<-table.element(a,'p-value',header=TRUE)
a<-table.element(a,summary(lnlm1)$coefficients[2,4])
a<-table.row.end(a)
a<-table.row.start(a)
a<-table.element(a,'Lambda',header=TRUE)
a<-table.element(a,1-lnlm1$coefficients[[2]])
a<-table.row.end(a)
a<-table.end(a)
table.save(a,file='mytable2.tab')