Free Statistics

of Irreproducible Research!

Author's title

Author*The author of this computation has been verified*
R Software Modulerwasp_autocorrelation.wasp
Title produced by software(Partial) Autocorrelation Function
Date of computationThu, 04 Dec 2008 11:20:00 -0700
Cite this page as followsStatistical Computations at FreeStatistics.org, Office for Research Development and Education, URL https://freestatistics.org/blog/index.php?v=date/2008/Dec/04/t12284148586uodbdqrr36bugq.htm/, Retrieved Sun, 19 May 2024 04:40:19 +0000
Statistical Computations at FreeStatistics.org, Office for Research Development and Education, URL https://freestatistics.org/blog/index.php?pk=28995, Retrieved Sun, 19 May 2024 04:40:19 +0000
QR Codes:

Original text written by user:
IsPrivate?No (this computation is public)
User-defined keywords
Estimated Impact190
Family? (F = Feedback message, R = changed R code, M = changed R Module, P = changed Parameters, D = changed Data)
-     [(Partial) Autocorrelation Function] [Uitvoer Amerika -...] [2008-12-04 17:15:44] [9e54d1454d464f1bf9ee4a54d5d56945]
-   PD  [(Partial) Autocorrelation Function] [Uitvoer Amerika (...] [2008-12-04 18:04:26] [9e54d1454d464f1bf9ee4a54d5d56945]
-   P       [(Partial) Autocorrelation Function] [Uitvoer Amerika (...] [2008-12-04 18:20:00] [8da7502cfecb272886bc60b3f290b8b8] [Current]
Feedback Forum

Post a new message
Dataseries X:
1190.8
728.8
995.6
1260.3
994
957.3
975.6
884.9
908.4
1022.8
958.6
825.1
1116.6
724.2
1004.5
1058.9
854.7
943.4
792.4
873.2
1101.4
987.1
1038.8
1060.7
1047.7
840
1044
1097.4
987.5
934
977
881.1
1083.3
1074.7
1182.2
1117.5
1117.4
936.2
1246.3
1175.1
1177.7
1035.8
1091.6
998.7
1247.9
1034.7
1287.7
994.0
1122.8
1017.3
1106.0
1191.8
1030.1
989.4
979.6
1088.0
1389.2
1043.9
1182.1
1109.6
1463.3
1276.2
1082.4
1360.4
1130.2
1019.6
1077.0
958.8
959.6
907.2
880.8
759.6
1137.2


Summary of computational transaction
Raw Inputview raw input (R code)
Raw Outputview raw output of R engine
Computing time1 seconds
R Server'George Udny Yule' @ 72.249.76.132

\begin{tabular}{lllllllll}
\hline
Summary of computational transaction \tabularnewline
Raw Input & view raw input (R code)  \tabularnewline
Raw Output & view raw output of R engine  \tabularnewline
Computing time & 1 seconds \tabularnewline
R Server & 'George Udny Yule' @ 72.249.76.132 \tabularnewline
\hline
\end{tabular}
%Source: https://freestatistics.org/blog/index.php?pk=28995&T=0

[TABLE]
[ROW][C]Summary of computational transaction[/C][/ROW]
[ROW][C]Raw Input[/C][C]view raw input (R code) [/C][/ROW]
[ROW][C]Raw Output[/C][C]view raw output of R engine [/C][/ROW]
[ROW][C]Computing time[/C][C]1 seconds[/C][/ROW]
[ROW][C]R Server[/C][C]'George Udny Yule' @ 72.249.76.132[/C][/ROW]
[/TABLE]
Source: https://freestatistics.org/blog/index.php?pk=28995&T=0

Globally Unique Identifier (entire table): ba.freestatistics.org/blog/index.php?pk=28995&T=0

As an alternative you can also use a QR Code:  

The GUIDs for individual cells are displayed in the table below:

Summary of computational transaction
Raw Inputview raw input (R code)
Raw Outputview raw output of R engine
Computing time1 seconds
R Server'George Udny Yule' @ 72.249.76.132


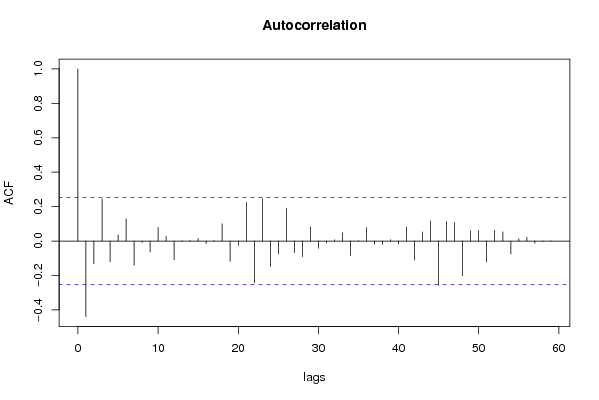
Autocorrelation Function
Time lag kACF(k)T-STATP-value
1-0.439447-3.40390.000595
2-0.131401-1.01780.156424
30.2436221.88710.031995
4-0.121025-0.93750.17614
50.0352260.27290.392949
60.1290120.99930.160826
7-0.140088-1.08510.141105
8-0.007918-0.06130.47565
9-0.063115-0.48890.313353
100.0785660.60860.272554
110.0263760.20430.419401
12-0.109145-0.84540.200614
130.0011930.00920.496328
140.0026470.02050.491854
150.0149090.11550.454224
16-0.014543-0.11260.455343
170.0028470.02210.491238
180.1000120.77470.220784
19-0.117596-0.91090.182997
20-0.025324-0.19620.422574
210.2245581.73940.043545
22-0.242824-1.88090.03242
230.2460241.90570.030742
24-0.148391-1.14940.12747
25-0.074144-0.57430.283949
260.1911181.48040.072
27-0.067237-0.52080.302206
28-0.090601-0.70180.242761
290.0829240.64230.261554
30-0.042063-0.32580.372848
31-0.011338-0.08780.465153
320.0068930.05340.478798
330.0480980.37260.355391
34-0.085384-0.66140.255451
350.0011940.00920.496326
360.0776950.60180.274779
37-0.018481-0.14310.443326
38-0.019699-0.15260.439617
390.007710.05970.476288
40-0.015447-0.11970.452579
410.0820380.63550.263771
42-0.110446-0.85550.197836
430.0526590.40790.342401
440.1167570.90440.184702
45-0.257693-1.99610.025235
460.1136610.88040.191074
470.1083270.83910.202372
48-0.201178-1.55830.062208
490.0600190.46490.321842
500.060590.46930.320267
51-0.120499-0.93340.177183
520.0619520.47990.316528
530.0532170.41220.340825
54-0.075172-0.58230.281279
550.0124040.09610.461888
560.0217870.16880.433276
57-0.013321-0.10320.459082
58-0.002016-0.01560.493797
590.00150.01160.495385
60NANANA

\begin{tabular}{lllllllll}
\hline
Autocorrelation Function \tabularnewline
Time lag k & ACF(k) & T-STAT & P-value \tabularnewline
1 & -0.439447 & -3.4039 & 0.000595 \tabularnewline
2 & -0.131401 & -1.0178 & 0.156424 \tabularnewline
3 & 0.243622 & 1.8871 & 0.031995 \tabularnewline
4 & -0.121025 & -0.9375 & 0.17614 \tabularnewline
5 & 0.035226 & 0.2729 & 0.392949 \tabularnewline
6 & 0.129012 & 0.9993 & 0.160826 \tabularnewline
7 & -0.140088 & -1.0851 & 0.141105 \tabularnewline
8 & -0.007918 & -0.0613 & 0.47565 \tabularnewline
9 & -0.063115 & -0.4889 & 0.313353 \tabularnewline
10 & 0.078566 & 0.6086 & 0.272554 \tabularnewline
11 & 0.026376 & 0.2043 & 0.419401 \tabularnewline
12 & -0.109145 & -0.8454 & 0.200614 \tabularnewline
13 & 0.001193 & 0.0092 & 0.496328 \tabularnewline
14 & 0.002647 & 0.0205 & 0.491854 \tabularnewline
15 & 0.014909 & 0.1155 & 0.454224 \tabularnewline
16 & -0.014543 & -0.1126 & 0.455343 \tabularnewline
17 & 0.002847 & 0.0221 & 0.491238 \tabularnewline
18 & 0.100012 & 0.7747 & 0.220784 \tabularnewline
19 & -0.117596 & -0.9109 & 0.182997 \tabularnewline
20 & -0.025324 & -0.1962 & 0.422574 \tabularnewline
21 & 0.224558 & 1.7394 & 0.043545 \tabularnewline
22 & -0.242824 & -1.8809 & 0.03242 \tabularnewline
23 & 0.246024 & 1.9057 & 0.030742 \tabularnewline
24 & -0.148391 & -1.1494 & 0.12747 \tabularnewline
25 & -0.074144 & -0.5743 & 0.283949 \tabularnewline
26 & 0.191118 & 1.4804 & 0.072 \tabularnewline
27 & -0.067237 & -0.5208 & 0.302206 \tabularnewline
28 & -0.090601 & -0.7018 & 0.242761 \tabularnewline
29 & 0.082924 & 0.6423 & 0.261554 \tabularnewline
30 & -0.042063 & -0.3258 & 0.372848 \tabularnewline
31 & -0.011338 & -0.0878 & 0.465153 \tabularnewline
32 & 0.006893 & 0.0534 & 0.478798 \tabularnewline
33 & 0.048098 & 0.3726 & 0.355391 \tabularnewline
34 & -0.085384 & -0.6614 & 0.255451 \tabularnewline
35 & 0.001194 & 0.0092 & 0.496326 \tabularnewline
36 & 0.077695 & 0.6018 & 0.274779 \tabularnewline
37 & -0.018481 & -0.1431 & 0.443326 \tabularnewline
38 & -0.019699 & -0.1526 & 0.439617 \tabularnewline
39 & 0.00771 & 0.0597 & 0.476288 \tabularnewline
40 & -0.015447 & -0.1197 & 0.452579 \tabularnewline
41 & 0.082038 & 0.6355 & 0.263771 \tabularnewline
42 & -0.110446 & -0.8555 & 0.197836 \tabularnewline
43 & 0.052659 & 0.4079 & 0.342401 \tabularnewline
44 & 0.116757 & 0.9044 & 0.184702 \tabularnewline
45 & -0.257693 & -1.9961 & 0.025235 \tabularnewline
46 & 0.113661 & 0.8804 & 0.191074 \tabularnewline
47 & 0.108327 & 0.8391 & 0.202372 \tabularnewline
48 & -0.201178 & -1.5583 & 0.062208 \tabularnewline
49 & 0.060019 & 0.4649 & 0.321842 \tabularnewline
50 & 0.06059 & 0.4693 & 0.320267 \tabularnewline
51 & -0.120499 & -0.9334 & 0.177183 \tabularnewline
52 & 0.061952 & 0.4799 & 0.316528 \tabularnewline
53 & 0.053217 & 0.4122 & 0.340825 \tabularnewline
54 & -0.075172 & -0.5823 & 0.281279 \tabularnewline
55 & 0.012404 & 0.0961 & 0.461888 \tabularnewline
56 & 0.021787 & 0.1688 & 0.433276 \tabularnewline
57 & -0.013321 & -0.1032 & 0.459082 \tabularnewline
58 & -0.002016 & -0.0156 & 0.493797 \tabularnewline
59 & 0.0015 & 0.0116 & 0.495385 \tabularnewline
60 & NA & NA & NA \tabularnewline
\hline
\end{tabular}
%Source: https://freestatistics.org/blog/index.php?pk=28995&T=1

[TABLE]
[ROW][C]Autocorrelation Function[/C][/ROW]
[ROW][C]Time lag k[/C][C]ACF(k)[/C][C]T-STAT[/C][C]P-value[/C][/ROW]
[ROW][C]1[/C][C]-0.439447[/C][C]-3.4039[/C][C]0.000595[/C][/ROW]
[ROW][C]2[/C][C]-0.131401[/C][C]-1.0178[/C][C]0.156424[/C][/ROW]
[ROW][C]3[/C][C]0.243622[/C][C]1.8871[/C][C]0.031995[/C][/ROW]
[ROW][C]4[/C][C]-0.121025[/C][C]-0.9375[/C][C]0.17614[/C][/ROW]
[ROW][C]5[/C][C]0.035226[/C][C]0.2729[/C][C]0.392949[/C][/ROW]
[ROW][C]6[/C][C]0.129012[/C][C]0.9993[/C][C]0.160826[/C][/ROW]
[ROW][C]7[/C][C]-0.140088[/C][C]-1.0851[/C][C]0.141105[/C][/ROW]
[ROW][C]8[/C][C]-0.007918[/C][C]-0.0613[/C][C]0.47565[/C][/ROW]
[ROW][C]9[/C][C]-0.063115[/C][C]-0.4889[/C][C]0.313353[/C][/ROW]
[ROW][C]10[/C][C]0.078566[/C][C]0.6086[/C][C]0.272554[/C][/ROW]
[ROW][C]11[/C][C]0.026376[/C][C]0.2043[/C][C]0.419401[/C][/ROW]
[ROW][C]12[/C][C]-0.109145[/C][C]-0.8454[/C][C]0.200614[/C][/ROW]
[ROW][C]13[/C][C]0.001193[/C][C]0.0092[/C][C]0.496328[/C][/ROW]
[ROW][C]14[/C][C]0.002647[/C][C]0.0205[/C][C]0.491854[/C][/ROW]
[ROW][C]15[/C][C]0.014909[/C][C]0.1155[/C][C]0.454224[/C][/ROW]
[ROW][C]16[/C][C]-0.014543[/C][C]-0.1126[/C][C]0.455343[/C][/ROW]
[ROW][C]17[/C][C]0.002847[/C][C]0.0221[/C][C]0.491238[/C][/ROW]
[ROW][C]18[/C][C]0.100012[/C][C]0.7747[/C][C]0.220784[/C][/ROW]
[ROW][C]19[/C][C]-0.117596[/C][C]-0.9109[/C][C]0.182997[/C][/ROW]
[ROW][C]20[/C][C]-0.025324[/C][C]-0.1962[/C][C]0.422574[/C][/ROW]
[ROW][C]21[/C][C]0.224558[/C][C]1.7394[/C][C]0.043545[/C][/ROW]
[ROW][C]22[/C][C]-0.242824[/C][C]-1.8809[/C][C]0.03242[/C][/ROW]
[ROW][C]23[/C][C]0.246024[/C][C]1.9057[/C][C]0.030742[/C][/ROW]
[ROW][C]24[/C][C]-0.148391[/C][C]-1.1494[/C][C]0.12747[/C][/ROW]
[ROW][C]25[/C][C]-0.074144[/C][C]-0.5743[/C][C]0.283949[/C][/ROW]
[ROW][C]26[/C][C]0.191118[/C][C]1.4804[/C][C]0.072[/C][/ROW]
[ROW][C]27[/C][C]-0.067237[/C][C]-0.5208[/C][C]0.302206[/C][/ROW]
[ROW][C]28[/C][C]-0.090601[/C][C]-0.7018[/C][C]0.242761[/C][/ROW]
[ROW][C]29[/C][C]0.082924[/C][C]0.6423[/C][C]0.261554[/C][/ROW]
[ROW][C]30[/C][C]-0.042063[/C][C]-0.3258[/C][C]0.372848[/C][/ROW]
[ROW][C]31[/C][C]-0.011338[/C][C]-0.0878[/C][C]0.465153[/C][/ROW]
[ROW][C]32[/C][C]0.006893[/C][C]0.0534[/C][C]0.478798[/C][/ROW]
[ROW][C]33[/C][C]0.048098[/C][C]0.3726[/C][C]0.355391[/C][/ROW]
[ROW][C]34[/C][C]-0.085384[/C][C]-0.6614[/C][C]0.255451[/C][/ROW]
[ROW][C]35[/C][C]0.001194[/C][C]0.0092[/C][C]0.496326[/C][/ROW]
[ROW][C]36[/C][C]0.077695[/C][C]0.6018[/C][C]0.274779[/C][/ROW]
[ROW][C]37[/C][C]-0.018481[/C][C]-0.1431[/C][C]0.443326[/C][/ROW]
[ROW][C]38[/C][C]-0.019699[/C][C]-0.1526[/C][C]0.439617[/C][/ROW]
[ROW][C]39[/C][C]0.00771[/C][C]0.0597[/C][C]0.476288[/C][/ROW]
[ROW][C]40[/C][C]-0.015447[/C][C]-0.1197[/C][C]0.452579[/C][/ROW]
[ROW][C]41[/C][C]0.082038[/C][C]0.6355[/C][C]0.263771[/C][/ROW]
[ROW][C]42[/C][C]-0.110446[/C][C]-0.8555[/C][C]0.197836[/C][/ROW]
[ROW][C]43[/C][C]0.052659[/C][C]0.4079[/C][C]0.342401[/C][/ROW]
[ROW][C]44[/C][C]0.116757[/C][C]0.9044[/C][C]0.184702[/C][/ROW]
[ROW][C]45[/C][C]-0.257693[/C][C]-1.9961[/C][C]0.025235[/C][/ROW]
[ROW][C]46[/C][C]0.113661[/C][C]0.8804[/C][C]0.191074[/C][/ROW]
[ROW][C]47[/C][C]0.108327[/C][C]0.8391[/C][C]0.202372[/C][/ROW]
[ROW][C]48[/C][C]-0.201178[/C][C]-1.5583[/C][C]0.062208[/C][/ROW]
[ROW][C]49[/C][C]0.060019[/C][C]0.4649[/C][C]0.321842[/C][/ROW]
[ROW][C]50[/C][C]0.06059[/C][C]0.4693[/C][C]0.320267[/C][/ROW]
[ROW][C]51[/C][C]-0.120499[/C][C]-0.9334[/C][C]0.177183[/C][/ROW]
[ROW][C]52[/C][C]0.061952[/C][C]0.4799[/C][C]0.316528[/C][/ROW]
[ROW][C]53[/C][C]0.053217[/C][C]0.4122[/C][C]0.340825[/C][/ROW]
[ROW][C]54[/C][C]-0.075172[/C][C]-0.5823[/C][C]0.281279[/C][/ROW]
[ROW][C]55[/C][C]0.012404[/C][C]0.0961[/C][C]0.461888[/C][/ROW]
[ROW][C]56[/C][C]0.021787[/C][C]0.1688[/C][C]0.433276[/C][/ROW]
[ROW][C]57[/C][C]-0.013321[/C][C]-0.1032[/C][C]0.459082[/C][/ROW]
[ROW][C]58[/C][C]-0.002016[/C][C]-0.0156[/C][C]0.493797[/C][/ROW]
[ROW][C]59[/C][C]0.0015[/C][C]0.0116[/C][C]0.495385[/C][/ROW]
[ROW][C]60[/C][C]NA[/C][C]NA[/C][C]NA[/C][/ROW]
[/TABLE]
Source: https://freestatistics.org/blog/index.php?pk=28995&T=1

Globally Unique Identifier (entire table): ba.freestatistics.org/blog/index.php?pk=28995&T=1

As an alternative you can also use a QR Code:  

The GUIDs for individual cells are displayed in the table below:

Autocorrelation Function
Time lag kACF(k)T-STATP-value
1-0.439447-3.40390.000595
2-0.131401-1.01780.156424
30.2436221.88710.031995
4-0.121025-0.93750.17614
50.0352260.27290.392949
60.1290120.99930.160826
7-0.140088-1.08510.141105
8-0.007918-0.06130.47565
9-0.063115-0.48890.313353
100.0785660.60860.272554
110.0263760.20430.419401
12-0.109145-0.84540.200614
130.0011930.00920.496328
140.0026470.02050.491854
150.0149090.11550.454224
16-0.014543-0.11260.455343
170.0028470.02210.491238
180.1000120.77470.220784
19-0.117596-0.91090.182997
20-0.025324-0.19620.422574
210.2245581.73940.043545
22-0.242824-1.88090.03242
230.2460241.90570.030742
24-0.148391-1.14940.12747
25-0.074144-0.57430.283949
260.1911181.48040.072
27-0.067237-0.52080.302206
28-0.090601-0.70180.242761
290.0829240.64230.261554
30-0.042063-0.32580.372848
31-0.011338-0.08780.465153
320.0068930.05340.478798
330.0480980.37260.355391
34-0.085384-0.66140.255451
350.0011940.00920.496326
360.0776950.60180.274779
37-0.018481-0.14310.443326
38-0.019699-0.15260.439617
390.007710.05970.476288
40-0.015447-0.11970.452579
410.0820380.63550.263771
42-0.110446-0.85550.197836
430.0526590.40790.342401
440.1167570.90440.184702
45-0.257693-1.99610.025235
460.1136610.88040.191074
470.1083270.83910.202372
48-0.201178-1.55830.062208
490.0600190.46490.321842
500.060590.46930.320267
51-0.120499-0.93340.177183
520.0619520.47990.316528
530.0532170.41220.340825
54-0.075172-0.58230.281279
550.0124040.09610.461888
560.0217870.16880.433276
57-0.013321-0.10320.459082
58-0.002016-0.01560.493797
590.00150.01160.495385
60NANANA


Partial Autocorrelation Function
Time lag kPACF(k)T-STATP-value
1-0.439447-3.40390.000595
2-0.40218-3.11530.001409
3-0.02082-0.16130.436212
4-0.048147-0.37290.355251
50.0558110.43230.333533
60.1902441.47360.072905
70.0676880.52430.300998
8-0.032925-0.2550.399784
9-0.257813-1.9970.025183
10-0.136942-1.06070.146528
11-0.029191-0.22610.410942
12-0.036516-0.28280.389133
13-0.045318-0.3510.363396
14-0.056516-0.43780.331562
150.0107650.08340.466912
16-0.060762-0.47070.319796
17-0.04699-0.3640.358574
180.1593491.23430.11095
190.0779980.60420.274004
20-0.073266-0.56750.286241
210.091630.70980.240299
22-0.145731-1.12880.131732
230.2180541.6890.048202
24-0.083433-0.64630.260284
25-0.057782-0.44760.328036
260.0284330.22020.413217
270.0499050.38660.350222
28-0.05068-0.39260.348017
29-0.09903-0.76710.223021
300.0858250.66480.254364
310.0208140.16120.43623
32-0.042191-0.32680.372475
330.0377170.29220.385587
34-0.01796-0.13910.444913
350.0137120.10620.457884
36-0.018396-0.14250.443582
370.0389420.30160.381982
380.0822680.63720.263194
39-0.02891-0.22390.411783
40-0.049273-0.38170.352028
410.0335960.26020.397788
42-0.086444-0.66960.252844
430.0492860.38180.351991
440.0214610.16620.434266
45-0.04163-0.32250.37411
46-0.109856-0.85090.199093
470.0101160.07840.468903
48-0.089051-0.68980.246494
49-0.107713-0.83430.203699
500.0299450.2320.408681
51-0.020838-0.16140.436157
520.0043580.03380.486593
530.0485180.37580.354188
54-0.033649-0.26060.397629
550.0237410.18390.427356
56-0.057922-0.44870.327645
57-0.042491-0.32910.3716
58-0.103729-0.80350.212434
59-0.109644-0.84930.199545
60NANANA

\begin{tabular}{lllllllll}
\hline
Partial Autocorrelation Function \tabularnewline
Time lag k & PACF(k) & T-STAT & P-value \tabularnewline
1 & -0.439447 & -3.4039 & 0.000595 \tabularnewline
2 & -0.40218 & -3.1153 & 0.001409 \tabularnewline
3 & -0.02082 & -0.1613 & 0.436212 \tabularnewline
4 & -0.048147 & -0.3729 & 0.355251 \tabularnewline
5 & 0.055811 & 0.4323 & 0.333533 \tabularnewline
6 & 0.190244 & 1.4736 & 0.072905 \tabularnewline
7 & 0.067688 & 0.5243 & 0.300998 \tabularnewline
8 & -0.032925 & -0.255 & 0.399784 \tabularnewline
9 & -0.257813 & -1.997 & 0.025183 \tabularnewline
10 & -0.136942 & -1.0607 & 0.146528 \tabularnewline
11 & -0.029191 & -0.2261 & 0.410942 \tabularnewline
12 & -0.036516 & -0.2828 & 0.389133 \tabularnewline
13 & -0.045318 & -0.351 & 0.363396 \tabularnewline
14 & -0.056516 & -0.4378 & 0.331562 \tabularnewline
15 & 0.010765 & 0.0834 & 0.466912 \tabularnewline
16 & -0.060762 & -0.4707 & 0.319796 \tabularnewline
17 & -0.04699 & -0.364 & 0.358574 \tabularnewline
18 & 0.159349 & 1.2343 & 0.11095 \tabularnewline
19 & 0.077998 & 0.6042 & 0.274004 \tabularnewline
20 & -0.073266 & -0.5675 & 0.286241 \tabularnewline
21 & 0.09163 & 0.7098 & 0.240299 \tabularnewline
22 & -0.145731 & -1.1288 & 0.131732 \tabularnewline
23 & 0.218054 & 1.689 & 0.048202 \tabularnewline
24 & -0.083433 & -0.6463 & 0.260284 \tabularnewline
25 & -0.057782 & -0.4476 & 0.328036 \tabularnewline
26 & 0.028433 & 0.2202 & 0.413217 \tabularnewline
27 & 0.049905 & 0.3866 & 0.350222 \tabularnewline
28 & -0.05068 & -0.3926 & 0.348017 \tabularnewline
29 & -0.09903 & -0.7671 & 0.223021 \tabularnewline
30 & 0.085825 & 0.6648 & 0.254364 \tabularnewline
31 & 0.020814 & 0.1612 & 0.43623 \tabularnewline
32 & -0.042191 & -0.3268 & 0.372475 \tabularnewline
33 & 0.037717 & 0.2922 & 0.385587 \tabularnewline
34 & -0.01796 & -0.1391 & 0.444913 \tabularnewline
35 & 0.013712 & 0.1062 & 0.457884 \tabularnewline
36 & -0.018396 & -0.1425 & 0.443582 \tabularnewline
37 & 0.038942 & 0.3016 & 0.381982 \tabularnewline
38 & 0.082268 & 0.6372 & 0.263194 \tabularnewline
39 & -0.02891 & -0.2239 & 0.411783 \tabularnewline
40 & -0.049273 & -0.3817 & 0.352028 \tabularnewline
41 & 0.033596 & 0.2602 & 0.397788 \tabularnewline
42 & -0.086444 & -0.6696 & 0.252844 \tabularnewline
43 & 0.049286 & 0.3818 & 0.351991 \tabularnewline
44 & 0.021461 & 0.1662 & 0.434266 \tabularnewline
45 & -0.04163 & -0.3225 & 0.37411 \tabularnewline
46 & -0.109856 & -0.8509 & 0.199093 \tabularnewline
47 & 0.010116 & 0.0784 & 0.468903 \tabularnewline
48 & -0.089051 & -0.6898 & 0.246494 \tabularnewline
49 & -0.107713 & -0.8343 & 0.203699 \tabularnewline
50 & 0.029945 & 0.232 & 0.408681 \tabularnewline
51 & -0.020838 & -0.1614 & 0.436157 \tabularnewline
52 & 0.004358 & 0.0338 & 0.486593 \tabularnewline
53 & 0.048518 & 0.3758 & 0.354188 \tabularnewline
54 & -0.033649 & -0.2606 & 0.397629 \tabularnewline
55 & 0.023741 & 0.1839 & 0.427356 \tabularnewline
56 & -0.057922 & -0.4487 & 0.327645 \tabularnewline
57 & -0.042491 & -0.3291 & 0.3716 \tabularnewline
58 & -0.103729 & -0.8035 & 0.212434 \tabularnewline
59 & -0.109644 & -0.8493 & 0.199545 \tabularnewline
60 & NA & NA & NA \tabularnewline
\hline
\end{tabular}
%Source: https://freestatistics.org/blog/index.php?pk=28995&T=2

[TABLE]
[ROW][C]Partial Autocorrelation Function[/C][/ROW]
[ROW][C]Time lag k[/C][C]PACF(k)[/C][C]T-STAT[/C][C]P-value[/C][/ROW]
[ROW][C]1[/C][C]-0.439447[/C][C]-3.4039[/C][C]0.000595[/C][/ROW]
[ROW][C]2[/C][C]-0.40218[/C][C]-3.1153[/C][C]0.001409[/C][/ROW]
[ROW][C]3[/C][C]-0.02082[/C][C]-0.1613[/C][C]0.436212[/C][/ROW]
[ROW][C]4[/C][C]-0.048147[/C][C]-0.3729[/C][C]0.355251[/C][/ROW]
[ROW][C]5[/C][C]0.055811[/C][C]0.4323[/C][C]0.333533[/C][/ROW]
[ROW][C]6[/C][C]0.190244[/C][C]1.4736[/C][C]0.072905[/C][/ROW]
[ROW][C]7[/C][C]0.067688[/C][C]0.5243[/C][C]0.300998[/C][/ROW]
[ROW][C]8[/C][C]-0.032925[/C][C]-0.255[/C][C]0.399784[/C][/ROW]
[ROW][C]9[/C][C]-0.257813[/C][C]-1.997[/C][C]0.025183[/C][/ROW]
[ROW][C]10[/C][C]-0.136942[/C][C]-1.0607[/C][C]0.146528[/C][/ROW]
[ROW][C]11[/C][C]-0.029191[/C][C]-0.2261[/C][C]0.410942[/C][/ROW]
[ROW][C]12[/C][C]-0.036516[/C][C]-0.2828[/C][C]0.389133[/C][/ROW]
[ROW][C]13[/C][C]-0.045318[/C][C]-0.351[/C][C]0.363396[/C][/ROW]
[ROW][C]14[/C][C]-0.056516[/C][C]-0.4378[/C][C]0.331562[/C][/ROW]
[ROW][C]15[/C][C]0.010765[/C][C]0.0834[/C][C]0.466912[/C][/ROW]
[ROW][C]16[/C][C]-0.060762[/C][C]-0.4707[/C][C]0.319796[/C][/ROW]
[ROW][C]17[/C][C]-0.04699[/C][C]-0.364[/C][C]0.358574[/C][/ROW]
[ROW][C]18[/C][C]0.159349[/C][C]1.2343[/C][C]0.11095[/C][/ROW]
[ROW][C]19[/C][C]0.077998[/C][C]0.6042[/C][C]0.274004[/C][/ROW]
[ROW][C]20[/C][C]-0.073266[/C][C]-0.5675[/C][C]0.286241[/C][/ROW]
[ROW][C]21[/C][C]0.09163[/C][C]0.7098[/C][C]0.240299[/C][/ROW]
[ROW][C]22[/C][C]-0.145731[/C][C]-1.1288[/C][C]0.131732[/C][/ROW]
[ROW][C]23[/C][C]0.218054[/C][C]1.689[/C][C]0.048202[/C][/ROW]
[ROW][C]24[/C][C]-0.083433[/C][C]-0.6463[/C][C]0.260284[/C][/ROW]
[ROW][C]25[/C][C]-0.057782[/C][C]-0.4476[/C][C]0.328036[/C][/ROW]
[ROW][C]26[/C][C]0.028433[/C][C]0.2202[/C][C]0.413217[/C][/ROW]
[ROW][C]27[/C][C]0.049905[/C][C]0.3866[/C][C]0.350222[/C][/ROW]
[ROW][C]28[/C][C]-0.05068[/C][C]-0.3926[/C][C]0.348017[/C][/ROW]
[ROW][C]29[/C][C]-0.09903[/C][C]-0.7671[/C][C]0.223021[/C][/ROW]
[ROW][C]30[/C][C]0.085825[/C][C]0.6648[/C][C]0.254364[/C][/ROW]
[ROW][C]31[/C][C]0.020814[/C][C]0.1612[/C][C]0.43623[/C][/ROW]
[ROW][C]32[/C][C]-0.042191[/C][C]-0.3268[/C][C]0.372475[/C][/ROW]
[ROW][C]33[/C][C]0.037717[/C][C]0.2922[/C][C]0.385587[/C][/ROW]
[ROW][C]34[/C][C]-0.01796[/C][C]-0.1391[/C][C]0.444913[/C][/ROW]
[ROW][C]35[/C][C]0.013712[/C][C]0.1062[/C][C]0.457884[/C][/ROW]
[ROW][C]36[/C][C]-0.018396[/C][C]-0.1425[/C][C]0.443582[/C][/ROW]
[ROW][C]37[/C][C]0.038942[/C][C]0.3016[/C][C]0.381982[/C][/ROW]
[ROW][C]38[/C][C]0.082268[/C][C]0.6372[/C][C]0.263194[/C][/ROW]
[ROW][C]39[/C][C]-0.02891[/C][C]-0.2239[/C][C]0.411783[/C][/ROW]
[ROW][C]40[/C][C]-0.049273[/C][C]-0.3817[/C][C]0.352028[/C][/ROW]
[ROW][C]41[/C][C]0.033596[/C][C]0.2602[/C][C]0.397788[/C][/ROW]
[ROW][C]42[/C][C]-0.086444[/C][C]-0.6696[/C][C]0.252844[/C][/ROW]
[ROW][C]43[/C][C]0.049286[/C][C]0.3818[/C][C]0.351991[/C][/ROW]
[ROW][C]44[/C][C]0.021461[/C][C]0.1662[/C][C]0.434266[/C][/ROW]
[ROW][C]45[/C][C]-0.04163[/C][C]-0.3225[/C][C]0.37411[/C][/ROW]
[ROW][C]46[/C][C]-0.109856[/C][C]-0.8509[/C][C]0.199093[/C][/ROW]
[ROW][C]47[/C][C]0.010116[/C][C]0.0784[/C][C]0.468903[/C][/ROW]
[ROW][C]48[/C][C]-0.089051[/C][C]-0.6898[/C][C]0.246494[/C][/ROW]
[ROW][C]49[/C][C]-0.107713[/C][C]-0.8343[/C][C]0.203699[/C][/ROW]
[ROW][C]50[/C][C]0.029945[/C][C]0.232[/C][C]0.408681[/C][/ROW]
[ROW][C]51[/C][C]-0.020838[/C][C]-0.1614[/C][C]0.436157[/C][/ROW]
[ROW][C]52[/C][C]0.004358[/C][C]0.0338[/C][C]0.486593[/C][/ROW]
[ROW][C]53[/C][C]0.048518[/C][C]0.3758[/C][C]0.354188[/C][/ROW]
[ROW][C]54[/C][C]-0.033649[/C][C]-0.2606[/C][C]0.397629[/C][/ROW]
[ROW][C]55[/C][C]0.023741[/C][C]0.1839[/C][C]0.427356[/C][/ROW]
[ROW][C]56[/C][C]-0.057922[/C][C]-0.4487[/C][C]0.327645[/C][/ROW]
[ROW][C]57[/C][C]-0.042491[/C][C]-0.3291[/C][C]0.3716[/C][/ROW]
[ROW][C]58[/C][C]-0.103729[/C][C]-0.8035[/C][C]0.212434[/C][/ROW]
[ROW][C]59[/C][C]-0.109644[/C][C]-0.8493[/C][C]0.199545[/C][/ROW]
[ROW][C]60[/C][C]NA[/C][C]NA[/C][C]NA[/C][/ROW]
[/TABLE]
Source: https://freestatistics.org/blog/index.php?pk=28995&T=2

Globally Unique Identifier (entire table): ba.freestatistics.org/blog/index.php?pk=28995&T=2

As an alternative you can also use a QR Code:  

The GUIDs for individual cells are displayed in the table below:

Partial Autocorrelation Function
Time lag kPACF(k)T-STATP-value
1-0.439447-3.40390.000595
2-0.40218-3.11530.001409
3-0.02082-0.16130.436212
4-0.048147-0.37290.355251
50.0558110.43230.333533
60.1902441.47360.072905
70.0676880.52430.300998
8-0.032925-0.2550.399784
9-0.257813-1.9970.025183
10-0.136942-1.06070.146528
11-0.029191-0.22610.410942
12-0.036516-0.28280.389133
13-0.045318-0.3510.363396
14-0.056516-0.43780.331562
150.0107650.08340.466912
16-0.060762-0.47070.319796
17-0.04699-0.3640.358574
180.1593491.23430.11095
190.0779980.60420.274004
20-0.073266-0.56750.286241
210.091630.70980.240299
22-0.145731-1.12880.131732
230.2180541.6890.048202
24-0.083433-0.64630.260284
25-0.057782-0.44760.328036
260.0284330.22020.413217
270.0499050.38660.350222
28-0.05068-0.39260.348017
29-0.09903-0.76710.223021
300.0858250.66480.254364
310.0208140.16120.43623
32-0.042191-0.32680.372475
330.0377170.29220.385587
34-0.01796-0.13910.444913
350.0137120.10620.457884
36-0.018396-0.14250.443582
370.0389420.30160.381982
380.0822680.63720.263194
39-0.02891-0.22390.411783
40-0.049273-0.38170.352028
410.0335960.26020.397788
42-0.086444-0.66960.252844
430.0492860.38180.351991
440.0214610.16620.434266
45-0.04163-0.32250.37411
46-0.109856-0.85090.199093
470.0101160.07840.468903
48-0.089051-0.68980.246494
49-0.107713-0.83430.203699
500.0299450.2320.408681
51-0.020838-0.16140.436157
520.0043580.03380.486593
530.0485180.37580.354188
54-0.033649-0.26060.397629
550.0237410.18390.427356
56-0.057922-0.44870.327645
57-0.042491-0.32910.3716
58-0.103729-0.80350.212434
59-0.109644-0.84930.199545
60NANANA


Parameters (Session):
par1 = 60 ; par2 = 1 ; par3 = 1 ; par4 = 1 ; par5 = 12 ;
Parameters (R input):
par1 = 60 ; par2 = 1 ; par3 = 1 ; par4 = 1 ; par5 = 12 ;
R code (references can be found in the software module):
if (par1 == 'Default') {
par1 = 10*log10(length(x))
} else {
par1 <- as.numeric(par1)
}
par2 <- as.numeric(par2)
par3 <- as.numeric(par3)
par4 <- as.numeric(par4)
par5 <- as.numeric(par5)
if (par2 == 0) {
x <- log(x)
} else {
x <- (x ^ par2 - 1) / par2
}
if (par3 > 0) x <- diff(x,lag=1,difference=par3)
if (par4 > 0) x <- diff(x,lag=par5,difference=par4)
bitmap(file='pic1.png')
racf <- acf(x,par1,main='Autocorrelation',xlab='lags',ylab='ACF')
dev.off()
bitmap(file='pic2.png')
rpacf <- pacf(x,par1,main='Partial Autocorrelation',xlab='lags',ylab='PACF')
dev.off()
(myacf <- c(racf$acf))
(mypacf <- c(rpacf$acf))
lengthx <- length(x)
sqrtn <- sqrt(lengthx)
load(file='createtable')
a<-table.start()
a<-table.row.start(a)
a<-table.element(a,'Autocorrelation Function',4,TRUE)
a<-table.row.end(a)
a<-table.row.start(a)
a<-table.element(a,'Time lag k',header=TRUE)
a<-table.element(a,hyperlink('basics.htm','ACF(k)','click here for more information about the Autocorrelation Function'),header=TRUE)
a<-table.element(a,'T-STAT',header=TRUE)
a<-table.element(a,'P-value',header=TRUE)
a<-table.row.end(a)
for (i in 2:(par1+1)) {
a<-table.row.start(a)
a<-table.element(a,i-1,header=TRUE)
a<-table.element(a,round(myacf[i],6))
mytstat <- myacf[i]*sqrtn
a<-table.element(a,round(mytstat,4))
a<-table.element(a,round(1-pt(abs(mytstat),lengthx),6))
a<-table.row.end(a)
}
a<-table.end(a)
table.save(a,file='mytable.tab')
a<-table.start()
a<-table.row.start(a)
a<-table.element(a,'Partial Autocorrelation Function',4,TRUE)
a<-table.row.end(a)
a<-table.row.start(a)
a<-table.element(a,'Time lag k',header=TRUE)
a<-table.element(a,hyperlink('basics.htm','PACF(k)','click here for more information about the Partial Autocorrelation Function'),header=TRUE)
a<-table.element(a,'T-STAT',header=TRUE)
a<-table.element(a,'P-value',header=TRUE)
a<-table.row.end(a)
for (i in 1:par1) {
a<-table.row.start(a)
a<-table.element(a,i,header=TRUE)
a<-table.element(a,round(mypacf[i],6))
mytstat <- mypacf[i]*sqrtn
a<-table.element(a,round(mytstat,4))
a<-table.element(a,round(1-pt(abs(mytstat),lengthx),6))
a<-table.row.end(a)
}
a<-table.end(a)
table.save(a,file='mytable1.tab')