Free Statistics

of Irreproducible Research!

Author's title

Author*The author of this computation has been verified*
R Software Modulerwasp_autocorrelation.wasp
Title produced by software(Partial) Autocorrelation Function
Date of computationThu, 04 Dec 2008 10:52:47 -0700
Cite this page as followsStatistical Computations at FreeStatistics.org, Office for Research Development and Education, URL https://freestatistics.org/blog/index.php?v=date/2008/Dec/04/t1228413563ycv20p764uowk2q.htm/, Retrieved Sun, 19 May 2024 05:38:34 +0000
Statistical Computations at FreeStatistics.org, Office for Research Development and Education, URL https://freestatistics.org/blog/index.php?pk=28984, Retrieved Sun, 19 May 2024 05:38:34 +0000
QR Codes:

Original text written by user:
IsPrivate?No (this computation is public)
User-defined keywords
Estimated Impact157
Family? (F = Feedback message, R = changed R code, M = changed R Module, P = changed Parameters, D = changed Data)
-     [(Partial) Autocorrelation Function] [Uitvoer EU - (Par...] [2008-12-04 17:13:31] [9e54d1454d464f1bf9ee4a54d5d56945]
-   PD  [(Partial) Autocorrelation Function] [Uitvoer EU - Part...] [2008-12-04 17:48:53] [9e54d1454d464f1bf9ee4a54d5d56945]
-   P       [(Partial) Autocorrelation Function] [Uitvoer EU - (Par...] [2008-12-04 17:52:47] [8da7502cfecb272886bc60b3f290b8b8] [Current]
Feedback Forum

Post a new message
Dataseries X:
11178.4
9516.4
12102.8
12989.0
11610.2
10205.5
11356.2
11307.1
12648.6
11947.2
11714.1
12192.5
11268.8
9097.4
12639.8
13040.1
11687.3
11191.7
11391.9
11793.1
13933.2
12778.1
11810.3
13698.4
11956.6
10723.8
13938.9
13979.8
13807.4
12973.9
12509.8
12934.1
14908.3
13772.1
13012.6
14049.9
11816.5
11593.2
14466.2
13615.9
14733.9
13880.7
13527.5
13584.0
16170.2
13260.6
14741.9
15486.5
13154.5
12621.2
15031.6
15452.4
15428
13105.9
14716.8
14180.0
16202.2
14392.4
15140.6
15960.1
14351.3
13230.2
15202.1
17157.3
16159.1
13405.7
17224.7
17338.4
17370.6
18817.8
16593.2
17979.5
17015.2


Summary of computational transaction
Raw Inputview raw input (R code)
Raw Outputview raw output of R engine
Computing time1 seconds
R Server'Gwilym Jenkins' @ 72.249.127.135

\begin{tabular}{lllllllll}
\hline
Summary of computational transaction \tabularnewline
Raw Input & view raw input (R code)  \tabularnewline
Raw Output & view raw output of R engine  \tabularnewline
Computing time & 1 seconds \tabularnewline
R Server & 'Gwilym Jenkins' @ 72.249.127.135 \tabularnewline
\hline
\end{tabular}
%Source: https://freestatistics.org/blog/index.php?pk=28984&T=0

[TABLE]
[ROW][C]Summary of computational transaction[/C][/ROW]
[ROW][C]Raw Input[/C][C]view raw input (R code) [/C][/ROW]
[ROW][C]Raw Output[/C][C]view raw output of R engine [/C][/ROW]
[ROW][C]Computing time[/C][C]1 seconds[/C][/ROW]
[ROW][C]R Server[/C][C]'Gwilym Jenkins' @ 72.249.127.135[/C][/ROW]
[/TABLE]
Source: https://freestatistics.org/blog/index.php?pk=28984&T=0

Globally Unique Identifier (entire table): ba.freestatistics.org/blog/index.php?pk=28984&T=0

As an alternative you can also use a QR Code:  

The GUIDs for individual cells are displayed in the table below:

Summary of computational transaction
Raw Inputview raw input (R code)
Raw Outputview raw output of R engine
Computing time1 seconds
R Server'Gwilym Jenkins' @ 72.249.127.135


Autocorrelation Function
Time lag kACF(k)T-STATP-value
1-0.558045-4.32263e-05
2-0.084385-0.65360.25792
30.3560772.75820.003846
4-0.206466-1.59930.057506
5-0.102017-0.79020.216256
60.2978972.30750.012246
7-0.248107-1.92180.02969
8-0.005706-0.04420.482446
90.2184491.69210.047908
10-0.160803-1.24560.108881
11-0.060119-0.46570.321565
120.1608731.24610.108783
13-0.13625-1.05540.147739
140.0169410.13120.448019
150.1231970.95430.171885
16-0.231088-1.790.03925
170.1432961.110.135721
180.0494390.3830.351553
19-0.135881-1.05250.148389
200.1127920.87370.192887
210.0222180.17210.431969
22-0.20345-1.57590.060152
230.3593812.78380.003588
24-0.311442-2.41240.00946
250.0394010.30520.380635
260.1459271.13030.131415
27-0.050544-0.39150.348402
28-0.121779-0.94330.174656
290.1896791.46920.073495
30-0.155182-1.2020.117037
31-0.000373-0.00290.498853
320.1455181.12720.132078
33-0.185886-1.43990.077551
340.0588330.45570.32512
350.0869230.67330.251671
36-0.140352-1.08720.140656
370.0483550.37460.354657
380.0595710.46140.323077
39-0.11332-0.87780.191783
400.0826990.64060.262117
410.0404790.31360.377474
42-0.122904-0.9520.172455
430.0826350.64010.262276
440.0583740.45220.326392
45-0.184301-1.42760.079298
460.1902371.47360.072912
47-0.07656-0.5930.277695
48-0.054256-0.42030.337897
490.1002450.77650.220254
50-0.009935-0.0770.469457
51-0.102455-0.79360.215274
520.121010.93730.17617
53-0.036129-0.27990.390276
54-0.057398-0.44460.329102
550.0888070.68790.247085
56-0.06938-0.53740.296486
570.0263030.20370.419623
580.0037450.0290.488476
59-0.004787-0.03710.485273
60NANANA

\begin{tabular}{lllllllll}
\hline
Autocorrelation Function \tabularnewline
Time lag k & ACF(k) & T-STAT & P-value \tabularnewline
1 & -0.558045 & -4.3226 & 3e-05 \tabularnewline
2 & -0.084385 & -0.6536 & 0.25792 \tabularnewline
3 & 0.356077 & 2.7582 & 0.003846 \tabularnewline
4 & -0.206466 & -1.5993 & 0.057506 \tabularnewline
5 & -0.102017 & -0.7902 & 0.216256 \tabularnewline
6 & 0.297897 & 2.3075 & 0.012246 \tabularnewline
7 & -0.248107 & -1.9218 & 0.02969 \tabularnewline
8 & -0.005706 & -0.0442 & 0.482446 \tabularnewline
9 & 0.218449 & 1.6921 & 0.047908 \tabularnewline
10 & -0.160803 & -1.2456 & 0.108881 \tabularnewline
11 & -0.060119 & -0.4657 & 0.321565 \tabularnewline
12 & 0.160873 & 1.2461 & 0.108783 \tabularnewline
13 & -0.13625 & -1.0554 & 0.147739 \tabularnewline
14 & 0.016941 & 0.1312 & 0.448019 \tabularnewline
15 & 0.123197 & 0.9543 & 0.171885 \tabularnewline
16 & -0.231088 & -1.79 & 0.03925 \tabularnewline
17 & 0.143296 & 1.11 & 0.135721 \tabularnewline
18 & 0.049439 & 0.383 & 0.351553 \tabularnewline
19 & -0.135881 & -1.0525 & 0.148389 \tabularnewline
20 & 0.112792 & 0.8737 & 0.192887 \tabularnewline
21 & 0.022218 & 0.1721 & 0.431969 \tabularnewline
22 & -0.20345 & -1.5759 & 0.060152 \tabularnewline
23 & 0.359381 & 2.7838 & 0.003588 \tabularnewline
24 & -0.311442 & -2.4124 & 0.00946 \tabularnewline
25 & 0.039401 & 0.3052 & 0.380635 \tabularnewline
26 & 0.145927 & 1.1303 & 0.131415 \tabularnewline
27 & -0.050544 & -0.3915 & 0.348402 \tabularnewline
28 & -0.121779 & -0.9433 & 0.174656 \tabularnewline
29 & 0.189679 & 1.4692 & 0.073495 \tabularnewline
30 & -0.155182 & -1.202 & 0.117037 \tabularnewline
31 & -0.000373 & -0.0029 & 0.498853 \tabularnewline
32 & 0.145518 & 1.1272 & 0.132078 \tabularnewline
33 & -0.185886 & -1.4399 & 0.077551 \tabularnewline
34 & 0.058833 & 0.4557 & 0.32512 \tabularnewline
35 & 0.086923 & 0.6733 & 0.251671 \tabularnewline
36 & -0.140352 & -1.0872 & 0.140656 \tabularnewline
37 & 0.048355 & 0.3746 & 0.354657 \tabularnewline
38 & 0.059571 & 0.4614 & 0.323077 \tabularnewline
39 & -0.11332 & -0.8778 & 0.191783 \tabularnewline
40 & 0.082699 & 0.6406 & 0.262117 \tabularnewline
41 & 0.040479 & 0.3136 & 0.377474 \tabularnewline
42 & -0.122904 & -0.952 & 0.172455 \tabularnewline
43 & 0.082635 & 0.6401 & 0.262276 \tabularnewline
44 & 0.058374 & 0.4522 & 0.326392 \tabularnewline
45 & -0.184301 & -1.4276 & 0.079298 \tabularnewline
46 & 0.190237 & 1.4736 & 0.072912 \tabularnewline
47 & -0.07656 & -0.593 & 0.277695 \tabularnewline
48 & -0.054256 & -0.4203 & 0.337897 \tabularnewline
49 & 0.100245 & 0.7765 & 0.220254 \tabularnewline
50 & -0.009935 & -0.077 & 0.469457 \tabularnewline
51 & -0.102455 & -0.7936 & 0.215274 \tabularnewline
52 & 0.12101 & 0.9373 & 0.17617 \tabularnewline
53 & -0.036129 & -0.2799 & 0.390276 \tabularnewline
54 & -0.057398 & -0.4446 & 0.329102 \tabularnewline
55 & 0.088807 & 0.6879 & 0.247085 \tabularnewline
56 & -0.06938 & -0.5374 & 0.296486 \tabularnewline
57 & 0.026303 & 0.2037 & 0.419623 \tabularnewline
58 & 0.003745 & 0.029 & 0.488476 \tabularnewline
59 & -0.004787 & -0.0371 & 0.485273 \tabularnewline
60 & NA & NA & NA \tabularnewline
\hline
\end{tabular}
%Source: https://freestatistics.org/blog/index.php?pk=28984&T=1

[TABLE]
[ROW][C]Autocorrelation Function[/C][/ROW]
[ROW][C]Time lag k[/C][C]ACF(k)[/C][C]T-STAT[/C][C]P-value[/C][/ROW]
[ROW][C]1[/C][C]-0.558045[/C][C]-4.3226[/C][C]3e-05[/C][/ROW]
[ROW][C]2[/C][C]-0.084385[/C][C]-0.6536[/C][C]0.25792[/C][/ROW]
[ROW][C]3[/C][C]0.356077[/C][C]2.7582[/C][C]0.003846[/C][/ROW]
[ROW][C]4[/C][C]-0.206466[/C][C]-1.5993[/C][C]0.057506[/C][/ROW]
[ROW][C]5[/C][C]-0.102017[/C][C]-0.7902[/C][C]0.216256[/C][/ROW]
[ROW][C]6[/C][C]0.297897[/C][C]2.3075[/C][C]0.012246[/C][/ROW]
[ROW][C]7[/C][C]-0.248107[/C][C]-1.9218[/C][C]0.02969[/C][/ROW]
[ROW][C]8[/C][C]-0.005706[/C][C]-0.0442[/C][C]0.482446[/C][/ROW]
[ROW][C]9[/C][C]0.218449[/C][C]1.6921[/C][C]0.047908[/C][/ROW]
[ROW][C]10[/C][C]-0.160803[/C][C]-1.2456[/C][C]0.108881[/C][/ROW]
[ROW][C]11[/C][C]-0.060119[/C][C]-0.4657[/C][C]0.321565[/C][/ROW]
[ROW][C]12[/C][C]0.160873[/C][C]1.2461[/C][C]0.108783[/C][/ROW]
[ROW][C]13[/C][C]-0.13625[/C][C]-1.0554[/C][C]0.147739[/C][/ROW]
[ROW][C]14[/C][C]0.016941[/C][C]0.1312[/C][C]0.448019[/C][/ROW]
[ROW][C]15[/C][C]0.123197[/C][C]0.9543[/C][C]0.171885[/C][/ROW]
[ROW][C]16[/C][C]-0.231088[/C][C]-1.79[/C][C]0.03925[/C][/ROW]
[ROW][C]17[/C][C]0.143296[/C][C]1.11[/C][C]0.135721[/C][/ROW]
[ROW][C]18[/C][C]0.049439[/C][C]0.383[/C][C]0.351553[/C][/ROW]
[ROW][C]19[/C][C]-0.135881[/C][C]-1.0525[/C][C]0.148389[/C][/ROW]
[ROW][C]20[/C][C]0.112792[/C][C]0.8737[/C][C]0.192887[/C][/ROW]
[ROW][C]21[/C][C]0.022218[/C][C]0.1721[/C][C]0.431969[/C][/ROW]
[ROW][C]22[/C][C]-0.20345[/C][C]-1.5759[/C][C]0.060152[/C][/ROW]
[ROW][C]23[/C][C]0.359381[/C][C]2.7838[/C][C]0.003588[/C][/ROW]
[ROW][C]24[/C][C]-0.311442[/C][C]-2.4124[/C][C]0.00946[/C][/ROW]
[ROW][C]25[/C][C]0.039401[/C][C]0.3052[/C][C]0.380635[/C][/ROW]
[ROW][C]26[/C][C]0.145927[/C][C]1.1303[/C][C]0.131415[/C][/ROW]
[ROW][C]27[/C][C]-0.050544[/C][C]-0.3915[/C][C]0.348402[/C][/ROW]
[ROW][C]28[/C][C]-0.121779[/C][C]-0.9433[/C][C]0.174656[/C][/ROW]
[ROW][C]29[/C][C]0.189679[/C][C]1.4692[/C][C]0.073495[/C][/ROW]
[ROW][C]30[/C][C]-0.155182[/C][C]-1.202[/C][C]0.117037[/C][/ROW]
[ROW][C]31[/C][C]-0.000373[/C][C]-0.0029[/C][C]0.498853[/C][/ROW]
[ROW][C]32[/C][C]0.145518[/C][C]1.1272[/C][C]0.132078[/C][/ROW]
[ROW][C]33[/C][C]-0.185886[/C][C]-1.4399[/C][C]0.077551[/C][/ROW]
[ROW][C]34[/C][C]0.058833[/C][C]0.4557[/C][C]0.32512[/C][/ROW]
[ROW][C]35[/C][C]0.086923[/C][C]0.6733[/C][C]0.251671[/C][/ROW]
[ROW][C]36[/C][C]-0.140352[/C][C]-1.0872[/C][C]0.140656[/C][/ROW]
[ROW][C]37[/C][C]0.048355[/C][C]0.3746[/C][C]0.354657[/C][/ROW]
[ROW][C]38[/C][C]0.059571[/C][C]0.4614[/C][C]0.323077[/C][/ROW]
[ROW][C]39[/C][C]-0.11332[/C][C]-0.8778[/C][C]0.191783[/C][/ROW]
[ROW][C]40[/C][C]0.082699[/C][C]0.6406[/C][C]0.262117[/C][/ROW]
[ROW][C]41[/C][C]0.040479[/C][C]0.3136[/C][C]0.377474[/C][/ROW]
[ROW][C]42[/C][C]-0.122904[/C][C]-0.952[/C][C]0.172455[/C][/ROW]
[ROW][C]43[/C][C]0.082635[/C][C]0.6401[/C][C]0.262276[/C][/ROW]
[ROW][C]44[/C][C]0.058374[/C][C]0.4522[/C][C]0.326392[/C][/ROW]
[ROW][C]45[/C][C]-0.184301[/C][C]-1.4276[/C][C]0.079298[/C][/ROW]
[ROW][C]46[/C][C]0.190237[/C][C]1.4736[/C][C]0.072912[/C][/ROW]
[ROW][C]47[/C][C]-0.07656[/C][C]-0.593[/C][C]0.277695[/C][/ROW]
[ROW][C]48[/C][C]-0.054256[/C][C]-0.4203[/C][C]0.337897[/C][/ROW]
[ROW][C]49[/C][C]0.100245[/C][C]0.7765[/C][C]0.220254[/C][/ROW]
[ROW][C]50[/C][C]-0.009935[/C][C]-0.077[/C][C]0.469457[/C][/ROW]
[ROW][C]51[/C][C]-0.102455[/C][C]-0.7936[/C][C]0.215274[/C][/ROW]
[ROW][C]52[/C][C]0.12101[/C][C]0.9373[/C][C]0.17617[/C][/ROW]
[ROW][C]53[/C][C]-0.036129[/C][C]-0.2799[/C][C]0.390276[/C][/ROW]
[ROW][C]54[/C][C]-0.057398[/C][C]-0.4446[/C][C]0.329102[/C][/ROW]
[ROW][C]55[/C][C]0.088807[/C][C]0.6879[/C][C]0.247085[/C][/ROW]
[ROW][C]56[/C][C]-0.06938[/C][C]-0.5374[/C][C]0.296486[/C][/ROW]
[ROW][C]57[/C][C]0.026303[/C][C]0.2037[/C][C]0.419623[/C][/ROW]
[ROW][C]58[/C][C]0.003745[/C][C]0.029[/C][C]0.488476[/C][/ROW]
[ROW][C]59[/C][C]-0.004787[/C][C]-0.0371[/C][C]0.485273[/C][/ROW]
[ROW][C]60[/C][C]NA[/C][C]NA[/C][C]NA[/C][/ROW]
[/TABLE]
Source: https://freestatistics.org/blog/index.php?pk=28984&T=1

Globally Unique Identifier (entire table): ba.freestatistics.org/blog/index.php?pk=28984&T=1

As an alternative you can also use a QR Code:  

The GUIDs for individual cells are displayed in the table below:

Autocorrelation Function
Time lag kACF(k)T-STATP-value
1-0.558045-4.32263e-05
2-0.084385-0.65360.25792
30.3560772.75820.003846
4-0.206466-1.59930.057506
5-0.102017-0.79020.216256
60.2978972.30750.012246
7-0.248107-1.92180.02969
8-0.005706-0.04420.482446
90.2184491.69210.047908
10-0.160803-1.24560.108881
11-0.060119-0.46570.321565
120.1608731.24610.108783
13-0.13625-1.05540.147739
140.0169410.13120.448019
150.1231970.95430.171885
16-0.231088-1.790.03925
170.1432961.110.135721
180.0494390.3830.351553
19-0.135881-1.05250.148389
200.1127920.87370.192887
210.0222180.17210.431969
22-0.20345-1.57590.060152
230.3593812.78380.003588
24-0.311442-2.41240.00946
250.0394010.30520.380635
260.1459271.13030.131415
27-0.050544-0.39150.348402
28-0.121779-0.94330.174656
290.1896791.46920.073495
30-0.155182-1.2020.117037
31-0.000373-0.00290.498853
320.1455181.12720.132078
33-0.185886-1.43990.077551
340.0588330.45570.32512
350.0869230.67330.251671
36-0.140352-1.08720.140656
370.0483550.37460.354657
380.0595710.46140.323077
39-0.11332-0.87780.191783
400.0826990.64060.262117
410.0404790.31360.377474
42-0.122904-0.9520.172455
430.0826350.64010.262276
440.0583740.45220.326392
45-0.184301-1.42760.079298
460.1902371.47360.072912
47-0.07656-0.5930.277695
48-0.054256-0.42030.337897
490.1002450.77650.220254
50-0.009935-0.0770.469457
51-0.102455-0.79360.215274
520.121010.93730.17617
53-0.036129-0.27990.390276
54-0.057398-0.44460.329102
550.0888070.68790.247085
56-0.06938-0.53740.296486
570.0263030.20370.419623
580.0037450.0290.488476
59-0.004787-0.03710.485273
60NANANA


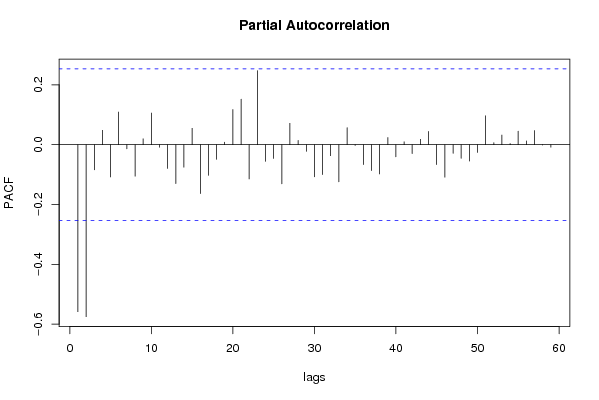
Partial Autocorrelation Function
Time lag kPACF(k)T-STATP-value
1-0.558045-4.32263e-05
2-0.574801-4.45241.9e-05
3-0.08425-0.65260.258254
40.0479120.37110.355927
5-0.107897-0.83580.203302
60.1088760.84330.201192
7-0.013951-0.10810.457152
8-0.105193-0.81480.209199
90.0195960.15180.439931
100.1054970.81720.208531
11-0.00839-0.0650.4742
12-0.079644-0.61690.269812
13-0.130032-1.00720.158936
14-0.075307-0.58330.280931
150.0545620.42260.337037
16-0.163496-1.26640.105127
17-0.102348-0.79280.215513
18-0.049175-0.38090.352309
190.0082440.06390.474647
200.1171910.90780.183819
210.1520451.17770.121776
22-0.114676-0.88830.188971
230.2472711.91540.030109
24-0.055747-0.43180.333713
25-0.045977-0.35610.361495
26-0.130932-1.01420.157282
270.0712720.55210.291474
280.0139910.10840.457031
29-0.022159-0.17160.432148
30-0.107405-0.8320.204367
31-0.100071-0.77510.22065
32-0.036768-0.28480.388387
33-0.124104-0.96130.170128
340.056580.43830.331383
35-0.002805-0.02170.491369
36-0.06661-0.5160.303891
37-0.086464-0.66980.252793
38-0.097929-0.75860.225545
390.023850.18470.427029
40-0.040635-0.31480.37702
410.0094380.07310.470982
42-0.029647-0.22960.409575
430.0179790.13930.444853
440.0442950.34310.366359
45-0.06659-0.51580.303944
46-0.108581-0.84110.201825
47-0.028949-0.22420.411667
48-0.045772-0.35460.362084
49-0.054823-0.42470.336302
50-0.026215-0.20310.419886
510.096290.74590.229331
520.0065490.05070.479854
530.0322580.24990.401771
540.0035140.02720.489188
550.0449820.34840.36437
560.0122830.09510.46226
570.0469460.36360.358702
58-0.001422-0.0110.495623
59-0.00863-0.06680.473462
60NANANA

\begin{tabular}{lllllllll}
\hline
Partial Autocorrelation Function \tabularnewline
Time lag k & PACF(k) & T-STAT & P-value \tabularnewline
1 & -0.558045 & -4.3226 & 3e-05 \tabularnewline
2 & -0.574801 & -4.4524 & 1.9e-05 \tabularnewline
3 & -0.08425 & -0.6526 & 0.258254 \tabularnewline
4 & 0.047912 & 0.3711 & 0.355927 \tabularnewline
5 & -0.107897 & -0.8358 & 0.203302 \tabularnewline
6 & 0.108876 & 0.8433 & 0.201192 \tabularnewline
7 & -0.013951 & -0.1081 & 0.457152 \tabularnewline
8 & -0.105193 & -0.8148 & 0.209199 \tabularnewline
9 & 0.019596 & 0.1518 & 0.439931 \tabularnewline
10 & 0.105497 & 0.8172 & 0.208531 \tabularnewline
11 & -0.00839 & -0.065 & 0.4742 \tabularnewline
12 & -0.079644 & -0.6169 & 0.269812 \tabularnewline
13 & -0.130032 & -1.0072 & 0.158936 \tabularnewline
14 & -0.075307 & -0.5833 & 0.280931 \tabularnewline
15 & 0.054562 & 0.4226 & 0.337037 \tabularnewline
16 & -0.163496 & -1.2664 & 0.105127 \tabularnewline
17 & -0.102348 & -0.7928 & 0.215513 \tabularnewline
18 & -0.049175 & -0.3809 & 0.352309 \tabularnewline
19 & 0.008244 & 0.0639 & 0.474647 \tabularnewline
20 & 0.117191 & 0.9078 & 0.183819 \tabularnewline
21 & 0.152045 & 1.1777 & 0.121776 \tabularnewline
22 & -0.114676 & -0.8883 & 0.188971 \tabularnewline
23 & 0.247271 & 1.9154 & 0.030109 \tabularnewline
24 & -0.055747 & -0.4318 & 0.333713 \tabularnewline
25 & -0.045977 & -0.3561 & 0.361495 \tabularnewline
26 & -0.130932 & -1.0142 & 0.157282 \tabularnewline
27 & 0.071272 & 0.5521 & 0.291474 \tabularnewline
28 & 0.013991 & 0.1084 & 0.457031 \tabularnewline
29 & -0.022159 & -0.1716 & 0.432148 \tabularnewline
30 & -0.107405 & -0.832 & 0.204367 \tabularnewline
31 & -0.100071 & -0.7751 & 0.22065 \tabularnewline
32 & -0.036768 & -0.2848 & 0.388387 \tabularnewline
33 & -0.124104 & -0.9613 & 0.170128 \tabularnewline
34 & 0.05658 & 0.4383 & 0.331383 \tabularnewline
35 & -0.002805 & -0.0217 & 0.491369 \tabularnewline
36 & -0.06661 & -0.516 & 0.303891 \tabularnewline
37 & -0.086464 & -0.6698 & 0.252793 \tabularnewline
38 & -0.097929 & -0.7586 & 0.225545 \tabularnewline
39 & 0.02385 & 0.1847 & 0.427029 \tabularnewline
40 & -0.040635 & -0.3148 & 0.37702 \tabularnewline
41 & 0.009438 & 0.0731 & 0.470982 \tabularnewline
42 & -0.029647 & -0.2296 & 0.409575 \tabularnewline
43 & 0.017979 & 0.1393 & 0.444853 \tabularnewline
44 & 0.044295 & 0.3431 & 0.366359 \tabularnewline
45 & -0.06659 & -0.5158 & 0.303944 \tabularnewline
46 & -0.108581 & -0.8411 & 0.201825 \tabularnewline
47 & -0.028949 & -0.2242 & 0.411667 \tabularnewline
48 & -0.045772 & -0.3546 & 0.362084 \tabularnewline
49 & -0.054823 & -0.4247 & 0.336302 \tabularnewline
50 & -0.026215 & -0.2031 & 0.419886 \tabularnewline
51 & 0.09629 & 0.7459 & 0.229331 \tabularnewline
52 & 0.006549 & 0.0507 & 0.479854 \tabularnewline
53 & 0.032258 & 0.2499 & 0.401771 \tabularnewline
54 & 0.003514 & 0.0272 & 0.489188 \tabularnewline
55 & 0.044982 & 0.3484 & 0.36437 \tabularnewline
56 & 0.012283 & 0.0951 & 0.46226 \tabularnewline
57 & 0.046946 & 0.3636 & 0.358702 \tabularnewline
58 & -0.001422 & -0.011 & 0.495623 \tabularnewline
59 & -0.00863 & -0.0668 & 0.473462 \tabularnewline
60 & NA & NA & NA \tabularnewline
\hline
\end{tabular}
%Source: https://freestatistics.org/blog/index.php?pk=28984&T=2

[TABLE]
[ROW][C]Partial Autocorrelation Function[/C][/ROW]
[ROW][C]Time lag k[/C][C]PACF(k)[/C][C]T-STAT[/C][C]P-value[/C][/ROW]
[ROW][C]1[/C][C]-0.558045[/C][C]-4.3226[/C][C]3e-05[/C][/ROW]
[ROW][C]2[/C][C]-0.574801[/C][C]-4.4524[/C][C]1.9e-05[/C][/ROW]
[ROW][C]3[/C][C]-0.08425[/C][C]-0.6526[/C][C]0.258254[/C][/ROW]
[ROW][C]4[/C][C]0.047912[/C][C]0.3711[/C][C]0.355927[/C][/ROW]
[ROW][C]5[/C][C]-0.107897[/C][C]-0.8358[/C][C]0.203302[/C][/ROW]
[ROW][C]6[/C][C]0.108876[/C][C]0.8433[/C][C]0.201192[/C][/ROW]
[ROW][C]7[/C][C]-0.013951[/C][C]-0.1081[/C][C]0.457152[/C][/ROW]
[ROW][C]8[/C][C]-0.105193[/C][C]-0.8148[/C][C]0.209199[/C][/ROW]
[ROW][C]9[/C][C]0.019596[/C][C]0.1518[/C][C]0.439931[/C][/ROW]
[ROW][C]10[/C][C]0.105497[/C][C]0.8172[/C][C]0.208531[/C][/ROW]
[ROW][C]11[/C][C]-0.00839[/C][C]-0.065[/C][C]0.4742[/C][/ROW]
[ROW][C]12[/C][C]-0.079644[/C][C]-0.6169[/C][C]0.269812[/C][/ROW]
[ROW][C]13[/C][C]-0.130032[/C][C]-1.0072[/C][C]0.158936[/C][/ROW]
[ROW][C]14[/C][C]-0.075307[/C][C]-0.5833[/C][C]0.280931[/C][/ROW]
[ROW][C]15[/C][C]0.054562[/C][C]0.4226[/C][C]0.337037[/C][/ROW]
[ROW][C]16[/C][C]-0.163496[/C][C]-1.2664[/C][C]0.105127[/C][/ROW]
[ROW][C]17[/C][C]-0.102348[/C][C]-0.7928[/C][C]0.215513[/C][/ROW]
[ROW][C]18[/C][C]-0.049175[/C][C]-0.3809[/C][C]0.352309[/C][/ROW]
[ROW][C]19[/C][C]0.008244[/C][C]0.0639[/C][C]0.474647[/C][/ROW]
[ROW][C]20[/C][C]0.117191[/C][C]0.9078[/C][C]0.183819[/C][/ROW]
[ROW][C]21[/C][C]0.152045[/C][C]1.1777[/C][C]0.121776[/C][/ROW]
[ROW][C]22[/C][C]-0.114676[/C][C]-0.8883[/C][C]0.188971[/C][/ROW]
[ROW][C]23[/C][C]0.247271[/C][C]1.9154[/C][C]0.030109[/C][/ROW]
[ROW][C]24[/C][C]-0.055747[/C][C]-0.4318[/C][C]0.333713[/C][/ROW]
[ROW][C]25[/C][C]-0.045977[/C][C]-0.3561[/C][C]0.361495[/C][/ROW]
[ROW][C]26[/C][C]-0.130932[/C][C]-1.0142[/C][C]0.157282[/C][/ROW]
[ROW][C]27[/C][C]0.071272[/C][C]0.5521[/C][C]0.291474[/C][/ROW]
[ROW][C]28[/C][C]0.013991[/C][C]0.1084[/C][C]0.457031[/C][/ROW]
[ROW][C]29[/C][C]-0.022159[/C][C]-0.1716[/C][C]0.432148[/C][/ROW]
[ROW][C]30[/C][C]-0.107405[/C][C]-0.832[/C][C]0.204367[/C][/ROW]
[ROW][C]31[/C][C]-0.100071[/C][C]-0.7751[/C][C]0.22065[/C][/ROW]
[ROW][C]32[/C][C]-0.036768[/C][C]-0.2848[/C][C]0.388387[/C][/ROW]
[ROW][C]33[/C][C]-0.124104[/C][C]-0.9613[/C][C]0.170128[/C][/ROW]
[ROW][C]34[/C][C]0.05658[/C][C]0.4383[/C][C]0.331383[/C][/ROW]
[ROW][C]35[/C][C]-0.002805[/C][C]-0.0217[/C][C]0.491369[/C][/ROW]
[ROW][C]36[/C][C]-0.06661[/C][C]-0.516[/C][C]0.303891[/C][/ROW]
[ROW][C]37[/C][C]-0.086464[/C][C]-0.6698[/C][C]0.252793[/C][/ROW]
[ROW][C]38[/C][C]-0.097929[/C][C]-0.7586[/C][C]0.225545[/C][/ROW]
[ROW][C]39[/C][C]0.02385[/C][C]0.1847[/C][C]0.427029[/C][/ROW]
[ROW][C]40[/C][C]-0.040635[/C][C]-0.3148[/C][C]0.37702[/C][/ROW]
[ROW][C]41[/C][C]0.009438[/C][C]0.0731[/C][C]0.470982[/C][/ROW]
[ROW][C]42[/C][C]-0.029647[/C][C]-0.2296[/C][C]0.409575[/C][/ROW]
[ROW][C]43[/C][C]0.017979[/C][C]0.1393[/C][C]0.444853[/C][/ROW]
[ROW][C]44[/C][C]0.044295[/C][C]0.3431[/C][C]0.366359[/C][/ROW]
[ROW][C]45[/C][C]-0.06659[/C][C]-0.5158[/C][C]0.303944[/C][/ROW]
[ROW][C]46[/C][C]-0.108581[/C][C]-0.8411[/C][C]0.201825[/C][/ROW]
[ROW][C]47[/C][C]-0.028949[/C][C]-0.2242[/C][C]0.411667[/C][/ROW]
[ROW][C]48[/C][C]-0.045772[/C][C]-0.3546[/C][C]0.362084[/C][/ROW]
[ROW][C]49[/C][C]-0.054823[/C][C]-0.4247[/C][C]0.336302[/C][/ROW]
[ROW][C]50[/C][C]-0.026215[/C][C]-0.2031[/C][C]0.419886[/C][/ROW]
[ROW][C]51[/C][C]0.09629[/C][C]0.7459[/C][C]0.229331[/C][/ROW]
[ROW][C]52[/C][C]0.006549[/C][C]0.0507[/C][C]0.479854[/C][/ROW]
[ROW][C]53[/C][C]0.032258[/C][C]0.2499[/C][C]0.401771[/C][/ROW]
[ROW][C]54[/C][C]0.003514[/C][C]0.0272[/C][C]0.489188[/C][/ROW]
[ROW][C]55[/C][C]0.044982[/C][C]0.3484[/C][C]0.36437[/C][/ROW]
[ROW][C]56[/C][C]0.012283[/C][C]0.0951[/C][C]0.46226[/C][/ROW]
[ROW][C]57[/C][C]0.046946[/C][C]0.3636[/C][C]0.358702[/C][/ROW]
[ROW][C]58[/C][C]-0.001422[/C][C]-0.011[/C][C]0.495623[/C][/ROW]
[ROW][C]59[/C][C]-0.00863[/C][C]-0.0668[/C][C]0.473462[/C][/ROW]
[ROW][C]60[/C][C]NA[/C][C]NA[/C][C]NA[/C][/ROW]
[/TABLE]
Source: https://freestatistics.org/blog/index.php?pk=28984&T=2

Globally Unique Identifier (entire table): ba.freestatistics.org/blog/index.php?pk=28984&T=2

As an alternative you can also use a QR Code:  

The GUIDs for individual cells are displayed in the table below:

Partial Autocorrelation Function
Time lag kPACF(k)T-STATP-value
1-0.558045-4.32263e-05
2-0.574801-4.45241.9e-05
3-0.08425-0.65260.258254
40.0479120.37110.355927
5-0.107897-0.83580.203302
60.1088760.84330.201192
7-0.013951-0.10810.457152
8-0.105193-0.81480.209199
90.0195960.15180.439931
100.1054970.81720.208531
11-0.00839-0.0650.4742
12-0.079644-0.61690.269812
13-0.130032-1.00720.158936
14-0.075307-0.58330.280931
150.0545620.42260.337037
16-0.163496-1.26640.105127
17-0.102348-0.79280.215513
18-0.049175-0.38090.352309
190.0082440.06390.474647
200.1171910.90780.183819
210.1520451.17770.121776
22-0.114676-0.88830.188971
230.2472711.91540.030109
24-0.055747-0.43180.333713
25-0.045977-0.35610.361495
26-0.130932-1.01420.157282
270.0712720.55210.291474
280.0139910.10840.457031
29-0.022159-0.17160.432148
30-0.107405-0.8320.204367
31-0.100071-0.77510.22065
32-0.036768-0.28480.388387
33-0.124104-0.96130.170128
340.056580.43830.331383
35-0.002805-0.02170.491369
36-0.06661-0.5160.303891
37-0.086464-0.66980.252793
38-0.097929-0.75860.225545
390.023850.18470.427029
40-0.040635-0.31480.37702
410.0094380.07310.470982
42-0.029647-0.22960.409575
430.0179790.13930.444853
440.0442950.34310.366359
45-0.06659-0.51580.303944
46-0.108581-0.84110.201825
47-0.028949-0.22420.411667
48-0.045772-0.35460.362084
49-0.054823-0.42470.336302
50-0.026215-0.20310.419886
510.096290.74590.229331
520.0065490.05070.479854
530.0322580.24990.401771
540.0035140.02720.489188
550.0449820.34840.36437
560.0122830.09510.46226
570.0469460.36360.358702
58-0.001422-0.0110.495623
59-0.00863-0.06680.473462
60NANANA


Parameters (Session):
par1 = 60 ; par2 = 1 ; par3 = 1 ; par4 = 1 ; par5 = 12 ;
Parameters (R input):
par1 = 60 ; par2 = 1 ; par3 = 1 ; par4 = 1 ; par5 = 12 ;
R code (references can be found in the software module):
if (par1 == 'Default') {
par1 = 10*log10(length(x))
} else {
par1 <- as.numeric(par1)
}
par2 <- as.numeric(par2)
par3 <- as.numeric(par3)
par4 <- as.numeric(par4)
par5 <- as.numeric(par5)
if (par2 == 0) {
x <- log(x)
} else {
x <- (x ^ par2 - 1) / par2
}
if (par3 > 0) x <- diff(x,lag=1,difference=par3)
if (par4 > 0) x <- diff(x,lag=par5,difference=par4)
bitmap(file='pic1.png')
racf <- acf(x,par1,main='Autocorrelation',xlab='lags',ylab='ACF')
dev.off()
bitmap(file='pic2.png')
rpacf <- pacf(x,par1,main='Partial Autocorrelation',xlab='lags',ylab='PACF')
dev.off()
(myacf <- c(racf$acf))
(mypacf <- c(rpacf$acf))
lengthx <- length(x)
sqrtn <- sqrt(lengthx)
load(file='createtable')
a<-table.start()
a<-table.row.start(a)
a<-table.element(a,'Autocorrelation Function',4,TRUE)
a<-table.row.end(a)
a<-table.row.start(a)
a<-table.element(a,'Time lag k',header=TRUE)
a<-table.element(a,hyperlink('basics.htm','ACF(k)','click here for more information about the Autocorrelation Function'),header=TRUE)
a<-table.element(a,'T-STAT',header=TRUE)
a<-table.element(a,'P-value',header=TRUE)
a<-table.row.end(a)
for (i in 2:(par1+1)) {
a<-table.row.start(a)
a<-table.element(a,i-1,header=TRUE)
a<-table.element(a,round(myacf[i],6))
mytstat <- myacf[i]*sqrtn
a<-table.element(a,round(mytstat,4))
a<-table.element(a,round(1-pt(abs(mytstat),lengthx),6))
a<-table.row.end(a)
}
a<-table.end(a)
table.save(a,file='mytable.tab')
a<-table.start()
a<-table.row.start(a)
a<-table.element(a,'Partial Autocorrelation Function',4,TRUE)
a<-table.row.end(a)
a<-table.row.start(a)
a<-table.element(a,'Time lag k',header=TRUE)
a<-table.element(a,hyperlink('basics.htm','PACF(k)','click here for more information about the Partial Autocorrelation Function'),header=TRUE)
a<-table.element(a,'T-STAT',header=TRUE)
a<-table.element(a,'P-value',header=TRUE)
a<-table.row.end(a)
for (i in 1:par1) {
a<-table.row.start(a)
a<-table.element(a,i,header=TRUE)
a<-table.element(a,round(mypacf[i],6))
mytstat <- mypacf[i]*sqrtn
a<-table.element(a,round(mytstat,4))
a<-table.element(a,round(1-pt(abs(mytstat),lengthx),6))
a<-table.row.end(a)
}
a<-table.end(a)
table.save(a,file='mytable1.tab')