Free Statistics

of Irreproducible Research!

Author's title

Author*The author of this computation has been verified*
R Software Modulerwasp_edauni.wasp
Title produced by softwareUnivariate Explorative Data Analysis
Date of computationThu, 04 Dec 2008 07:50:07 -0700
Cite this page as followsStatistical Computations at FreeStatistics.org, Office for Research Development and Education, URL https://freestatistics.org/blog/index.php?v=date/2008/Dec/04/t1228402304qruegw62i6tg1cp.htm/, Retrieved Sun, 19 May 2024 04:08:51 +0000
Statistical Computations at FreeStatistics.org, Office for Research Development and Education, URL https://freestatistics.org/blog/index.php?pk=28930, Retrieved Sun, 19 May 2024 04:08:51 +0000
QR Codes:

Original text written by user:
IsPrivate?No (this computation is public)
User-defined keywords
Estimated Impact223
Family? (F = Feedback message, R = changed R code, M = changed R Module, P = changed Parameters, D = changed Data)
-       [Univariate Explorative Data Analysis] [EDA master] [2008-12-04 14:50:07] [21d7d81e7693ad6dde5aadefb1046611] [Current]
Feedback Forum

Post a new message
Dataseries X:
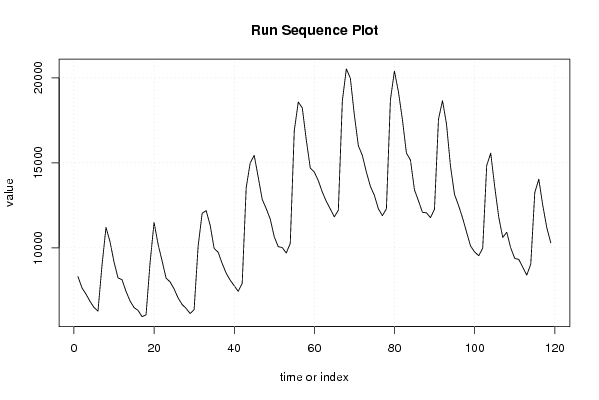
8310
7649
7279
6857
6496
6280
8962
11205
10363
9175
8234
8121
7438
6876
6489
6319
5952
6055
9107
11493
10213
9238
8218
7995
7581
7051
6668
6433
6135
6365
10095
12029
12184
11331
9961
9739
9080
8507
8097
7772
7440
7902
13539
14992
15436
14156
12846
12302
11691
10648
10064
10016
9691
10260
16882
18573
18227
16346
14694
14453
13949
13277
12726
12279
11819
12207
18637
20519
19974
17802
15997
15430
14452
13614
13080
12290
11890
12292
18700
20388
19170
17530
15564
15163
13406
12763
12083
12054
11770
12266
17549
18655
17279
14788
13138
12494
11767
10928
10104
9760
9536
9978
14846
15565
13587
11804
10611
10915
9988
9376
9319
8852
8392
9050
13250
14037
12486
11182
10287


Summary of computational transaction
Raw Inputview raw input (R code)
Raw Outputview raw output of R engine
Computing time4 seconds
R Server'Herman Ole Andreas Wold' @ 193.190.124.10:1001

\begin{tabular}{lllllllll}
\hline
Summary of computational transaction \tabularnewline
Raw Input & view raw input (R code)  \tabularnewline
Raw Output & view raw output of R engine  \tabularnewline
Computing time & 4 seconds \tabularnewline
R Server & 'Herman Ole Andreas Wold' @ 193.190.124.10:1001 \tabularnewline
\hline
\end{tabular}
%Source: https://freestatistics.org/blog/index.php?pk=28930&T=0

[TABLE]
[ROW][C]Summary of computational transaction[/C][/ROW]
[ROW][C]Raw Input[/C][C]view raw input (R code) [/C][/ROW]
[ROW][C]Raw Output[/C][C]view raw output of R engine [/C][/ROW]
[ROW][C]Computing time[/C][C]4 seconds[/C][/ROW]
[ROW][C]R Server[/C][C]'Herman Ole Andreas Wold' @ 193.190.124.10:1001[/C][/ROW]
[/TABLE]
Source: https://freestatistics.org/blog/index.php?pk=28930&T=0

Globally Unique Identifier (entire table): ba.freestatistics.org/blog/index.php?pk=28930&T=0

As an alternative you can also use a QR Code:  

The GUIDs for individual cells are displayed in the table below:

Summary of computational transaction
Raw Inputview raw input (R code)
Raw Outputview raw output of R engine
Computing time4 seconds
R Server'Herman Ole Andreas Wold' @ 193.190.124.10:1001


Descriptive Statistics
# observations119
minimum5952
Q19006
median11493
mean11648.1008403361
Q313781.5
maximum20519

\begin{tabular}{lllllllll}
\hline
Descriptive Statistics \tabularnewline
# observations & 119 \tabularnewline
minimum & 5952 \tabularnewline
Q1 & 9006 \tabularnewline
median & 11493 \tabularnewline
mean & 11648.1008403361 \tabularnewline
Q3 & 13781.5 \tabularnewline
maximum & 20519 \tabularnewline
\hline
\end{tabular}
%Source: https://freestatistics.org/blog/index.php?pk=28930&T=1

[TABLE]
[ROW][C]Descriptive Statistics[/C][/ROW]
[ROW][C]# observations[/C][C]119[/C][/ROW]
[ROW][C]minimum[/C][C]5952[/C][/ROW]
[ROW][C]Q1[/C][C]9006[/C][/ROW]
[ROW][C]median[/C][C]11493[/C][/ROW]
[ROW][C]mean[/C][C]11648.1008403361[/C][/ROW]
[ROW][C]Q3[/C][C]13781.5[/C][/ROW]
[ROW][C]maximum[/C][C]20519[/C][/ROW]
[/TABLE]
Source: https://freestatistics.org/blog/index.php?pk=28930&T=1

Globally Unique Identifier (entire table): ba.freestatistics.org/blog/index.php?pk=28930&T=1

As an alternative you can also use a QR Code:  

The GUIDs for individual cells are displayed in the table below:

Descriptive Statistics
# observations119
minimum5952
Q19006
median11493
mean11648.1008403361
Q313781.5
maximum20519


Parameters (Session):
par1 = 0 ; par2 = 36 ;
Parameters (R input):
par1 = 0 ; par2 = 36 ;
R code (references can be found in the software module):
par1 <- as.numeric(par1)
par2 <- as.numeric(par2)
x <- as.ts(x)
library(lattice)
bitmap(file='pic1.png')
plot(x,type='l',main='Run Sequence Plot',xlab='time or index',ylab='value')
grid()
dev.off()
bitmap(file='pic2.png')
hist(x)
grid()
dev.off()
bitmap(file='pic3.png')
if (par1 > 0)
{
densityplot(~x,col='black',main=paste('Density Plot bw = ',par1),bw=par1)
} else {
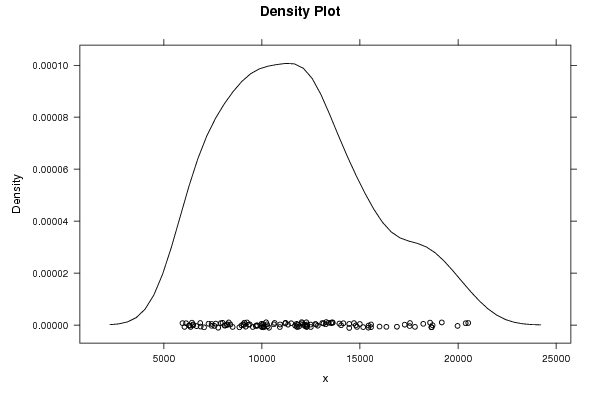
densityplot(~x,col='black',main='Density Plot')
}
dev.off()
bitmap(file='pic4.png')
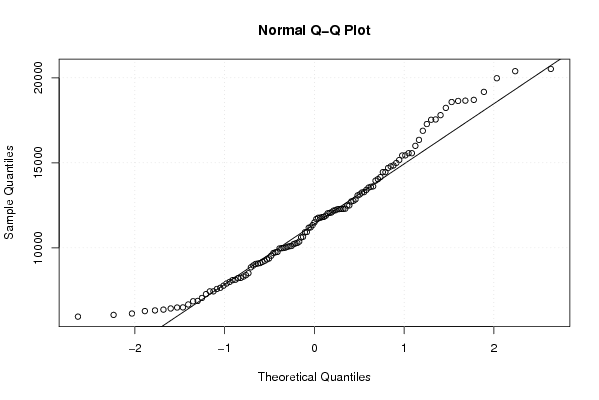
qqnorm(x)
qqline(x)
grid()
dev.off()
if (par2 > 0)
{
bitmap(file='lagplot1.png')
dum <- cbind(lag(x,k=1),x)
dum
dum1 <- dum[2:length(x),]
dum1
z <- as.data.frame(dum1)
z
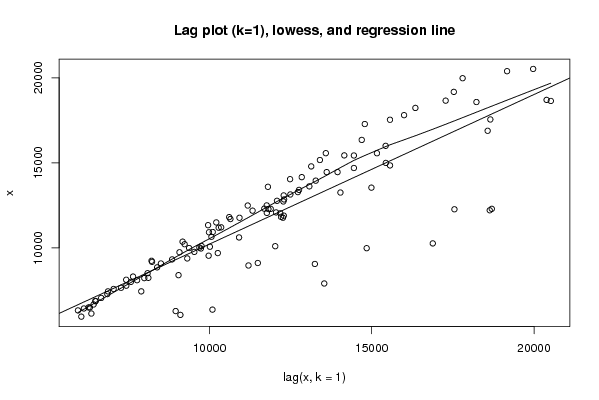
plot(z,main='Lag plot (k=1), lowess, and regression line')
lines(lowess(z))
abline(lm(z))
dev.off()
if (par2 > 1) {
bitmap(file='lagplotpar2.png')
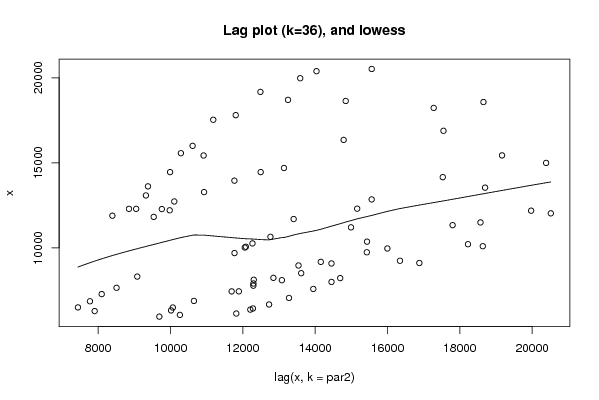
dum <- cbind(lag(x,k=par2),x)
dum
dum1 <- dum[(par2+1):length(x),]
dum1
z <- as.data.frame(dum1)
z
mylagtitle <- 'Lag plot (k='
mylagtitle <- paste(mylagtitle,par2,sep='')
mylagtitle <- paste(mylagtitle,'), and lowess',sep='')
plot(z,main=mylagtitle)
lines(lowess(z))
dev.off()
}
bitmap(file='pic5.png')
acf(x,lag.max=par2,main='Autocorrelation Function')
grid()
dev.off()
}
summary(x)
load(file='createtable')
a<-table.start()
a<-table.row.start(a)
a<-table.element(a,'Descriptive Statistics',2,TRUE)
a<-table.row.end(a)
a<-table.row.start(a)
a<-table.element(a,'# observations',header=TRUE)
a<-table.element(a,length(x))
a<-table.row.end(a)
a<-table.row.start(a)
a<-table.element(a,'minimum',header=TRUE)
a<-table.element(a,min(x))
a<-table.row.end(a)
a<-table.row.start(a)
a<-table.element(a,'Q1',header=TRUE)
a<-table.element(a,quantile(x,0.25))
a<-table.row.end(a)
a<-table.row.start(a)
a<-table.element(a,'median',header=TRUE)
a<-table.element(a,median(x))
a<-table.row.end(a)
a<-table.row.start(a)
a<-table.element(a,'mean',header=TRUE)
a<-table.element(a,mean(x))
a<-table.row.end(a)
a<-table.row.start(a)
a<-table.element(a,'Q3',header=TRUE)
a<-table.element(a,quantile(x,0.75))
a<-table.row.end(a)
a<-table.row.start(a)
a<-table.element(a,'maximum',header=TRUE)
a<-table.element(a,max(x))
a<-table.row.end(a)
a<-table.end(a)
table.save(a,file='mytable.tab')