Free Statistics

of Irreproducible Research!

Author's title

Author*The author of this computation has been verified*
R Software Modulerwasp_autocorrelation.wasp
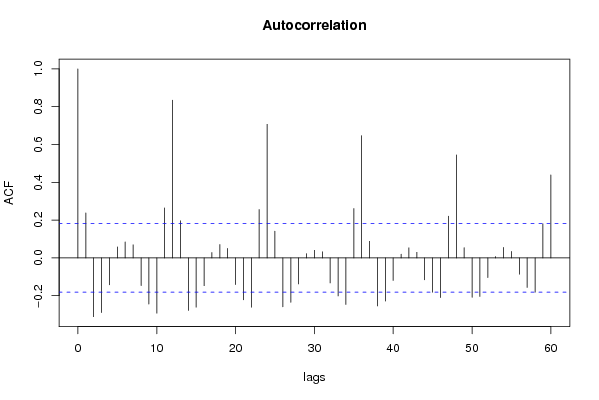
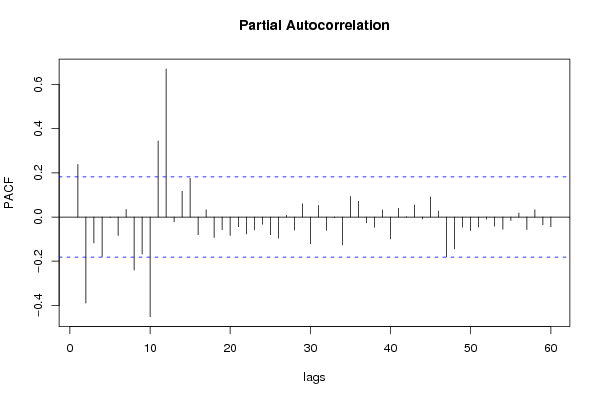
Title produced by software(Partial) Autocorrelation Function
Date of computationWed, 03 Dec 2008 10:12:09 -0700
Cite this page as followsStatistical Computations at FreeStatistics.org, Office for Research Development and Education, URL https://freestatistics.org/blog/index.php?v=date/2008/Dec/03/t1228324414hd2xgchjf548ns9.htm/, Retrieved Sun, 19 May 2024 07:44:10 +0000
Statistical Computations at FreeStatistics.org, Office for Research Development and Education, URL https://freestatistics.org/blog/index.php?pk=28801, Retrieved Sun, 19 May 2024 07:44:10 +0000
QR Codes:

Original text written by user:
IsPrivate?No (this computation is public)
User-defined keywords
Estimated Impact159
Family? (F = Feedback message, R = changed R code, M = changed R Module, P = changed Parameters, D = changed Data)
F       [(Partial) Autocorrelation Function] [ACF d = 1] [2008-12-03 17:12:09] [21d7d81e7693ad6dde5aadefb1046611] [Current]
Feedback Forum
2008-12-15 18:03:24 [Davy De Nef] [reply
Hier wordt d=1 en D=0. Het gevolg hiervan zien we in de grafiek. De dalende lange termijntrend is verdwenen. Nu stoten we echter op een ander merkwaardig kenmerk. We zien significant positieve waarden bij lag 12, lag 24, lag 36,… Dit wijst op seizoenaliteit in de tijdreeks. Deze kan weggewerkt worden door D=1 te stellen in plaats van D=0.

Post a new message
Dataseries X:
206010
198112
194519
185705
180173
176142
203401
221902
197378
185001
176356
180449
180144
173666
165688
161570
156145
153730
182698
200765
176512
166618
158644
159585
163095
159044
155511
153745
150569
150605
179612
194690
189917
184128
175335
179566
181140
177876
175041
169292
166070
166972
206348
215706
202108
195411
193111
195198
198770
194163
190420
189733
186029
191531
232571
243477
227247
217859
208679
213188
216234
213586
209465
204045
200237
203666
241476
260307
243324
244460
233575
237217
235243
230354
227184
221678
217142
219452
256446
265845
248624
241114
229245
231805
219277
219313
212610
214771
211142
211457
240048
240636
230580
208795
197922
194596
194581
185686
178106
172608
167302
168053
202300
202388
182516
173476
166444
171297
169701
164182
161914
159612
151001
158114
186530
187069
174330
169362


Summary of computational transaction
Raw Inputview raw input (R code)
Raw Outputview raw output of R engine
Computing time1 seconds
R Server'Gwilym Jenkins' @ 72.249.127.135

\begin{tabular}{lllllllll}
\hline
Summary of computational transaction \tabularnewline
Raw Input & view raw input (R code)  \tabularnewline
Raw Output & view raw output of R engine  \tabularnewline
Computing time & 1 seconds \tabularnewline
R Server & 'Gwilym Jenkins' @ 72.249.127.135 \tabularnewline
\hline
\end{tabular}
%Source: https://freestatistics.org/blog/index.php?pk=28801&T=0

[TABLE]
[ROW][C]Summary of computational transaction[/C][/ROW]
[ROW][C]Raw Input[/C][C]view raw input (R code) [/C][/ROW]
[ROW][C]Raw Output[/C][C]view raw output of R engine [/C][/ROW]
[ROW][C]Computing time[/C][C]1 seconds[/C][/ROW]
[ROW][C]R Server[/C][C]'Gwilym Jenkins' @ 72.249.127.135[/C][/ROW]
[/TABLE]
Source: https://freestatistics.org/blog/index.php?pk=28801&T=0

Globally Unique Identifier (entire table): ba.freestatistics.org/blog/index.php?pk=28801&T=0

As an alternative you can also use a QR Code:  

The GUIDs for individual cells are displayed in the table below:

Summary of computational transaction
Raw Inputview raw input (R code)
Raw Outputview raw output of R engine
Computing time1 seconds
R Server'Gwilym Jenkins' @ 72.249.127.135


Autocorrelation Function
Time lag kACF(k)T-STATP-value
10.2377432.57160.005688
2-0.310841-3.36230.000523
3-0.288981-3.12580.001118
4-0.142412-1.54040.063079
50.0581810.62930.265183
60.0845650.91470.181112
70.06920.74850.227826
8-0.146587-1.58560.057767
9-0.244455-2.64420.004656
10-0.292561-3.16450.00099
110.2645652.86170.002497
120.8349529.03140
130.1966442.1270.017759
14-0.277772-3.00460.001627
15-0.26083-2.82130.00281
16-0.146932-1.58930.057344
170.0284120.30730.379574
180.0708710.76660.222437
190.0499430.54020.295037
20-0.140831-1.52330.065188
21-0.221642-2.39740.009047
22-0.260629-2.81910.002828
230.2556932.76570.003301
240.7069877.64720
250.1416861.53260.064041
26-0.25861-2.79730.003014
27-0.235034-2.54230.00616
28-0.137625-1.48860.069636
290.0224640.2430.404221
300.0399070.43170.333393
310.0322870.34920.363768
32-0.132774-1.43620.076811
33-0.200924-2.17330.015885
34-0.245906-2.65990.004457
350.2614892.82840.002753
360.6471036.99950
370.0875440.94690.172812
38-0.254277-2.75040.003449
39-0.22837-2.47020.007473
40-0.119049-1.28770.100194
410.0199230.21550.414876
420.0531770.57520.283131
430.0299620.32410.373224
44-0.116088-1.25570.105866
45-0.181118-1.95910.02624
46-0.209539-2.26650.012629
470.2211222.39180.00918
480.5452135.89740
490.054190.58620.279451
50-0.208721-2.25770.012911
51-0.204006-2.20670.014645
52-0.104283-1.1280.130816
530.0074190.08020.46809
540.0554640.59990.274855
550.0345850.37410.354506
56-0.086118-0.93150.176756
57-0.156526-1.69310.046549
58-0.181308-1.96110.026119
590.1803481.95080.026738
600.4394144.7533e-06

\begin{tabular}{lllllllll}
\hline
Autocorrelation Function \tabularnewline
Time lag k & ACF(k) & T-STAT & P-value \tabularnewline
1 & 0.237743 & 2.5716 & 0.005688 \tabularnewline
2 & -0.310841 & -3.3623 & 0.000523 \tabularnewline
3 & -0.288981 & -3.1258 & 0.001118 \tabularnewline
4 & -0.142412 & -1.5404 & 0.063079 \tabularnewline
5 & 0.058181 & 0.6293 & 0.265183 \tabularnewline
6 & 0.084565 & 0.9147 & 0.181112 \tabularnewline
7 & 0.0692 & 0.7485 & 0.227826 \tabularnewline
8 & -0.146587 & -1.5856 & 0.057767 \tabularnewline
9 & -0.244455 & -2.6442 & 0.004656 \tabularnewline
10 & -0.292561 & -3.1645 & 0.00099 \tabularnewline
11 & 0.264565 & 2.8617 & 0.002497 \tabularnewline
12 & 0.834952 & 9.0314 & 0 \tabularnewline
13 & 0.196644 & 2.127 & 0.017759 \tabularnewline
14 & -0.277772 & -3.0046 & 0.001627 \tabularnewline
15 & -0.26083 & -2.8213 & 0.00281 \tabularnewline
16 & -0.146932 & -1.5893 & 0.057344 \tabularnewline
17 & 0.028412 & 0.3073 & 0.379574 \tabularnewline
18 & 0.070871 & 0.7666 & 0.222437 \tabularnewline
19 & 0.049943 & 0.5402 & 0.295037 \tabularnewline
20 & -0.140831 & -1.5233 & 0.065188 \tabularnewline
21 & -0.221642 & -2.3974 & 0.009047 \tabularnewline
22 & -0.260629 & -2.8191 & 0.002828 \tabularnewline
23 & 0.255693 & 2.7657 & 0.003301 \tabularnewline
24 & 0.706987 & 7.6472 & 0 \tabularnewline
25 & 0.141686 & 1.5326 & 0.064041 \tabularnewline
26 & -0.25861 & -2.7973 & 0.003014 \tabularnewline
27 & -0.235034 & -2.5423 & 0.00616 \tabularnewline
28 & -0.137625 & -1.4886 & 0.069636 \tabularnewline
29 & 0.022464 & 0.243 & 0.404221 \tabularnewline
30 & 0.039907 & 0.4317 & 0.333393 \tabularnewline
31 & 0.032287 & 0.3492 & 0.363768 \tabularnewline
32 & -0.132774 & -1.4362 & 0.076811 \tabularnewline
33 & -0.200924 & -2.1733 & 0.015885 \tabularnewline
34 & -0.245906 & -2.6599 & 0.004457 \tabularnewline
35 & 0.261489 & 2.8284 & 0.002753 \tabularnewline
36 & 0.647103 & 6.9995 & 0 \tabularnewline
37 & 0.087544 & 0.9469 & 0.172812 \tabularnewline
38 & -0.254277 & -2.7504 & 0.003449 \tabularnewline
39 & -0.22837 & -2.4702 & 0.007473 \tabularnewline
40 & -0.119049 & -1.2877 & 0.100194 \tabularnewline
41 & 0.019923 & 0.2155 & 0.414876 \tabularnewline
42 & 0.053177 & 0.5752 & 0.283131 \tabularnewline
43 & 0.029962 & 0.3241 & 0.373224 \tabularnewline
44 & -0.116088 & -1.2557 & 0.105866 \tabularnewline
45 & -0.181118 & -1.9591 & 0.02624 \tabularnewline
46 & -0.209539 & -2.2665 & 0.012629 \tabularnewline
47 & 0.221122 & 2.3918 & 0.00918 \tabularnewline
48 & 0.545213 & 5.8974 & 0 \tabularnewline
49 & 0.05419 & 0.5862 & 0.279451 \tabularnewline
50 & -0.208721 & -2.2577 & 0.012911 \tabularnewline
51 & -0.204006 & -2.2067 & 0.014645 \tabularnewline
52 & -0.104283 & -1.128 & 0.130816 \tabularnewline
53 & 0.007419 & 0.0802 & 0.46809 \tabularnewline
54 & 0.055464 & 0.5999 & 0.274855 \tabularnewline
55 & 0.034585 & 0.3741 & 0.354506 \tabularnewline
56 & -0.086118 & -0.9315 & 0.176756 \tabularnewline
57 & -0.156526 & -1.6931 & 0.046549 \tabularnewline
58 & -0.181308 & -1.9611 & 0.026119 \tabularnewline
59 & 0.180348 & 1.9508 & 0.026738 \tabularnewline
60 & 0.439414 & 4.753 & 3e-06 \tabularnewline
\hline
\end{tabular}
%Source: https://freestatistics.org/blog/index.php?pk=28801&T=1

[TABLE]
[ROW][C]Autocorrelation Function[/C][/ROW]
[ROW][C]Time lag k[/C][C]ACF(k)[/C][C]T-STAT[/C][C]P-value[/C][/ROW]
[ROW][C]1[/C][C]0.237743[/C][C]2.5716[/C][C]0.005688[/C][/ROW]
[ROW][C]2[/C][C]-0.310841[/C][C]-3.3623[/C][C]0.000523[/C][/ROW]
[ROW][C]3[/C][C]-0.288981[/C][C]-3.1258[/C][C]0.001118[/C][/ROW]
[ROW][C]4[/C][C]-0.142412[/C][C]-1.5404[/C][C]0.063079[/C][/ROW]
[ROW][C]5[/C][C]0.058181[/C][C]0.6293[/C][C]0.265183[/C][/ROW]
[ROW][C]6[/C][C]0.084565[/C][C]0.9147[/C][C]0.181112[/C][/ROW]
[ROW][C]7[/C][C]0.0692[/C][C]0.7485[/C][C]0.227826[/C][/ROW]
[ROW][C]8[/C][C]-0.146587[/C][C]-1.5856[/C][C]0.057767[/C][/ROW]
[ROW][C]9[/C][C]-0.244455[/C][C]-2.6442[/C][C]0.004656[/C][/ROW]
[ROW][C]10[/C][C]-0.292561[/C][C]-3.1645[/C][C]0.00099[/C][/ROW]
[ROW][C]11[/C][C]0.264565[/C][C]2.8617[/C][C]0.002497[/C][/ROW]
[ROW][C]12[/C][C]0.834952[/C][C]9.0314[/C][C]0[/C][/ROW]
[ROW][C]13[/C][C]0.196644[/C][C]2.127[/C][C]0.017759[/C][/ROW]
[ROW][C]14[/C][C]-0.277772[/C][C]-3.0046[/C][C]0.001627[/C][/ROW]
[ROW][C]15[/C][C]-0.26083[/C][C]-2.8213[/C][C]0.00281[/C][/ROW]
[ROW][C]16[/C][C]-0.146932[/C][C]-1.5893[/C][C]0.057344[/C][/ROW]
[ROW][C]17[/C][C]0.028412[/C][C]0.3073[/C][C]0.379574[/C][/ROW]
[ROW][C]18[/C][C]0.070871[/C][C]0.7666[/C][C]0.222437[/C][/ROW]
[ROW][C]19[/C][C]0.049943[/C][C]0.5402[/C][C]0.295037[/C][/ROW]
[ROW][C]20[/C][C]-0.140831[/C][C]-1.5233[/C][C]0.065188[/C][/ROW]
[ROW][C]21[/C][C]-0.221642[/C][C]-2.3974[/C][C]0.009047[/C][/ROW]
[ROW][C]22[/C][C]-0.260629[/C][C]-2.8191[/C][C]0.002828[/C][/ROW]
[ROW][C]23[/C][C]0.255693[/C][C]2.7657[/C][C]0.003301[/C][/ROW]
[ROW][C]24[/C][C]0.706987[/C][C]7.6472[/C][C]0[/C][/ROW]
[ROW][C]25[/C][C]0.141686[/C][C]1.5326[/C][C]0.064041[/C][/ROW]
[ROW][C]26[/C][C]-0.25861[/C][C]-2.7973[/C][C]0.003014[/C][/ROW]
[ROW][C]27[/C][C]-0.235034[/C][C]-2.5423[/C][C]0.00616[/C][/ROW]
[ROW][C]28[/C][C]-0.137625[/C][C]-1.4886[/C][C]0.069636[/C][/ROW]
[ROW][C]29[/C][C]0.022464[/C][C]0.243[/C][C]0.404221[/C][/ROW]
[ROW][C]30[/C][C]0.039907[/C][C]0.4317[/C][C]0.333393[/C][/ROW]
[ROW][C]31[/C][C]0.032287[/C][C]0.3492[/C][C]0.363768[/C][/ROW]
[ROW][C]32[/C][C]-0.132774[/C][C]-1.4362[/C][C]0.076811[/C][/ROW]
[ROW][C]33[/C][C]-0.200924[/C][C]-2.1733[/C][C]0.015885[/C][/ROW]
[ROW][C]34[/C][C]-0.245906[/C][C]-2.6599[/C][C]0.004457[/C][/ROW]
[ROW][C]35[/C][C]0.261489[/C][C]2.8284[/C][C]0.002753[/C][/ROW]
[ROW][C]36[/C][C]0.647103[/C][C]6.9995[/C][C]0[/C][/ROW]
[ROW][C]37[/C][C]0.087544[/C][C]0.9469[/C][C]0.172812[/C][/ROW]
[ROW][C]38[/C][C]-0.254277[/C][C]-2.7504[/C][C]0.003449[/C][/ROW]
[ROW][C]39[/C][C]-0.22837[/C][C]-2.4702[/C][C]0.007473[/C][/ROW]
[ROW][C]40[/C][C]-0.119049[/C][C]-1.2877[/C][C]0.100194[/C][/ROW]
[ROW][C]41[/C][C]0.019923[/C][C]0.2155[/C][C]0.414876[/C][/ROW]
[ROW][C]42[/C][C]0.053177[/C][C]0.5752[/C][C]0.283131[/C][/ROW]
[ROW][C]43[/C][C]0.029962[/C][C]0.3241[/C][C]0.373224[/C][/ROW]
[ROW][C]44[/C][C]-0.116088[/C][C]-1.2557[/C][C]0.105866[/C][/ROW]
[ROW][C]45[/C][C]-0.181118[/C][C]-1.9591[/C][C]0.02624[/C][/ROW]
[ROW][C]46[/C][C]-0.209539[/C][C]-2.2665[/C][C]0.012629[/C][/ROW]
[ROW][C]47[/C][C]0.221122[/C][C]2.3918[/C][C]0.00918[/C][/ROW]
[ROW][C]48[/C][C]0.545213[/C][C]5.8974[/C][C]0[/C][/ROW]
[ROW][C]49[/C][C]0.05419[/C][C]0.5862[/C][C]0.279451[/C][/ROW]
[ROW][C]50[/C][C]-0.208721[/C][C]-2.2577[/C][C]0.012911[/C][/ROW]
[ROW][C]51[/C][C]-0.204006[/C][C]-2.2067[/C][C]0.014645[/C][/ROW]
[ROW][C]52[/C][C]-0.104283[/C][C]-1.128[/C][C]0.130816[/C][/ROW]
[ROW][C]53[/C][C]0.007419[/C][C]0.0802[/C][C]0.46809[/C][/ROW]
[ROW][C]54[/C][C]0.055464[/C][C]0.5999[/C][C]0.274855[/C][/ROW]
[ROW][C]55[/C][C]0.034585[/C][C]0.3741[/C][C]0.354506[/C][/ROW]
[ROW][C]56[/C][C]-0.086118[/C][C]-0.9315[/C][C]0.176756[/C][/ROW]
[ROW][C]57[/C][C]-0.156526[/C][C]-1.6931[/C][C]0.046549[/C][/ROW]
[ROW][C]58[/C][C]-0.181308[/C][C]-1.9611[/C][C]0.026119[/C][/ROW]
[ROW][C]59[/C][C]0.180348[/C][C]1.9508[/C][C]0.026738[/C][/ROW]
[ROW][C]60[/C][C]0.439414[/C][C]4.753[/C][C]3e-06[/C][/ROW]
[/TABLE]
Source: https://freestatistics.org/blog/index.php?pk=28801&T=1

Globally Unique Identifier (entire table): ba.freestatistics.org/blog/index.php?pk=28801&T=1

As an alternative you can also use a QR Code:  

The GUIDs for individual cells are displayed in the table below:

Autocorrelation Function
Time lag kACF(k)T-STATP-value
10.2377432.57160.005688
2-0.310841-3.36230.000523
3-0.288981-3.12580.001118
4-0.142412-1.54040.063079
50.0581810.62930.265183
60.0845650.91470.181112
70.06920.74850.227826
8-0.146587-1.58560.057767
9-0.244455-2.64420.004656
10-0.292561-3.16450.00099
110.2645652.86170.002497
120.8349529.03140
130.1966442.1270.017759
14-0.277772-3.00460.001627
15-0.26083-2.82130.00281
16-0.146932-1.58930.057344
170.0284120.30730.379574
180.0708710.76660.222437
190.0499430.54020.295037
20-0.140831-1.52330.065188
21-0.221642-2.39740.009047
22-0.260629-2.81910.002828
230.2556932.76570.003301
240.7069877.64720
250.1416861.53260.064041
26-0.25861-2.79730.003014
27-0.235034-2.54230.00616
28-0.137625-1.48860.069636
290.0224640.2430.404221
300.0399070.43170.333393
310.0322870.34920.363768
32-0.132774-1.43620.076811
33-0.200924-2.17330.015885
34-0.245906-2.65990.004457
350.2614892.82840.002753
360.6471036.99950
370.0875440.94690.172812
38-0.254277-2.75040.003449
39-0.22837-2.47020.007473
40-0.119049-1.28770.100194
410.0199230.21550.414876
420.0531770.57520.283131
430.0299620.32410.373224
44-0.116088-1.25570.105866
45-0.181118-1.95910.02624
46-0.209539-2.26650.012629
470.2211222.39180.00918
480.5452135.89740
490.054190.58620.279451
50-0.208721-2.25770.012911
51-0.204006-2.20670.014645
52-0.104283-1.1280.130816
530.0074190.08020.46809
540.0554640.59990.274855
550.0345850.37410.354506
56-0.086118-0.93150.176756
57-0.156526-1.69310.046549
58-0.181308-1.96110.026119
590.1803481.95080.026738
600.4394144.7533e-06


Partial Autocorrelation Function
Time lag kPACF(k)T-STATP-value
10.2377432.57160.005688
2-0.38937-4.21172.5e-05
3-0.117106-1.26670.10389
4-0.178985-1.9360.027639
5-0.002286-0.02470.490156
6-0.083689-0.90520.1836
70.0342760.37080.355746
8-0.23998-2.59580.005323
9-0.167063-1.80710.036661
10-0.450692-4.8752e-06
110.3440133.72110.000153
120.6697727.24470
13-0.02148-0.23230.408339
140.1161411.25630.105763
150.1750051.8930.030416
16-0.079781-0.8630.194962
170.032570.35230.362625
18-0.092567-1.00130.159382
19-0.05746-0.62150.267731
20-0.083308-0.90110.18469
21-0.043648-0.47210.31886
22-0.076744-0.83010.204082
23-0.058026-0.62760.265731
24-0.03243-0.35080.363191
25-0.079878-0.8640.194674
26-0.095544-1.03350.151757
270.0084710.09160.463574
28-0.05882-0.63620.262932
290.0598860.64780.259203
30-0.121312-1.31220.096013
310.0524340.56720.285845
32-0.060292-0.65220.25779
33-0.003112-0.03370.4866
34-0.12602-1.36310.087733
350.0933031.00920.157474
360.0711620.76970.221504
37-0.026214-0.28360.388628
38-0.046526-0.50330.307866
390.0321080.34730.364496
40-0.098956-1.07040.143328
410.0393010.42510.335771
420.0014080.01520.493937
430.0539580.58360.28029
44-0.008585-0.09290.463086
450.0908520.98270.163888
460.0274190.29660.383657
47-0.179866-1.94560.027054
48-0.144204-1.55980.060753
49-0.045801-0.49540.310621
50-0.06114-0.66130.254849
51-0.045079-0.48760.31337
52-0.009999-0.10820.457028
53-0.041606-0.450.326758
54-0.055325-0.59840.275355
55-0.016009-0.17320.43141
560.0182240.19710.422039
57-0.056956-0.61610.269522
580.0326550.35320.362282
59-0.034574-0.3740.35455
60-0.044103-0.4770.31711

\begin{tabular}{lllllllll}
\hline
Partial Autocorrelation Function \tabularnewline
Time lag k & PACF(k) & T-STAT & P-value \tabularnewline
1 & 0.237743 & 2.5716 & 0.005688 \tabularnewline
2 & -0.38937 & -4.2117 & 2.5e-05 \tabularnewline
3 & -0.117106 & -1.2667 & 0.10389 \tabularnewline
4 & -0.178985 & -1.936 & 0.027639 \tabularnewline
5 & -0.002286 & -0.0247 & 0.490156 \tabularnewline
6 & -0.083689 & -0.9052 & 0.1836 \tabularnewline
7 & 0.034276 & 0.3708 & 0.355746 \tabularnewline
8 & -0.23998 & -2.5958 & 0.005323 \tabularnewline
9 & -0.167063 & -1.8071 & 0.036661 \tabularnewline
10 & -0.450692 & -4.875 & 2e-06 \tabularnewline
11 & 0.344013 & 3.7211 & 0.000153 \tabularnewline
12 & 0.669772 & 7.2447 & 0 \tabularnewline
13 & -0.02148 & -0.2323 & 0.408339 \tabularnewline
14 & 0.116141 & 1.2563 & 0.105763 \tabularnewline
15 & 0.175005 & 1.893 & 0.030416 \tabularnewline
16 & -0.079781 & -0.863 & 0.194962 \tabularnewline
17 & 0.03257 & 0.3523 & 0.362625 \tabularnewline
18 & -0.092567 & -1.0013 & 0.159382 \tabularnewline
19 & -0.05746 & -0.6215 & 0.267731 \tabularnewline
20 & -0.083308 & -0.9011 & 0.18469 \tabularnewline
21 & -0.043648 & -0.4721 & 0.31886 \tabularnewline
22 & -0.076744 & -0.8301 & 0.204082 \tabularnewline
23 & -0.058026 & -0.6276 & 0.265731 \tabularnewline
24 & -0.03243 & -0.3508 & 0.363191 \tabularnewline
25 & -0.079878 & -0.864 & 0.194674 \tabularnewline
26 & -0.095544 & -1.0335 & 0.151757 \tabularnewline
27 & 0.008471 & 0.0916 & 0.463574 \tabularnewline
28 & -0.05882 & -0.6362 & 0.262932 \tabularnewline
29 & 0.059886 & 0.6478 & 0.259203 \tabularnewline
30 & -0.121312 & -1.3122 & 0.096013 \tabularnewline
31 & 0.052434 & 0.5672 & 0.285845 \tabularnewline
32 & -0.060292 & -0.6522 & 0.25779 \tabularnewline
33 & -0.003112 & -0.0337 & 0.4866 \tabularnewline
34 & -0.12602 & -1.3631 & 0.087733 \tabularnewline
35 & 0.093303 & 1.0092 & 0.157474 \tabularnewline
36 & 0.071162 & 0.7697 & 0.221504 \tabularnewline
37 & -0.026214 & -0.2836 & 0.388628 \tabularnewline
38 & -0.046526 & -0.5033 & 0.307866 \tabularnewline
39 & 0.032108 & 0.3473 & 0.364496 \tabularnewline
40 & -0.098956 & -1.0704 & 0.143328 \tabularnewline
41 & 0.039301 & 0.4251 & 0.335771 \tabularnewline
42 & 0.001408 & 0.0152 & 0.493937 \tabularnewline
43 & 0.053958 & 0.5836 & 0.28029 \tabularnewline
44 & -0.008585 & -0.0929 & 0.463086 \tabularnewline
45 & 0.090852 & 0.9827 & 0.163888 \tabularnewline
46 & 0.027419 & 0.2966 & 0.383657 \tabularnewline
47 & -0.179866 & -1.9456 & 0.027054 \tabularnewline
48 & -0.144204 & -1.5598 & 0.060753 \tabularnewline
49 & -0.045801 & -0.4954 & 0.310621 \tabularnewline
50 & -0.06114 & -0.6613 & 0.254849 \tabularnewline
51 & -0.045079 & -0.4876 & 0.31337 \tabularnewline
52 & -0.009999 & -0.1082 & 0.457028 \tabularnewline
53 & -0.041606 & -0.45 & 0.326758 \tabularnewline
54 & -0.055325 & -0.5984 & 0.275355 \tabularnewline
55 & -0.016009 & -0.1732 & 0.43141 \tabularnewline
56 & 0.018224 & 0.1971 & 0.422039 \tabularnewline
57 & -0.056956 & -0.6161 & 0.269522 \tabularnewline
58 & 0.032655 & 0.3532 & 0.362282 \tabularnewline
59 & -0.034574 & -0.374 & 0.35455 \tabularnewline
60 & -0.044103 & -0.477 & 0.31711 \tabularnewline
\hline
\end{tabular}
%Source: https://freestatistics.org/blog/index.php?pk=28801&T=2

[TABLE]
[ROW][C]Partial Autocorrelation Function[/C][/ROW]
[ROW][C]Time lag k[/C][C]PACF(k)[/C][C]T-STAT[/C][C]P-value[/C][/ROW]
[ROW][C]1[/C][C]0.237743[/C][C]2.5716[/C][C]0.005688[/C][/ROW]
[ROW][C]2[/C][C]-0.38937[/C][C]-4.2117[/C][C]2.5e-05[/C][/ROW]
[ROW][C]3[/C][C]-0.117106[/C][C]-1.2667[/C][C]0.10389[/C][/ROW]
[ROW][C]4[/C][C]-0.178985[/C][C]-1.936[/C][C]0.027639[/C][/ROW]
[ROW][C]5[/C][C]-0.002286[/C][C]-0.0247[/C][C]0.490156[/C][/ROW]
[ROW][C]6[/C][C]-0.083689[/C][C]-0.9052[/C][C]0.1836[/C][/ROW]
[ROW][C]7[/C][C]0.034276[/C][C]0.3708[/C][C]0.355746[/C][/ROW]
[ROW][C]8[/C][C]-0.23998[/C][C]-2.5958[/C][C]0.005323[/C][/ROW]
[ROW][C]9[/C][C]-0.167063[/C][C]-1.8071[/C][C]0.036661[/C][/ROW]
[ROW][C]10[/C][C]-0.450692[/C][C]-4.875[/C][C]2e-06[/C][/ROW]
[ROW][C]11[/C][C]0.344013[/C][C]3.7211[/C][C]0.000153[/C][/ROW]
[ROW][C]12[/C][C]0.669772[/C][C]7.2447[/C][C]0[/C][/ROW]
[ROW][C]13[/C][C]-0.02148[/C][C]-0.2323[/C][C]0.408339[/C][/ROW]
[ROW][C]14[/C][C]0.116141[/C][C]1.2563[/C][C]0.105763[/C][/ROW]
[ROW][C]15[/C][C]0.175005[/C][C]1.893[/C][C]0.030416[/C][/ROW]
[ROW][C]16[/C][C]-0.079781[/C][C]-0.863[/C][C]0.194962[/C][/ROW]
[ROW][C]17[/C][C]0.03257[/C][C]0.3523[/C][C]0.362625[/C][/ROW]
[ROW][C]18[/C][C]-0.092567[/C][C]-1.0013[/C][C]0.159382[/C][/ROW]
[ROW][C]19[/C][C]-0.05746[/C][C]-0.6215[/C][C]0.267731[/C][/ROW]
[ROW][C]20[/C][C]-0.083308[/C][C]-0.9011[/C][C]0.18469[/C][/ROW]
[ROW][C]21[/C][C]-0.043648[/C][C]-0.4721[/C][C]0.31886[/C][/ROW]
[ROW][C]22[/C][C]-0.076744[/C][C]-0.8301[/C][C]0.204082[/C][/ROW]
[ROW][C]23[/C][C]-0.058026[/C][C]-0.6276[/C][C]0.265731[/C][/ROW]
[ROW][C]24[/C][C]-0.03243[/C][C]-0.3508[/C][C]0.363191[/C][/ROW]
[ROW][C]25[/C][C]-0.079878[/C][C]-0.864[/C][C]0.194674[/C][/ROW]
[ROW][C]26[/C][C]-0.095544[/C][C]-1.0335[/C][C]0.151757[/C][/ROW]
[ROW][C]27[/C][C]0.008471[/C][C]0.0916[/C][C]0.463574[/C][/ROW]
[ROW][C]28[/C][C]-0.05882[/C][C]-0.6362[/C][C]0.262932[/C][/ROW]
[ROW][C]29[/C][C]0.059886[/C][C]0.6478[/C][C]0.259203[/C][/ROW]
[ROW][C]30[/C][C]-0.121312[/C][C]-1.3122[/C][C]0.096013[/C][/ROW]
[ROW][C]31[/C][C]0.052434[/C][C]0.5672[/C][C]0.285845[/C][/ROW]
[ROW][C]32[/C][C]-0.060292[/C][C]-0.6522[/C][C]0.25779[/C][/ROW]
[ROW][C]33[/C][C]-0.003112[/C][C]-0.0337[/C][C]0.4866[/C][/ROW]
[ROW][C]34[/C][C]-0.12602[/C][C]-1.3631[/C][C]0.087733[/C][/ROW]
[ROW][C]35[/C][C]0.093303[/C][C]1.0092[/C][C]0.157474[/C][/ROW]
[ROW][C]36[/C][C]0.071162[/C][C]0.7697[/C][C]0.221504[/C][/ROW]
[ROW][C]37[/C][C]-0.026214[/C][C]-0.2836[/C][C]0.388628[/C][/ROW]
[ROW][C]38[/C][C]-0.046526[/C][C]-0.5033[/C][C]0.307866[/C][/ROW]
[ROW][C]39[/C][C]0.032108[/C][C]0.3473[/C][C]0.364496[/C][/ROW]
[ROW][C]40[/C][C]-0.098956[/C][C]-1.0704[/C][C]0.143328[/C][/ROW]
[ROW][C]41[/C][C]0.039301[/C][C]0.4251[/C][C]0.335771[/C][/ROW]
[ROW][C]42[/C][C]0.001408[/C][C]0.0152[/C][C]0.493937[/C][/ROW]
[ROW][C]43[/C][C]0.053958[/C][C]0.5836[/C][C]0.28029[/C][/ROW]
[ROW][C]44[/C][C]-0.008585[/C][C]-0.0929[/C][C]0.463086[/C][/ROW]
[ROW][C]45[/C][C]0.090852[/C][C]0.9827[/C][C]0.163888[/C][/ROW]
[ROW][C]46[/C][C]0.027419[/C][C]0.2966[/C][C]0.383657[/C][/ROW]
[ROW][C]47[/C][C]-0.179866[/C][C]-1.9456[/C][C]0.027054[/C][/ROW]
[ROW][C]48[/C][C]-0.144204[/C][C]-1.5598[/C][C]0.060753[/C][/ROW]
[ROW][C]49[/C][C]-0.045801[/C][C]-0.4954[/C][C]0.310621[/C][/ROW]
[ROW][C]50[/C][C]-0.06114[/C][C]-0.6613[/C][C]0.254849[/C][/ROW]
[ROW][C]51[/C][C]-0.045079[/C][C]-0.4876[/C][C]0.31337[/C][/ROW]
[ROW][C]52[/C][C]-0.009999[/C][C]-0.1082[/C][C]0.457028[/C][/ROW]
[ROW][C]53[/C][C]-0.041606[/C][C]-0.45[/C][C]0.326758[/C][/ROW]
[ROW][C]54[/C][C]-0.055325[/C][C]-0.5984[/C][C]0.275355[/C][/ROW]
[ROW][C]55[/C][C]-0.016009[/C][C]-0.1732[/C][C]0.43141[/C][/ROW]
[ROW][C]56[/C][C]0.018224[/C][C]0.1971[/C][C]0.422039[/C][/ROW]
[ROW][C]57[/C][C]-0.056956[/C][C]-0.6161[/C][C]0.269522[/C][/ROW]
[ROW][C]58[/C][C]0.032655[/C][C]0.3532[/C][C]0.362282[/C][/ROW]
[ROW][C]59[/C][C]-0.034574[/C][C]-0.374[/C][C]0.35455[/C][/ROW]
[ROW][C]60[/C][C]-0.044103[/C][C]-0.477[/C][C]0.31711[/C][/ROW]
[/TABLE]
Source: https://freestatistics.org/blog/index.php?pk=28801&T=2

Globally Unique Identifier (entire table): ba.freestatistics.org/blog/index.php?pk=28801&T=2

As an alternative you can also use a QR Code:  

The GUIDs for individual cells are displayed in the table below:

Partial Autocorrelation Function
Time lag kPACF(k)T-STATP-value
10.2377432.57160.005688
2-0.38937-4.21172.5e-05
3-0.117106-1.26670.10389
4-0.178985-1.9360.027639
5-0.002286-0.02470.490156
6-0.083689-0.90520.1836
70.0342760.37080.355746
8-0.23998-2.59580.005323
9-0.167063-1.80710.036661
10-0.450692-4.8752e-06
110.3440133.72110.000153
120.6697727.24470
13-0.02148-0.23230.408339
140.1161411.25630.105763
150.1750051.8930.030416
16-0.079781-0.8630.194962
170.032570.35230.362625
18-0.092567-1.00130.159382
19-0.05746-0.62150.267731
20-0.083308-0.90110.18469
21-0.043648-0.47210.31886
22-0.076744-0.83010.204082
23-0.058026-0.62760.265731
24-0.03243-0.35080.363191
25-0.079878-0.8640.194674
26-0.095544-1.03350.151757
270.0084710.09160.463574
28-0.05882-0.63620.262932
290.0598860.64780.259203
30-0.121312-1.31220.096013
310.0524340.56720.285845
32-0.060292-0.65220.25779
33-0.003112-0.03370.4866
34-0.12602-1.36310.087733
350.0933031.00920.157474
360.0711620.76970.221504
37-0.026214-0.28360.388628
38-0.046526-0.50330.307866
390.0321080.34730.364496
40-0.098956-1.07040.143328
410.0393010.42510.335771
420.0014080.01520.493937
430.0539580.58360.28029
44-0.008585-0.09290.463086
450.0908520.98270.163888
460.0274190.29660.383657
47-0.179866-1.94560.027054
48-0.144204-1.55980.060753
49-0.045801-0.49540.310621
50-0.06114-0.66130.254849
51-0.045079-0.48760.31337
52-0.009999-0.10820.457028
53-0.041606-0.450.326758
54-0.055325-0.59840.275355
55-0.016009-0.17320.43141
560.0182240.19710.422039
57-0.056956-0.61610.269522
580.0326550.35320.362282
59-0.034574-0.3740.35455
60-0.044103-0.4770.31711


Parameters (Session):
par1 = 60 ; par2 = 1 ; par3 = 1 ; par4 = 0 ; par5 = 12 ;
Parameters (R input):
par1 = 60 ; par2 = 1 ; par3 = 1 ; par4 = 0 ; par5 = 12 ;
R code (references can be found in the software module):
if (par1 == 'Default') {
par1 = 10*log10(length(x))
} else {
par1 <- as.numeric(par1)
}
par2 <- as.numeric(par2)
par3 <- as.numeric(par3)
par4 <- as.numeric(par4)
par5 <- as.numeric(par5)
if (par2 == 0) {
x <- log(x)
} else {
x <- (x ^ par2 - 1) / par2
}
if (par3 > 0) x <- diff(x,lag=1,difference=par3)
if (par4 > 0) x <- diff(x,lag=par5,difference=par4)
bitmap(file='pic1.png')
racf <- acf(x,par1,main='Autocorrelation',xlab='lags',ylab='ACF')
dev.off()
bitmap(file='pic2.png')
rpacf <- pacf(x,par1,main='Partial Autocorrelation',xlab='lags',ylab='PACF')
dev.off()
(myacf <- c(racf$acf))
(mypacf <- c(rpacf$acf))
lengthx <- length(x)
sqrtn <- sqrt(lengthx)
load(file='createtable')
a<-table.start()
a<-table.row.start(a)
a<-table.element(a,'Autocorrelation Function',4,TRUE)
a<-table.row.end(a)
a<-table.row.start(a)
a<-table.element(a,'Time lag k',header=TRUE)
a<-table.element(a,hyperlink('basics.htm','ACF(k)','click here for more information about the Autocorrelation Function'),header=TRUE)
a<-table.element(a,'T-STAT',header=TRUE)
a<-table.element(a,'P-value',header=TRUE)
a<-table.row.end(a)
for (i in 2:(par1+1)) {
a<-table.row.start(a)
a<-table.element(a,i-1,header=TRUE)
a<-table.element(a,round(myacf[i],6))
mytstat <- myacf[i]*sqrtn
a<-table.element(a,round(mytstat,4))
a<-table.element(a,round(1-pt(abs(mytstat),lengthx),6))
a<-table.row.end(a)
}
a<-table.end(a)
table.save(a,file='mytable.tab')
a<-table.start()
a<-table.row.start(a)
a<-table.element(a,'Partial Autocorrelation Function',4,TRUE)
a<-table.row.end(a)
a<-table.row.start(a)
a<-table.element(a,'Time lag k',header=TRUE)
a<-table.element(a,hyperlink('basics.htm','PACF(k)','click here for more information about the Partial Autocorrelation Function'),header=TRUE)
a<-table.element(a,'T-STAT',header=TRUE)
a<-table.element(a,'P-value',header=TRUE)
a<-table.row.end(a)
for (i in 1:par1) {
a<-table.row.start(a)
a<-table.element(a,i,header=TRUE)
a<-table.element(a,round(mypacf[i],6))
mytstat <- mypacf[i]*sqrtn
a<-table.element(a,round(mytstat,4))
a<-table.element(a,round(1-pt(abs(mytstat),lengthx),6))
a<-table.row.end(a)
}
a<-table.end(a)
table.save(a,file='mytable1.tab')