Free Statistics

of Irreproducible Research!

Author's title

Author*The author of this computation has been verified*
R Software Modulerwasp_autocorrelation.wasp
Title produced by software(Partial) Autocorrelation Function
Date of computationWed, 03 Dec 2008 08:45:52 -0700
Cite this page as followsStatistical Computations at FreeStatistics.org, Office for Research Development and Education, URL https://freestatistics.org/blog/index.php?v=date/2008/Dec/03/t1228319277qur7e1eu8nwoasg.htm/, Retrieved Sun, 19 May 2024 04:12:24 +0000
Statistical Computations at FreeStatistics.org, Office for Research Development and Education, URL https://freestatistics.org/blog/index.php?pk=28747, Retrieved Sun, 19 May 2024 04:12:24 +0000
QR Codes:

Original text written by user:
IsPrivate?No (this computation is public)
User-defined keywords
Estimated Impact217
Family? (F = Feedback message, R = changed R code, M = changed R Module, P = changed Parameters, D = changed Data)
-     [Univariate Data Series] [Uitvoer.Nederland] [2008-12-03 15:11:10] [988ab43f527fc78aae41c84649095267]
- RMP     [(Partial) Autocorrelation Function] [Partial AutoCorre...] [2008-12-03 15:45:52] [5d823194959040fa9b19b8c8302177e6] [Current]
Feedback Forum

Post a new message
Dataseries X:
2236
2084.9
2409.5
2199.3
2203.5
2254.1
1975.8
1742.2
2520.6
2438.1
2126.3
2267.5
2201.1
2128.5
2596
2458.2
2210.5
2621.2
2231.4
2103.6
2685.8
2539.3
2462.4
2693.3
2307.7
2385.9
2737.6
2653.9
2545.4
2848.8
2359.5
2488.3
2861.1
2717.9
2844
2749
2652.9
2660.2
3187.1
2774.1
3158.2
3244.6
2665.5
2820.8
2983.4
3077.4
3024.8
2731.8
3046.2
2834.8
3292.8
2946.1
3196.9
3284.2
3003
2979
3137.4
3630.2
3270.7
2942.3


Summary of computational transaction
Raw Inputview raw input (R code)
Raw Outputview raw output of R engine
Computing time2 seconds
R Server'Sir Ronald Aylmer Fisher' @ 193.190.124.24

\begin{tabular}{lllllllll}
\hline
Summary of computational transaction \tabularnewline
Raw Input & view raw input (R code)  \tabularnewline
Raw Output & view raw output of R engine  \tabularnewline
Computing time & 2 seconds \tabularnewline
R Server & 'Sir Ronald Aylmer Fisher' @ 193.190.124.24 \tabularnewline
\hline
\end{tabular}
%Source: https://freestatistics.org/blog/index.php?pk=28747&T=0

[TABLE]
[ROW][C]Summary of computational transaction[/C][/ROW]
[ROW][C]Raw Input[/C][C]view raw input (R code) [/C][/ROW]
[ROW][C]Raw Output[/C][C]view raw output of R engine [/C][/ROW]
[ROW][C]Computing time[/C][C]2 seconds[/C][/ROW]
[ROW][C]R Server[/C][C]'Sir Ronald Aylmer Fisher' @ 193.190.124.24[/C][/ROW]
[/TABLE]
Source: https://freestatistics.org/blog/index.php?pk=28747&T=0

Globally Unique Identifier (entire table): ba.freestatistics.org/blog/index.php?pk=28747&T=0

As an alternative you can also use a QR Code:  

The GUIDs for individual cells are displayed in the table below:

Summary of computational transaction
Raw Inputview raw input (R code)
Raw Outputview raw output of R engine
Computing time2 seconds
R Server'Sir Ronald Aylmer Fisher' @ 193.190.124.24


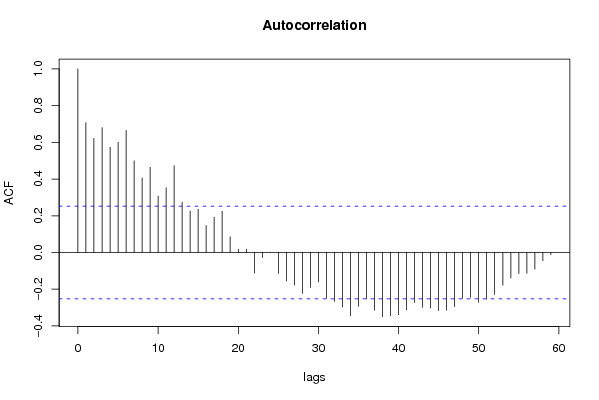
Autocorrelation Function
Time lag kACF(k)T-STATP-value
10.7066865.4740
20.6207844.80865e-06
30.6793095.26191e-06
40.5729784.43832e-05
50.6003324.65029e-06
60.6647175.14892e-06
70.4993743.86810.000136
80.405563.14150.001305
90.4643043.59650.000327
100.305992.37020.010505
110.3524862.73030.004147
120.4730283.66410.000264
130.2734782.11840.019148
140.2258091.74910.042693
150.2351011.82110.03679
160.1466261.13580.130286
170.1918131.48580.071286
180.2242091.73670.043785
190.0863280.66870.253129
200.0175340.13580.446209
210.0171550.13290.447367
22-0.111612-0.86450.195367
23-0.027879-0.2160.414878
240.0001760.00140.499458
25-0.114017-0.88320.190334
26-0.154784-1.1990.11763
27-0.177556-1.37530.087069
28-0.222162-1.72090.045215
29-0.191082-1.48010.072037
30-0.160391-1.24240.109464
31-0.248948-1.92830.029274
32-0.266305-2.06280.021734
33-0.297492-2.30440.01234
34-0.345319-2.67480.004811
35-0.292606-2.26650.013519
36-0.252628-1.95680.027512
37-0.315185-2.44140.008798
38-0.349659-2.70840.004398
39-0.344736-2.67030.004869
40-0.339496-2.62970.00542
41-0.31168-2.41430.009417
42-0.272018-2.1070.019651
43-0.298593-2.31290.012087
44-0.302947-2.34660.011132
45-0.315947-2.44730.008669
46-0.31459-2.43680.008901
47-0.294256-2.27930.01311
48-0.249004-1.92880.029247
49-0.244667-1.89520.031444
50-0.271292-2.10140.019906
51-0.254267-1.96950.026756
52-0.228384-1.76910.040984
53-0.178167-1.38010.086342
54-0.139488-1.08050.142129
55-0.115012-0.89090.188275
56-0.112843-0.87410.19278
57-0.090086-0.69780.243998
58-0.04567-0.35380.36238
59-0.013009-0.10080.460036
60NANANA

\begin{tabular}{lllllllll}
\hline
Autocorrelation Function \tabularnewline
Time lag k & ACF(k) & T-STAT & P-value \tabularnewline
1 & 0.706686 & 5.474 & 0 \tabularnewline
2 & 0.620784 & 4.8086 & 5e-06 \tabularnewline
3 & 0.679309 & 5.2619 & 1e-06 \tabularnewline
4 & 0.572978 & 4.4383 & 2e-05 \tabularnewline
5 & 0.600332 & 4.6502 & 9e-06 \tabularnewline
6 & 0.664717 & 5.1489 & 2e-06 \tabularnewline
7 & 0.499374 & 3.8681 & 0.000136 \tabularnewline
8 & 0.40556 & 3.1415 & 0.001305 \tabularnewline
9 & 0.464304 & 3.5965 & 0.000327 \tabularnewline
10 & 0.30599 & 2.3702 & 0.010505 \tabularnewline
11 & 0.352486 & 2.7303 & 0.004147 \tabularnewline
12 & 0.473028 & 3.6641 & 0.000264 \tabularnewline
13 & 0.273478 & 2.1184 & 0.019148 \tabularnewline
14 & 0.225809 & 1.7491 & 0.042693 \tabularnewline
15 & 0.235101 & 1.8211 & 0.03679 \tabularnewline
16 & 0.146626 & 1.1358 & 0.130286 \tabularnewline
17 & 0.191813 & 1.4858 & 0.071286 \tabularnewline
18 & 0.224209 & 1.7367 & 0.043785 \tabularnewline
19 & 0.086328 & 0.6687 & 0.253129 \tabularnewline
20 & 0.017534 & 0.1358 & 0.446209 \tabularnewline
21 & 0.017155 & 0.1329 & 0.447367 \tabularnewline
22 & -0.111612 & -0.8645 & 0.195367 \tabularnewline
23 & -0.027879 & -0.216 & 0.414878 \tabularnewline
24 & 0.000176 & 0.0014 & 0.499458 \tabularnewline
25 & -0.114017 & -0.8832 & 0.190334 \tabularnewline
26 & -0.154784 & -1.199 & 0.11763 \tabularnewline
27 & -0.177556 & -1.3753 & 0.087069 \tabularnewline
28 & -0.222162 & -1.7209 & 0.045215 \tabularnewline
29 & -0.191082 & -1.4801 & 0.072037 \tabularnewline
30 & -0.160391 & -1.2424 & 0.109464 \tabularnewline
31 & -0.248948 & -1.9283 & 0.029274 \tabularnewline
32 & -0.266305 & -2.0628 & 0.021734 \tabularnewline
33 & -0.297492 & -2.3044 & 0.01234 \tabularnewline
34 & -0.345319 & -2.6748 & 0.004811 \tabularnewline
35 & -0.292606 & -2.2665 & 0.013519 \tabularnewline
36 & -0.252628 & -1.9568 & 0.027512 \tabularnewline
37 & -0.315185 & -2.4414 & 0.008798 \tabularnewline
38 & -0.349659 & -2.7084 & 0.004398 \tabularnewline
39 & -0.344736 & -2.6703 & 0.004869 \tabularnewline
40 & -0.339496 & -2.6297 & 0.00542 \tabularnewline
41 & -0.31168 & -2.4143 & 0.009417 \tabularnewline
42 & -0.272018 & -2.107 & 0.019651 \tabularnewline
43 & -0.298593 & -2.3129 & 0.012087 \tabularnewline
44 & -0.302947 & -2.3466 & 0.011132 \tabularnewline
45 & -0.315947 & -2.4473 & 0.008669 \tabularnewline
46 & -0.31459 & -2.4368 & 0.008901 \tabularnewline
47 & -0.294256 & -2.2793 & 0.01311 \tabularnewline
48 & -0.249004 & -1.9288 & 0.029247 \tabularnewline
49 & -0.244667 & -1.8952 & 0.031444 \tabularnewline
50 & -0.271292 & -2.1014 & 0.019906 \tabularnewline
51 & -0.254267 & -1.9695 & 0.026756 \tabularnewline
52 & -0.228384 & -1.7691 & 0.040984 \tabularnewline
53 & -0.178167 & -1.3801 & 0.086342 \tabularnewline
54 & -0.139488 & -1.0805 & 0.142129 \tabularnewline
55 & -0.115012 & -0.8909 & 0.188275 \tabularnewline
56 & -0.112843 & -0.8741 & 0.19278 \tabularnewline
57 & -0.090086 & -0.6978 & 0.243998 \tabularnewline
58 & -0.04567 & -0.3538 & 0.36238 \tabularnewline
59 & -0.013009 & -0.1008 & 0.460036 \tabularnewline
60 & NA & NA & NA \tabularnewline
\hline
\end{tabular}
%Source: https://freestatistics.org/blog/index.php?pk=28747&T=1

[TABLE]
[ROW][C]Autocorrelation Function[/C][/ROW]
[ROW][C]Time lag k[/C][C]ACF(k)[/C][C]T-STAT[/C][C]P-value[/C][/ROW]
[ROW][C]1[/C][C]0.706686[/C][C]5.474[/C][C]0[/C][/ROW]
[ROW][C]2[/C][C]0.620784[/C][C]4.8086[/C][C]5e-06[/C][/ROW]
[ROW][C]3[/C][C]0.679309[/C][C]5.2619[/C][C]1e-06[/C][/ROW]
[ROW][C]4[/C][C]0.572978[/C][C]4.4383[/C][C]2e-05[/C][/ROW]
[ROW][C]5[/C][C]0.600332[/C][C]4.6502[/C][C]9e-06[/C][/ROW]
[ROW][C]6[/C][C]0.664717[/C][C]5.1489[/C][C]2e-06[/C][/ROW]
[ROW][C]7[/C][C]0.499374[/C][C]3.8681[/C][C]0.000136[/C][/ROW]
[ROW][C]8[/C][C]0.40556[/C][C]3.1415[/C][C]0.001305[/C][/ROW]
[ROW][C]9[/C][C]0.464304[/C][C]3.5965[/C][C]0.000327[/C][/ROW]
[ROW][C]10[/C][C]0.30599[/C][C]2.3702[/C][C]0.010505[/C][/ROW]
[ROW][C]11[/C][C]0.352486[/C][C]2.7303[/C][C]0.004147[/C][/ROW]
[ROW][C]12[/C][C]0.473028[/C][C]3.6641[/C][C]0.000264[/C][/ROW]
[ROW][C]13[/C][C]0.273478[/C][C]2.1184[/C][C]0.019148[/C][/ROW]
[ROW][C]14[/C][C]0.225809[/C][C]1.7491[/C][C]0.042693[/C][/ROW]
[ROW][C]15[/C][C]0.235101[/C][C]1.8211[/C][C]0.03679[/C][/ROW]
[ROW][C]16[/C][C]0.146626[/C][C]1.1358[/C][C]0.130286[/C][/ROW]
[ROW][C]17[/C][C]0.191813[/C][C]1.4858[/C][C]0.071286[/C][/ROW]
[ROW][C]18[/C][C]0.224209[/C][C]1.7367[/C][C]0.043785[/C][/ROW]
[ROW][C]19[/C][C]0.086328[/C][C]0.6687[/C][C]0.253129[/C][/ROW]
[ROW][C]20[/C][C]0.017534[/C][C]0.1358[/C][C]0.446209[/C][/ROW]
[ROW][C]21[/C][C]0.017155[/C][C]0.1329[/C][C]0.447367[/C][/ROW]
[ROW][C]22[/C][C]-0.111612[/C][C]-0.8645[/C][C]0.195367[/C][/ROW]
[ROW][C]23[/C][C]-0.027879[/C][C]-0.216[/C][C]0.414878[/C][/ROW]
[ROW][C]24[/C][C]0.000176[/C][C]0.0014[/C][C]0.499458[/C][/ROW]
[ROW][C]25[/C][C]-0.114017[/C][C]-0.8832[/C][C]0.190334[/C][/ROW]
[ROW][C]26[/C][C]-0.154784[/C][C]-1.199[/C][C]0.11763[/C][/ROW]
[ROW][C]27[/C][C]-0.177556[/C][C]-1.3753[/C][C]0.087069[/C][/ROW]
[ROW][C]28[/C][C]-0.222162[/C][C]-1.7209[/C][C]0.045215[/C][/ROW]
[ROW][C]29[/C][C]-0.191082[/C][C]-1.4801[/C][C]0.072037[/C][/ROW]
[ROW][C]30[/C][C]-0.160391[/C][C]-1.2424[/C][C]0.109464[/C][/ROW]
[ROW][C]31[/C][C]-0.248948[/C][C]-1.9283[/C][C]0.029274[/C][/ROW]
[ROW][C]32[/C][C]-0.266305[/C][C]-2.0628[/C][C]0.021734[/C][/ROW]
[ROW][C]33[/C][C]-0.297492[/C][C]-2.3044[/C][C]0.01234[/C][/ROW]
[ROW][C]34[/C][C]-0.345319[/C][C]-2.6748[/C][C]0.004811[/C][/ROW]
[ROW][C]35[/C][C]-0.292606[/C][C]-2.2665[/C][C]0.013519[/C][/ROW]
[ROW][C]36[/C][C]-0.252628[/C][C]-1.9568[/C][C]0.027512[/C][/ROW]
[ROW][C]37[/C][C]-0.315185[/C][C]-2.4414[/C][C]0.008798[/C][/ROW]
[ROW][C]38[/C][C]-0.349659[/C][C]-2.7084[/C][C]0.004398[/C][/ROW]
[ROW][C]39[/C][C]-0.344736[/C][C]-2.6703[/C][C]0.004869[/C][/ROW]
[ROW][C]40[/C][C]-0.339496[/C][C]-2.6297[/C][C]0.00542[/C][/ROW]
[ROW][C]41[/C][C]-0.31168[/C][C]-2.4143[/C][C]0.009417[/C][/ROW]
[ROW][C]42[/C][C]-0.272018[/C][C]-2.107[/C][C]0.019651[/C][/ROW]
[ROW][C]43[/C][C]-0.298593[/C][C]-2.3129[/C][C]0.012087[/C][/ROW]
[ROW][C]44[/C][C]-0.302947[/C][C]-2.3466[/C][C]0.011132[/C][/ROW]
[ROW][C]45[/C][C]-0.315947[/C][C]-2.4473[/C][C]0.008669[/C][/ROW]
[ROW][C]46[/C][C]-0.31459[/C][C]-2.4368[/C][C]0.008901[/C][/ROW]
[ROW][C]47[/C][C]-0.294256[/C][C]-2.2793[/C][C]0.01311[/C][/ROW]
[ROW][C]48[/C][C]-0.249004[/C][C]-1.9288[/C][C]0.029247[/C][/ROW]
[ROW][C]49[/C][C]-0.244667[/C][C]-1.8952[/C][C]0.031444[/C][/ROW]
[ROW][C]50[/C][C]-0.271292[/C][C]-2.1014[/C][C]0.019906[/C][/ROW]
[ROW][C]51[/C][C]-0.254267[/C][C]-1.9695[/C][C]0.026756[/C][/ROW]
[ROW][C]52[/C][C]-0.228384[/C][C]-1.7691[/C][C]0.040984[/C][/ROW]
[ROW][C]53[/C][C]-0.178167[/C][C]-1.3801[/C][C]0.086342[/C][/ROW]
[ROW][C]54[/C][C]-0.139488[/C][C]-1.0805[/C][C]0.142129[/C][/ROW]
[ROW][C]55[/C][C]-0.115012[/C][C]-0.8909[/C][C]0.188275[/C][/ROW]
[ROW][C]56[/C][C]-0.112843[/C][C]-0.8741[/C][C]0.19278[/C][/ROW]
[ROW][C]57[/C][C]-0.090086[/C][C]-0.6978[/C][C]0.243998[/C][/ROW]
[ROW][C]58[/C][C]-0.04567[/C][C]-0.3538[/C][C]0.36238[/C][/ROW]
[ROW][C]59[/C][C]-0.013009[/C][C]-0.1008[/C][C]0.460036[/C][/ROW]
[ROW][C]60[/C][C]NA[/C][C]NA[/C][C]NA[/C][/ROW]
[/TABLE]
Source: https://freestatistics.org/blog/index.php?pk=28747&T=1

Globally Unique Identifier (entire table): ba.freestatistics.org/blog/index.php?pk=28747&T=1

As an alternative you can also use a QR Code:  

The GUIDs for individual cells are displayed in the table below:

Autocorrelation Function
Time lag kACF(k)T-STATP-value
10.7066865.4740
20.6207844.80865e-06
30.6793095.26191e-06
40.5729784.43832e-05
50.6003324.65029e-06
60.6647175.14892e-06
70.4993743.86810.000136
80.405563.14150.001305
90.4643043.59650.000327
100.305992.37020.010505
110.3524862.73030.004147
120.4730283.66410.000264
130.2734782.11840.019148
140.2258091.74910.042693
150.2351011.82110.03679
160.1466261.13580.130286
170.1918131.48580.071286
180.2242091.73670.043785
190.0863280.66870.253129
200.0175340.13580.446209
210.0171550.13290.447367
22-0.111612-0.86450.195367
23-0.027879-0.2160.414878
240.0001760.00140.499458
25-0.114017-0.88320.190334
26-0.154784-1.1990.11763
27-0.177556-1.37530.087069
28-0.222162-1.72090.045215
29-0.191082-1.48010.072037
30-0.160391-1.24240.109464
31-0.248948-1.92830.029274
32-0.266305-2.06280.021734
33-0.297492-2.30440.01234
34-0.345319-2.67480.004811
35-0.292606-2.26650.013519
36-0.252628-1.95680.027512
37-0.315185-2.44140.008798
38-0.349659-2.70840.004398
39-0.344736-2.67030.004869
40-0.339496-2.62970.00542
41-0.31168-2.41430.009417
42-0.272018-2.1070.019651
43-0.298593-2.31290.012087
44-0.302947-2.34660.011132
45-0.315947-2.44730.008669
46-0.31459-2.43680.008901
47-0.294256-2.27930.01311
48-0.249004-1.92880.029247
49-0.244667-1.89520.031444
50-0.271292-2.10140.019906
51-0.254267-1.96950.026756
52-0.228384-1.76910.040984
53-0.178167-1.38010.086342
54-0.139488-1.08050.142129
55-0.115012-0.89090.188275
56-0.112843-0.87410.19278
57-0.090086-0.69780.243998
58-0.04567-0.35380.36238
59-0.013009-0.10080.460036
60NANANA


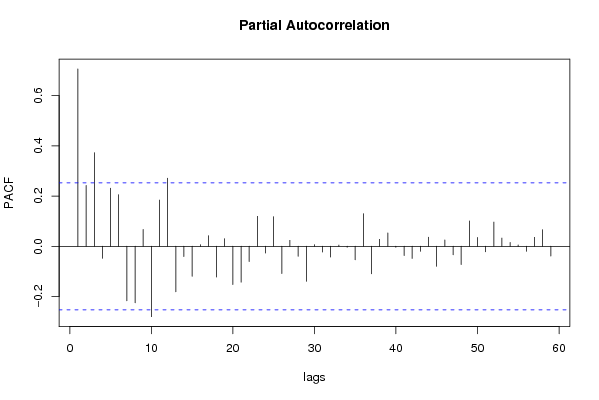
Partial Autocorrelation Function
Time lag kPACF(k)T-STATP-value
10.7066865.4740
20.2424691.87820.032611
30.3727612.88740.002697
4-0.047697-0.36950.356544
50.2316861.79460.038875
60.2054641.59150.058375
7-0.217149-1.6820.048881
8-0.224797-1.74130.043381
90.0673360.52160.301942
10-0.280246-2.17080.016958
110.1841691.42660.079444
120.2715252.10320.019824
13-0.181048-1.40240.082975
14-0.040787-0.31590.376575
15-0.119554-0.92610.179062
160.0061840.04790.480978
170.0424840.32910.371621
18-0.122038-0.94530.174149
190.0302040.2340.407906
20-0.152528-1.18150.121038
21-0.142893-1.10680.13639
22-0.060293-0.4670.321087
230.1193420.92440.179486
24-0.027124-0.21010.417149
250.1178650.9130.182455
26-0.108134-0.83760.202789
270.0237280.18380.427397
28-0.039415-0.30530.380593
29-0.139629-1.08160.141887
300.0063340.04910.480517
31-0.023088-0.17880.429335
32-0.042398-0.32840.37187
330.0048710.03770.485015
34-0.003789-0.02930.488343
35-0.053509-0.41450.340002
360.1299251.00640.159133
37-0.109445-0.84780.199972
380.0277230.21470.41535
390.0528280.40920.341925
40-0.003718-0.02880.488561
41-0.03639-0.28190.389504
42-0.048055-0.37220.355515
43-0.019979-0.15480.438765
440.0363550.28160.389607
45-0.079674-0.61710.269736
460.0251690.1950.423043
47-0.033459-0.25920.398193
48-0.072582-0.56220.288031
490.1010110.78240.21852
500.0350650.27160.393425
51-0.021886-0.16950.432977
520.0964530.74710.228954
530.0328080.25410.400133
540.0153160.11860.452981
550.0056450.04370.482633
56-0.01965-0.15220.439766
570.0358370.27760.39114
580.0657740.50950.30614
59-0.038768-0.30030.382495
60NANANA

\begin{tabular}{lllllllll}
\hline
Partial Autocorrelation Function \tabularnewline
Time lag k & PACF(k) & T-STAT & P-value \tabularnewline
1 & 0.706686 & 5.474 & 0 \tabularnewline
2 & 0.242469 & 1.8782 & 0.032611 \tabularnewline
3 & 0.372761 & 2.8874 & 0.002697 \tabularnewline
4 & -0.047697 & -0.3695 & 0.356544 \tabularnewline
5 & 0.231686 & 1.7946 & 0.038875 \tabularnewline
6 & 0.205464 & 1.5915 & 0.058375 \tabularnewline
7 & -0.217149 & -1.682 & 0.048881 \tabularnewline
8 & -0.224797 & -1.7413 & 0.043381 \tabularnewline
9 & 0.067336 & 0.5216 & 0.301942 \tabularnewline
10 & -0.280246 & -2.1708 & 0.016958 \tabularnewline
11 & 0.184169 & 1.4266 & 0.079444 \tabularnewline
12 & 0.271525 & 2.1032 & 0.019824 \tabularnewline
13 & -0.181048 & -1.4024 & 0.082975 \tabularnewline
14 & -0.040787 & -0.3159 & 0.376575 \tabularnewline
15 & -0.119554 & -0.9261 & 0.179062 \tabularnewline
16 & 0.006184 & 0.0479 & 0.480978 \tabularnewline
17 & 0.042484 & 0.3291 & 0.371621 \tabularnewline
18 & -0.122038 & -0.9453 & 0.174149 \tabularnewline
19 & 0.030204 & 0.234 & 0.407906 \tabularnewline
20 & -0.152528 & -1.1815 & 0.121038 \tabularnewline
21 & -0.142893 & -1.1068 & 0.13639 \tabularnewline
22 & -0.060293 & -0.467 & 0.321087 \tabularnewline
23 & 0.119342 & 0.9244 & 0.179486 \tabularnewline
24 & -0.027124 & -0.2101 & 0.417149 \tabularnewline
25 & 0.117865 & 0.913 & 0.182455 \tabularnewline
26 & -0.108134 & -0.8376 & 0.202789 \tabularnewline
27 & 0.023728 & 0.1838 & 0.427397 \tabularnewline
28 & -0.039415 & -0.3053 & 0.380593 \tabularnewline
29 & -0.139629 & -1.0816 & 0.141887 \tabularnewline
30 & 0.006334 & 0.0491 & 0.480517 \tabularnewline
31 & -0.023088 & -0.1788 & 0.429335 \tabularnewline
32 & -0.042398 & -0.3284 & 0.37187 \tabularnewline
33 & 0.004871 & 0.0377 & 0.485015 \tabularnewline
34 & -0.003789 & -0.0293 & 0.488343 \tabularnewline
35 & -0.053509 & -0.4145 & 0.340002 \tabularnewline
36 & 0.129925 & 1.0064 & 0.159133 \tabularnewline
37 & -0.109445 & -0.8478 & 0.199972 \tabularnewline
38 & 0.027723 & 0.2147 & 0.41535 \tabularnewline
39 & 0.052828 & 0.4092 & 0.341925 \tabularnewline
40 & -0.003718 & -0.0288 & 0.488561 \tabularnewline
41 & -0.03639 & -0.2819 & 0.389504 \tabularnewline
42 & -0.048055 & -0.3722 & 0.355515 \tabularnewline
43 & -0.019979 & -0.1548 & 0.438765 \tabularnewline
44 & 0.036355 & 0.2816 & 0.389607 \tabularnewline
45 & -0.079674 & -0.6171 & 0.269736 \tabularnewline
46 & 0.025169 & 0.195 & 0.423043 \tabularnewline
47 & -0.033459 & -0.2592 & 0.398193 \tabularnewline
48 & -0.072582 & -0.5622 & 0.288031 \tabularnewline
49 & 0.101011 & 0.7824 & 0.21852 \tabularnewline
50 & 0.035065 & 0.2716 & 0.393425 \tabularnewline
51 & -0.021886 & -0.1695 & 0.432977 \tabularnewline
52 & 0.096453 & 0.7471 & 0.228954 \tabularnewline
53 & 0.032808 & 0.2541 & 0.400133 \tabularnewline
54 & 0.015316 & 0.1186 & 0.452981 \tabularnewline
55 & 0.005645 & 0.0437 & 0.482633 \tabularnewline
56 & -0.01965 & -0.1522 & 0.439766 \tabularnewline
57 & 0.035837 & 0.2776 & 0.39114 \tabularnewline
58 & 0.065774 & 0.5095 & 0.30614 \tabularnewline
59 & -0.038768 & -0.3003 & 0.382495 \tabularnewline
60 & NA & NA & NA \tabularnewline
\hline
\end{tabular}
%Source: https://freestatistics.org/blog/index.php?pk=28747&T=2

[TABLE]
[ROW][C]Partial Autocorrelation Function[/C][/ROW]
[ROW][C]Time lag k[/C][C]PACF(k)[/C][C]T-STAT[/C][C]P-value[/C][/ROW]
[ROW][C]1[/C][C]0.706686[/C][C]5.474[/C][C]0[/C][/ROW]
[ROW][C]2[/C][C]0.242469[/C][C]1.8782[/C][C]0.032611[/C][/ROW]
[ROW][C]3[/C][C]0.372761[/C][C]2.8874[/C][C]0.002697[/C][/ROW]
[ROW][C]4[/C][C]-0.047697[/C][C]-0.3695[/C][C]0.356544[/C][/ROW]
[ROW][C]5[/C][C]0.231686[/C][C]1.7946[/C][C]0.038875[/C][/ROW]
[ROW][C]6[/C][C]0.205464[/C][C]1.5915[/C][C]0.058375[/C][/ROW]
[ROW][C]7[/C][C]-0.217149[/C][C]-1.682[/C][C]0.048881[/C][/ROW]
[ROW][C]8[/C][C]-0.224797[/C][C]-1.7413[/C][C]0.043381[/C][/ROW]
[ROW][C]9[/C][C]0.067336[/C][C]0.5216[/C][C]0.301942[/C][/ROW]
[ROW][C]10[/C][C]-0.280246[/C][C]-2.1708[/C][C]0.016958[/C][/ROW]
[ROW][C]11[/C][C]0.184169[/C][C]1.4266[/C][C]0.079444[/C][/ROW]
[ROW][C]12[/C][C]0.271525[/C][C]2.1032[/C][C]0.019824[/C][/ROW]
[ROW][C]13[/C][C]-0.181048[/C][C]-1.4024[/C][C]0.082975[/C][/ROW]
[ROW][C]14[/C][C]-0.040787[/C][C]-0.3159[/C][C]0.376575[/C][/ROW]
[ROW][C]15[/C][C]-0.119554[/C][C]-0.9261[/C][C]0.179062[/C][/ROW]
[ROW][C]16[/C][C]0.006184[/C][C]0.0479[/C][C]0.480978[/C][/ROW]
[ROW][C]17[/C][C]0.042484[/C][C]0.3291[/C][C]0.371621[/C][/ROW]
[ROW][C]18[/C][C]-0.122038[/C][C]-0.9453[/C][C]0.174149[/C][/ROW]
[ROW][C]19[/C][C]0.030204[/C][C]0.234[/C][C]0.407906[/C][/ROW]
[ROW][C]20[/C][C]-0.152528[/C][C]-1.1815[/C][C]0.121038[/C][/ROW]
[ROW][C]21[/C][C]-0.142893[/C][C]-1.1068[/C][C]0.13639[/C][/ROW]
[ROW][C]22[/C][C]-0.060293[/C][C]-0.467[/C][C]0.321087[/C][/ROW]
[ROW][C]23[/C][C]0.119342[/C][C]0.9244[/C][C]0.179486[/C][/ROW]
[ROW][C]24[/C][C]-0.027124[/C][C]-0.2101[/C][C]0.417149[/C][/ROW]
[ROW][C]25[/C][C]0.117865[/C][C]0.913[/C][C]0.182455[/C][/ROW]
[ROW][C]26[/C][C]-0.108134[/C][C]-0.8376[/C][C]0.202789[/C][/ROW]
[ROW][C]27[/C][C]0.023728[/C][C]0.1838[/C][C]0.427397[/C][/ROW]
[ROW][C]28[/C][C]-0.039415[/C][C]-0.3053[/C][C]0.380593[/C][/ROW]
[ROW][C]29[/C][C]-0.139629[/C][C]-1.0816[/C][C]0.141887[/C][/ROW]
[ROW][C]30[/C][C]0.006334[/C][C]0.0491[/C][C]0.480517[/C][/ROW]
[ROW][C]31[/C][C]-0.023088[/C][C]-0.1788[/C][C]0.429335[/C][/ROW]
[ROW][C]32[/C][C]-0.042398[/C][C]-0.3284[/C][C]0.37187[/C][/ROW]
[ROW][C]33[/C][C]0.004871[/C][C]0.0377[/C][C]0.485015[/C][/ROW]
[ROW][C]34[/C][C]-0.003789[/C][C]-0.0293[/C][C]0.488343[/C][/ROW]
[ROW][C]35[/C][C]-0.053509[/C][C]-0.4145[/C][C]0.340002[/C][/ROW]
[ROW][C]36[/C][C]0.129925[/C][C]1.0064[/C][C]0.159133[/C][/ROW]
[ROW][C]37[/C][C]-0.109445[/C][C]-0.8478[/C][C]0.199972[/C][/ROW]
[ROW][C]38[/C][C]0.027723[/C][C]0.2147[/C][C]0.41535[/C][/ROW]
[ROW][C]39[/C][C]0.052828[/C][C]0.4092[/C][C]0.341925[/C][/ROW]
[ROW][C]40[/C][C]-0.003718[/C][C]-0.0288[/C][C]0.488561[/C][/ROW]
[ROW][C]41[/C][C]-0.03639[/C][C]-0.2819[/C][C]0.389504[/C][/ROW]
[ROW][C]42[/C][C]-0.048055[/C][C]-0.3722[/C][C]0.355515[/C][/ROW]
[ROW][C]43[/C][C]-0.019979[/C][C]-0.1548[/C][C]0.438765[/C][/ROW]
[ROW][C]44[/C][C]0.036355[/C][C]0.2816[/C][C]0.389607[/C][/ROW]
[ROW][C]45[/C][C]-0.079674[/C][C]-0.6171[/C][C]0.269736[/C][/ROW]
[ROW][C]46[/C][C]0.025169[/C][C]0.195[/C][C]0.423043[/C][/ROW]
[ROW][C]47[/C][C]-0.033459[/C][C]-0.2592[/C][C]0.398193[/C][/ROW]
[ROW][C]48[/C][C]-0.072582[/C][C]-0.5622[/C][C]0.288031[/C][/ROW]
[ROW][C]49[/C][C]0.101011[/C][C]0.7824[/C][C]0.21852[/C][/ROW]
[ROW][C]50[/C][C]0.035065[/C][C]0.2716[/C][C]0.393425[/C][/ROW]
[ROW][C]51[/C][C]-0.021886[/C][C]-0.1695[/C][C]0.432977[/C][/ROW]
[ROW][C]52[/C][C]0.096453[/C][C]0.7471[/C][C]0.228954[/C][/ROW]
[ROW][C]53[/C][C]0.032808[/C][C]0.2541[/C][C]0.400133[/C][/ROW]
[ROW][C]54[/C][C]0.015316[/C][C]0.1186[/C][C]0.452981[/C][/ROW]
[ROW][C]55[/C][C]0.005645[/C][C]0.0437[/C][C]0.482633[/C][/ROW]
[ROW][C]56[/C][C]-0.01965[/C][C]-0.1522[/C][C]0.439766[/C][/ROW]
[ROW][C]57[/C][C]0.035837[/C][C]0.2776[/C][C]0.39114[/C][/ROW]
[ROW][C]58[/C][C]0.065774[/C][C]0.5095[/C][C]0.30614[/C][/ROW]
[ROW][C]59[/C][C]-0.038768[/C][C]-0.3003[/C][C]0.382495[/C][/ROW]
[ROW][C]60[/C][C]NA[/C][C]NA[/C][C]NA[/C][/ROW]
[/TABLE]
Source: https://freestatistics.org/blog/index.php?pk=28747&T=2

Globally Unique Identifier (entire table): ba.freestatistics.org/blog/index.php?pk=28747&T=2

As an alternative you can also use a QR Code:  

The GUIDs for individual cells are displayed in the table below:

Partial Autocorrelation Function
Time lag kPACF(k)T-STATP-value
10.7066865.4740
20.2424691.87820.032611
30.3727612.88740.002697
4-0.047697-0.36950.356544
50.2316861.79460.038875
60.2054641.59150.058375
7-0.217149-1.6820.048881
8-0.224797-1.74130.043381
90.0673360.52160.301942
10-0.280246-2.17080.016958
110.1841691.42660.079444
120.2715252.10320.019824
13-0.181048-1.40240.082975
14-0.040787-0.31590.376575
15-0.119554-0.92610.179062
160.0061840.04790.480978
170.0424840.32910.371621
18-0.122038-0.94530.174149
190.0302040.2340.407906
20-0.152528-1.18150.121038
21-0.142893-1.10680.13639
22-0.060293-0.4670.321087
230.1193420.92440.179486
24-0.027124-0.21010.417149
250.1178650.9130.182455
26-0.108134-0.83760.202789
270.0237280.18380.427397
28-0.039415-0.30530.380593
29-0.139629-1.08160.141887
300.0063340.04910.480517
31-0.023088-0.17880.429335
32-0.042398-0.32840.37187
330.0048710.03770.485015
34-0.003789-0.02930.488343
35-0.053509-0.41450.340002
360.1299251.00640.159133
37-0.109445-0.84780.199972
380.0277230.21470.41535
390.0528280.40920.341925
40-0.003718-0.02880.488561
41-0.03639-0.28190.389504
42-0.048055-0.37220.355515
43-0.019979-0.15480.438765
440.0363550.28160.389607
45-0.079674-0.61710.269736
460.0251690.1950.423043
47-0.033459-0.25920.398193
48-0.072582-0.56220.288031
490.1010110.78240.21852
500.0350650.27160.393425
51-0.021886-0.16950.432977
520.0964530.74710.228954
530.0328080.25410.400133
540.0153160.11860.452981
550.0056450.04370.482633
56-0.01965-0.15220.439766
570.0358370.27760.39114
580.0657740.50950.30614
59-0.038768-0.30030.382495
60NANANA


Parameters (Session):
par1 = 60 ; par2 = 1 ; par3 = 0 ; par4 = 0 ; par5 = 12 ;
Parameters (R input):
par1 = 60 ; par2 = 1 ; par3 = 0 ; par4 = 0 ; par5 = 12 ;
R code (references can be found in the software module):
if (par1 == 'Default') {
par1 = 10*log10(length(x))
} else {
par1 <- as.numeric(par1)
}
par2 <- as.numeric(par2)
par3 <- as.numeric(par3)
par4 <- as.numeric(par4)
par5 <- as.numeric(par5)
if (par2 == 0) {
x <- log(x)
} else {
x <- (x ^ par2 - 1) / par2
}
if (par3 > 0) x <- diff(x,lag=1,difference=par3)
if (par4 > 0) x <- diff(x,lag=par5,difference=par4)
bitmap(file='pic1.png')
racf <- acf(x,par1,main='Autocorrelation',xlab='lags',ylab='ACF')
dev.off()
bitmap(file='pic2.png')
rpacf <- pacf(x,par1,main='Partial Autocorrelation',xlab='lags',ylab='PACF')
dev.off()
(myacf <- c(racf$acf))
(mypacf <- c(rpacf$acf))
lengthx <- length(x)
sqrtn <- sqrt(lengthx)
load(file='createtable')
a<-table.start()
a<-table.row.start(a)
a<-table.element(a,'Autocorrelation Function',4,TRUE)
a<-table.row.end(a)
a<-table.row.start(a)
a<-table.element(a,'Time lag k',header=TRUE)
a<-table.element(a,hyperlink('basics.htm','ACF(k)','click here for more information about the Autocorrelation Function'),header=TRUE)
a<-table.element(a,'T-STAT',header=TRUE)
a<-table.element(a,'P-value',header=TRUE)
a<-table.row.end(a)
for (i in 2:(par1+1)) {
a<-table.row.start(a)
a<-table.element(a,i-1,header=TRUE)
a<-table.element(a,round(myacf[i],6))
mytstat <- myacf[i]*sqrtn
a<-table.element(a,round(mytstat,4))
a<-table.element(a,round(1-pt(abs(mytstat),lengthx),6))
a<-table.row.end(a)
}
a<-table.end(a)
table.save(a,file='mytable.tab')
a<-table.start()
a<-table.row.start(a)
a<-table.element(a,'Partial Autocorrelation Function',4,TRUE)
a<-table.row.end(a)
a<-table.row.start(a)
a<-table.element(a,'Time lag k',header=TRUE)
a<-table.element(a,hyperlink('basics.htm','PACF(k)','click here for more information about the Partial Autocorrelation Function'),header=TRUE)
a<-table.element(a,'T-STAT',header=TRUE)
a<-table.element(a,'P-value',header=TRUE)
a<-table.row.end(a)
for (i in 1:par1) {
a<-table.row.start(a)
a<-table.element(a,i,header=TRUE)
a<-table.element(a,round(mypacf[i],6))
mytstat <- mypacf[i]*sqrtn
a<-table.element(a,round(mytstat,4))
a<-table.element(a,round(1-pt(abs(mytstat),lengthx),6))
a<-table.row.end(a)
}
a<-table.end(a)
table.save(a,file='mytable1.tab')