Free Statistics

of Irreproducible Research!

Author's title

Author*Unverified author*
R Software Modulerwasp_autocorrelation.wasp
Title produced by software(Partial) Autocorrelation Function
Date of computationWed, 03 Dec 2008 08:17:29 -0700
Cite this page as followsStatistical Computations at FreeStatistics.org, Office for Research Development and Education, URL https://freestatistics.org/blog/index.php?v=date/2008/Dec/03/t122831754603bmz2idy0if7ea.htm/, Retrieved Sun, 19 May 2024 04:40:31 +0000
Statistical Computations at FreeStatistics.org, Office for Research Development and Education, URL https://freestatistics.org/blog/index.php?pk=28731, Retrieved Sun, 19 May 2024 04:40:31 +0000
QR Codes:

Original text written by user:
IsPrivate?No (this computation is public)
User-defined keywords
Estimated Impact176
Family? (F = Feedback message, R = changed R code, M = changed R Module, P = changed Parameters, D = changed Data)
F     [Standard Deviation-Mean Plot] [paper standart de...] [2008-12-03 13:08:33] [f58cc3b532da25682c394745f1a82535]
- RMPD  [(Partial) Autocorrelation Function] [paper autocorrela...] [2008-12-03 15:01:26] [f58cc3b532da25682c394745f1a82535]
-    D      [(Partial) Autocorrelation Function] [paper autocorrela...] [2008-12-03 15:17:29] [b09437381d488816ab9f5cf07e347c02] [Current]
Feedback Forum

Post a new message
Dataseries X:
97.6
96
115.9
109.1
117.3
109.8
112.8
110.7
100
113.3
122.4
112.5
104.2
92.5
117.2
109.3
106.1
118.8
105.3
106
102
112.9
116.5
114.8
100.5
85.4
114.6
109.9
100.7
115.5
100.7
99
102.3
108.8
105.9
113.2
95.7
80.9
113.9
98.1
102.8
104.7
95.9
94.6
101.6
103.9
110.3
114.1
96.8
87.4
111.4
97.4
102.9
112.7
97
95.1
96.9
98.6
111.7
109.8
89.9
87.4
104.5
98.1
102.7
105.4
97
97.4
92
101.7
112.6
106.9
92.1
86
104.7
102
103.1
106
96.1
96.2
90.7
102.3


Summary of computational transaction
Raw Inputview raw input (R code)
Raw Outputview raw output of R engine
Computing time1 seconds
R Server'George Udny Yule' @ 72.249.76.132

\begin{tabular}{lllllllll}
\hline
Summary of computational transaction \tabularnewline
Raw Input & view raw input (R code)  \tabularnewline
Raw Output & view raw output of R engine  \tabularnewline
Computing time & 1 seconds \tabularnewline
R Server & 'George Udny Yule' @ 72.249.76.132 \tabularnewline
\hline
\end{tabular}
%Source: https://freestatistics.org/blog/index.php?pk=28731&T=0

[TABLE]
[ROW][C]Summary of computational transaction[/C][/ROW]
[ROW][C]Raw Input[/C][C]view raw input (R code) [/C][/ROW]
[ROW][C]Raw Output[/C][C]view raw output of R engine [/C][/ROW]
[ROW][C]Computing time[/C][C]1 seconds[/C][/ROW]
[ROW][C]R Server[/C][C]'George Udny Yule' @ 72.249.76.132[/C][/ROW]
[/TABLE]
Source: https://freestatistics.org/blog/index.php?pk=28731&T=0

Globally Unique Identifier (entire table): ba.freestatistics.org/blog/index.php?pk=28731&T=0

As an alternative you can also use a QR Code:  

The GUIDs for individual cells are displayed in the table below:

Summary of computational transaction
Raw Inputview raw input (R code)
Raw Outputview raw output of R engine
Computing time1 seconds
R Server'George Udny Yule' @ 72.249.76.132


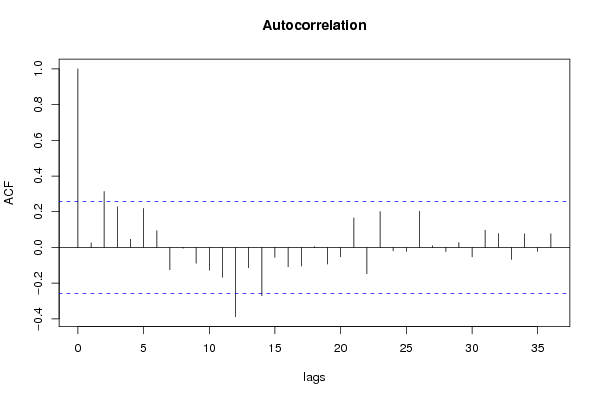
Autocorrelation Function
Time lag kACF(k)T-STATP-value
10.0250270.19060.424751
20.3126572.38110.010282
30.2274041.73190.044307
40.04550.34650.365103
50.2180071.66030.051126
60.0934310.71160.239797
7-0.125264-0.9540.172025
8-0.004298-0.03270.487001
9-0.088919-0.67720.25049
10-0.127888-0.9740.167059
11-0.166685-1.26940.104678
12-0.388198-2.95640.002247
13-0.11359-0.86510.195281
14-0.271075-2.06440.021729
15-0.055352-0.42160.337455
16-0.108054-0.82290.206963
17-0.103923-0.79150.215951
180.0047940.03650.4855
19-0.093455-0.71170.239741
20-0.05275-0.40170.34468
210.1647431.25460.107321
22-0.147905-1.12640.132315
230.200991.53070.065641
24-0.019435-0.1480.441422
25-0.022125-0.16850.433388
260.2027951.54440.06396
270.0086790.06610.473764
28-0.023434-0.17850.429489
290.0268980.20480.419204
30-0.052946-0.40320.344133
310.0961790.73250.233413
320.0772940.58870.27919
33-0.067421-0.51350.304789
340.0762460.58070.281855
35-0.021758-0.16570.434483
360.0762270.58050.281905

\begin{tabular}{lllllllll}
\hline
Autocorrelation Function \tabularnewline
Time lag k & ACF(k) & T-STAT & P-value \tabularnewline
1 & 0.025027 & 0.1906 & 0.424751 \tabularnewline
2 & 0.312657 & 2.3811 & 0.010282 \tabularnewline
3 & 0.227404 & 1.7319 & 0.044307 \tabularnewline
4 & 0.0455 & 0.3465 & 0.365103 \tabularnewline
5 & 0.218007 & 1.6603 & 0.051126 \tabularnewline
6 & 0.093431 & 0.7116 & 0.239797 \tabularnewline
7 & -0.125264 & -0.954 & 0.172025 \tabularnewline
8 & -0.004298 & -0.0327 & 0.487001 \tabularnewline
9 & -0.088919 & -0.6772 & 0.25049 \tabularnewline
10 & -0.127888 & -0.974 & 0.167059 \tabularnewline
11 & -0.166685 & -1.2694 & 0.104678 \tabularnewline
12 & -0.388198 & -2.9564 & 0.002247 \tabularnewline
13 & -0.11359 & -0.8651 & 0.195281 \tabularnewline
14 & -0.271075 & -2.0644 & 0.021729 \tabularnewline
15 & -0.055352 & -0.4216 & 0.337455 \tabularnewline
16 & -0.108054 & -0.8229 & 0.206963 \tabularnewline
17 & -0.103923 & -0.7915 & 0.215951 \tabularnewline
18 & 0.004794 & 0.0365 & 0.4855 \tabularnewline
19 & -0.093455 & -0.7117 & 0.239741 \tabularnewline
20 & -0.05275 & -0.4017 & 0.34468 \tabularnewline
21 & 0.164743 & 1.2546 & 0.107321 \tabularnewline
22 & -0.147905 & -1.1264 & 0.132315 \tabularnewline
23 & 0.20099 & 1.5307 & 0.065641 \tabularnewline
24 & -0.019435 & -0.148 & 0.441422 \tabularnewline
25 & -0.022125 & -0.1685 & 0.433388 \tabularnewline
26 & 0.202795 & 1.5444 & 0.06396 \tabularnewline
27 & 0.008679 & 0.0661 & 0.473764 \tabularnewline
28 & -0.023434 & -0.1785 & 0.429489 \tabularnewline
29 & 0.026898 & 0.2048 & 0.419204 \tabularnewline
30 & -0.052946 & -0.4032 & 0.344133 \tabularnewline
31 & 0.096179 & 0.7325 & 0.233413 \tabularnewline
32 & 0.077294 & 0.5887 & 0.27919 \tabularnewline
33 & -0.067421 & -0.5135 & 0.304789 \tabularnewline
34 & 0.076246 & 0.5807 & 0.281855 \tabularnewline
35 & -0.021758 & -0.1657 & 0.434483 \tabularnewline
36 & 0.076227 & 0.5805 & 0.281905 \tabularnewline
\hline
\end{tabular}
%Source: https://freestatistics.org/blog/index.php?pk=28731&T=1

[TABLE]
[ROW][C]Autocorrelation Function[/C][/ROW]
[ROW][C]Time lag k[/C][C]ACF(k)[/C][C]T-STAT[/C][C]P-value[/C][/ROW]
[ROW][C]1[/C][C]0.025027[/C][C]0.1906[/C][C]0.424751[/C][/ROW]
[ROW][C]2[/C][C]0.312657[/C][C]2.3811[/C][C]0.010282[/C][/ROW]
[ROW][C]3[/C][C]0.227404[/C][C]1.7319[/C][C]0.044307[/C][/ROW]
[ROW][C]4[/C][C]0.0455[/C][C]0.3465[/C][C]0.365103[/C][/ROW]
[ROW][C]5[/C][C]0.218007[/C][C]1.6603[/C][C]0.051126[/C][/ROW]
[ROW][C]6[/C][C]0.093431[/C][C]0.7116[/C][C]0.239797[/C][/ROW]
[ROW][C]7[/C][C]-0.125264[/C][C]-0.954[/C][C]0.172025[/C][/ROW]
[ROW][C]8[/C][C]-0.004298[/C][C]-0.0327[/C][C]0.487001[/C][/ROW]
[ROW][C]9[/C][C]-0.088919[/C][C]-0.6772[/C][C]0.25049[/C][/ROW]
[ROW][C]10[/C][C]-0.127888[/C][C]-0.974[/C][C]0.167059[/C][/ROW]
[ROW][C]11[/C][C]-0.166685[/C][C]-1.2694[/C][C]0.104678[/C][/ROW]
[ROW][C]12[/C][C]-0.388198[/C][C]-2.9564[/C][C]0.002247[/C][/ROW]
[ROW][C]13[/C][C]-0.11359[/C][C]-0.8651[/C][C]0.195281[/C][/ROW]
[ROW][C]14[/C][C]-0.271075[/C][C]-2.0644[/C][C]0.021729[/C][/ROW]
[ROW][C]15[/C][C]-0.055352[/C][C]-0.4216[/C][C]0.337455[/C][/ROW]
[ROW][C]16[/C][C]-0.108054[/C][C]-0.8229[/C][C]0.206963[/C][/ROW]
[ROW][C]17[/C][C]-0.103923[/C][C]-0.7915[/C][C]0.215951[/C][/ROW]
[ROW][C]18[/C][C]0.004794[/C][C]0.0365[/C][C]0.4855[/C][/ROW]
[ROW][C]19[/C][C]-0.093455[/C][C]-0.7117[/C][C]0.239741[/C][/ROW]
[ROW][C]20[/C][C]-0.05275[/C][C]-0.4017[/C][C]0.34468[/C][/ROW]
[ROW][C]21[/C][C]0.164743[/C][C]1.2546[/C][C]0.107321[/C][/ROW]
[ROW][C]22[/C][C]-0.147905[/C][C]-1.1264[/C][C]0.132315[/C][/ROW]
[ROW][C]23[/C][C]0.20099[/C][C]1.5307[/C][C]0.065641[/C][/ROW]
[ROW][C]24[/C][C]-0.019435[/C][C]-0.148[/C][C]0.441422[/C][/ROW]
[ROW][C]25[/C][C]-0.022125[/C][C]-0.1685[/C][C]0.433388[/C][/ROW]
[ROW][C]26[/C][C]0.202795[/C][C]1.5444[/C][C]0.06396[/C][/ROW]
[ROW][C]27[/C][C]0.008679[/C][C]0.0661[/C][C]0.473764[/C][/ROW]
[ROW][C]28[/C][C]-0.023434[/C][C]-0.1785[/C][C]0.429489[/C][/ROW]
[ROW][C]29[/C][C]0.026898[/C][C]0.2048[/C][C]0.419204[/C][/ROW]
[ROW][C]30[/C][C]-0.052946[/C][C]-0.4032[/C][C]0.344133[/C][/ROW]
[ROW][C]31[/C][C]0.096179[/C][C]0.7325[/C][C]0.233413[/C][/ROW]
[ROW][C]32[/C][C]0.077294[/C][C]0.5887[/C][C]0.27919[/C][/ROW]
[ROW][C]33[/C][C]-0.067421[/C][C]-0.5135[/C][C]0.304789[/C][/ROW]
[ROW][C]34[/C][C]0.076246[/C][C]0.5807[/C][C]0.281855[/C][/ROW]
[ROW][C]35[/C][C]-0.021758[/C][C]-0.1657[/C][C]0.434483[/C][/ROW]
[ROW][C]36[/C][C]0.076227[/C][C]0.5805[/C][C]0.281905[/C][/ROW]
[/TABLE]
Source: https://freestatistics.org/blog/index.php?pk=28731&T=1

Globally Unique Identifier (entire table): ba.freestatistics.org/blog/index.php?pk=28731&T=1

As an alternative you can also use a QR Code:  

The GUIDs for individual cells are displayed in the table below:

Autocorrelation Function
Time lag kACF(k)T-STATP-value
10.0250270.19060.424751
20.3126572.38110.010282
30.2274041.73190.044307
40.04550.34650.365103
50.2180071.66030.051126
60.0934310.71160.239797
7-0.125264-0.9540.172025
8-0.004298-0.03270.487001
9-0.088919-0.67720.25049
10-0.127888-0.9740.167059
11-0.166685-1.26940.104678
12-0.388198-2.95640.002247
13-0.11359-0.86510.195281
14-0.271075-2.06440.021729
15-0.055352-0.42160.337455
16-0.108054-0.82290.206963
17-0.103923-0.79150.215951
180.0047940.03650.4855
19-0.093455-0.71170.239741
20-0.05275-0.40170.34468
210.1647431.25460.107321
22-0.147905-1.12640.132315
230.200991.53070.065641
24-0.019435-0.1480.441422
25-0.022125-0.16850.433388
260.2027951.54440.06396
270.0086790.06610.473764
28-0.023434-0.17850.429489
290.0268980.20480.419204
30-0.052946-0.40320.344133
310.0961790.73250.233413
320.0772940.58870.27919
33-0.067421-0.51350.304789
340.0762460.58070.281855
35-0.021758-0.16570.434483
360.0762270.58050.281905


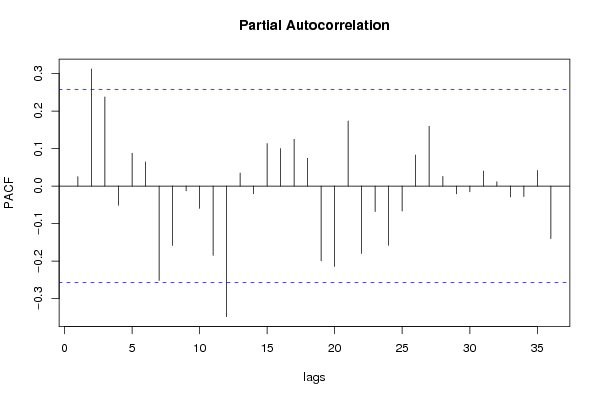
Partial Autocorrelation Function
Time lag kPACF(k)T-STATP-value
10.0250270.19060.424751
20.3122272.37780.010365
30.2374951.80870.03784
4-0.051508-0.39230.348148
50.0875470.66670.253791
60.064330.48990.313018
7-0.251681-1.91670.030101
8-0.158525-1.20730.11611
9-0.01279-0.09740.46137
10-0.059287-0.45150.326652
11-0.18456-1.40560.082594
12-0.348229-2.6520.005151
130.0346860.26420.396296
14-0.020834-0.15870.43724
150.1131490.86170.196196
160.0999130.76090.224895
170.1245840.94880.173328
180.0740850.56420.287391
19-0.19944-1.51890.067112
20-0.21469-1.6350.053729
210.1734721.32110.095824
22-0.179604-1.36780.088322
23-0.068162-0.51910.302832
24-0.157945-1.20290.116956
25-0.066693-0.50790.306719
260.082650.62940.265766
270.1594241.21410.114808
280.0257170.19590.422704
29-0.020751-0.1580.437488
30-0.01537-0.11710.45361
310.0400220.30480.380806
320.0116680.08890.46475
33-0.028957-0.22050.413117
34-0.027922-0.21270.416172
350.0415270.31630.376471
36-0.140149-1.06730.14512

\begin{tabular}{lllllllll}
\hline
Partial Autocorrelation Function \tabularnewline
Time lag k & PACF(k) & T-STAT & P-value \tabularnewline
1 & 0.025027 & 0.1906 & 0.424751 \tabularnewline
2 & 0.312227 & 2.3778 & 0.010365 \tabularnewline
3 & 0.237495 & 1.8087 & 0.03784 \tabularnewline
4 & -0.051508 & -0.3923 & 0.348148 \tabularnewline
5 & 0.087547 & 0.6667 & 0.253791 \tabularnewline
6 & 0.06433 & 0.4899 & 0.313018 \tabularnewline
7 & -0.251681 & -1.9167 & 0.030101 \tabularnewline
8 & -0.158525 & -1.2073 & 0.11611 \tabularnewline
9 & -0.01279 & -0.0974 & 0.46137 \tabularnewline
10 & -0.059287 & -0.4515 & 0.326652 \tabularnewline
11 & -0.18456 & -1.4056 & 0.082594 \tabularnewline
12 & -0.348229 & -2.652 & 0.005151 \tabularnewline
13 & 0.034686 & 0.2642 & 0.396296 \tabularnewline
14 & -0.020834 & -0.1587 & 0.43724 \tabularnewline
15 & 0.113149 & 0.8617 & 0.196196 \tabularnewline
16 & 0.099913 & 0.7609 & 0.224895 \tabularnewline
17 & 0.124584 & 0.9488 & 0.173328 \tabularnewline
18 & 0.074085 & 0.5642 & 0.287391 \tabularnewline
19 & -0.19944 & -1.5189 & 0.067112 \tabularnewline
20 & -0.21469 & -1.635 & 0.053729 \tabularnewline
21 & 0.173472 & 1.3211 & 0.095824 \tabularnewline
22 & -0.179604 & -1.3678 & 0.088322 \tabularnewline
23 & -0.068162 & -0.5191 & 0.302832 \tabularnewline
24 & -0.157945 & -1.2029 & 0.116956 \tabularnewline
25 & -0.066693 & -0.5079 & 0.306719 \tabularnewline
26 & 0.08265 & 0.6294 & 0.265766 \tabularnewline
27 & 0.159424 & 1.2141 & 0.114808 \tabularnewline
28 & 0.025717 & 0.1959 & 0.422704 \tabularnewline
29 & -0.020751 & -0.158 & 0.437488 \tabularnewline
30 & -0.01537 & -0.1171 & 0.45361 \tabularnewline
31 & 0.040022 & 0.3048 & 0.380806 \tabularnewline
32 & 0.011668 & 0.0889 & 0.46475 \tabularnewline
33 & -0.028957 & -0.2205 & 0.413117 \tabularnewline
34 & -0.027922 & -0.2127 & 0.416172 \tabularnewline
35 & 0.041527 & 0.3163 & 0.376471 \tabularnewline
36 & -0.140149 & -1.0673 & 0.14512 \tabularnewline
\hline
\end{tabular}
%Source: https://freestatistics.org/blog/index.php?pk=28731&T=2

[TABLE]
[ROW][C]Partial Autocorrelation Function[/C][/ROW]
[ROW][C]Time lag k[/C][C]PACF(k)[/C][C]T-STAT[/C][C]P-value[/C][/ROW]
[ROW][C]1[/C][C]0.025027[/C][C]0.1906[/C][C]0.424751[/C][/ROW]
[ROW][C]2[/C][C]0.312227[/C][C]2.3778[/C][C]0.010365[/C][/ROW]
[ROW][C]3[/C][C]0.237495[/C][C]1.8087[/C][C]0.03784[/C][/ROW]
[ROW][C]4[/C][C]-0.051508[/C][C]-0.3923[/C][C]0.348148[/C][/ROW]
[ROW][C]5[/C][C]0.087547[/C][C]0.6667[/C][C]0.253791[/C][/ROW]
[ROW][C]6[/C][C]0.06433[/C][C]0.4899[/C][C]0.313018[/C][/ROW]
[ROW][C]7[/C][C]-0.251681[/C][C]-1.9167[/C][C]0.030101[/C][/ROW]
[ROW][C]8[/C][C]-0.158525[/C][C]-1.2073[/C][C]0.11611[/C][/ROW]
[ROW][C]9[/C][C]-0.01279[/C][C]-0.0974[/C][C]0.46137[/C][/ROW]
[ROW][C]10[/C][C]-0.059287[/C][C]-0.4515[/C][C]0.326652[/C][/ROW]
[ROW][C]11[/C][C]-0.18456[/C][C]-1.4056[/C][C]0.082594[/C][/ROW]
[ROW][C]12[/C][C]-0.348229[/C][C]-2.652[/C][C]0.005151[/C][/ROW]
[ROW][C]13[/C][C]0.034686[/C][C]0.2642[/C][C]0.396296[/C][/ROW]
[ROW][C]14[/C][C]-0.020834[/C][C]-0.1587[/C][C]0.43724[/C][/ROW]
[ROW][C]15[/C][C]0.113149[/C][C]0.8617[/C][C]0.196196[/C][/ROW]
[ROW][C]16[/C][C]0.099913[/C][C]0.7609[/C][C]0.224895[/C][/ROW]
[ROW][C]17[/C][C]0.124584[/C][C]0.9488[/C][C]0.173328[/C][/ROW]
[ROW][C]18[/C][C]0.074085[/C][C]0.5642[/C][C]0.287391[/C][/ROW]
[ROW][C]19[/C][C]-0.19944[/C][C]-1.5189[/C][C]0.067112[/C][/ROW]
[ROW][C]20[/C][C]-0.21469[/C][C]-1.635[/C][C]0.053729[/C][/ROW]
[ROW][C]21[/C][C]0.173472[/C][C]1.3211[/C][C]0.095824[/C][/ROW]
[ROW][C]22[/C][C]-0.179604[/C][C]-1.3678[/C][C]0.088322[/C][/ROW]
[ROW][C]23[/C][C]-0.068162[/C][C]-0.5191[/C][C]0.302832[/C][/ROW]
[ROW][C]24[/C][C]-0.157945[/C][C]-1.2029[/C][C]0.116956[/C][/ROW]
[ROW][C]25[/C][C]-0.066693[/C][C]-0.5079[/C][C]0.306719[/C][/ROW]
[ROW][C]26[/C][C]0.08265[/C][C]0.6294[/C][C]0.265766[/C][/ROW]
[ROW][C]27[/C][C]0.159424[/C][C]1.2141[/C][C]0.114808[/C][/ROW]
[ROW][C]28[/C][C]0.025717[/C][C]0.1959[/C][C]0.422704[/C][/ROW]
[ROW][C]29[/C][C]-0.020751[/C][C]-0.158[/C][C]0.437488[/C][/ROW]
[ROW][C]30[/C][C]-0.01537[/C][C]-0.1171[/C][C]0.45361[/C][/ROW]
[ROW][C]31[/C][C]0.040022[/C][C]0.3048[/C][C]0.380806[/C][/ROW]
[ROW][C]32[/C][C]0.011668[/C][C]0.0889[/C][C]0.46475[/C][/ROW]
[ROW][C]33[/C][C]-0.028957[/C][C]-0.2205[/C][C]0.413117[/C][/ROW]
[ROW][C]34[/C][C]-0.027922[/C][C]-0.2127[/C][C]0.416172[/C][/ROW]
[ROW][C]35[/C][C]0.041527[/C][C]0.3163[/C][C]0.376471[/C][/ROW]
[ROW][C]36[/C][C]-0.140149[/C][C]-1.0673[/C][C]0.14512[/C][/ROW]
[/TABLE]
Source: https://freestatistics.org/blog/index.php?pk=28731&T=2

Globally Unique Identifier (entire table): ba.freestatistics.org/blog/index.php?pk=28731&T=2

As an alternative you can also use a QR Code:  

The GUIDs for individual cells are displayed in the table below:

Partial Autocorrelation Function
Time lag kPACF(k)T-STATP-value
10.0250270.19060.424751
20.3122272.37780.010365
30.2374951.80870.03784
4-0.051508-0.39230.348148
50.0875470.66670.253791
60.064330.48990.313018
7-0.251681-1.91670.030101
8-0.158525-1.20730.11611
9-0.01279-0.09740.46137
10-0.059287-0.45150.326652
11-0.18456-1.40560.082594
12-0.348229-2.6520.005151
130.0346860.26420.396296
14-0.020834-0.15870.43724
150.1131490.86170.196196
160.0999130.76090.224895
170.1245840.94880.173328
180.0740850.56420.287391
19-0.19944-1.51890.067112
20-0.21469-1.6350.053729
210.1734721.32110.095824
22-0.179604-1.36780.088322
23-0.068162-0.51910.302832
24-0.157945-1.20290.116956
25-0.066693-0.50790.306719
260.082650.62940.265766
270.1594241.21410.114808
280.0257170.19590.422704
29-0.020751-0.1580.437488
30-0.01537-0.11710.45361
310.0400220.30480.380806
320.0116680.08890.46475
33-0.028957-0.22050.413117
34-0.027922-0.21270.416172
350.0415270.31630.376471
36-0.140149-1.06730.14512


Parameters (Session):
par1 = 1 ; par2 = 0 ; par3 = 1 ; par4 = 12 ;
Parameters (R input):
par1 = 36 ; par2 = 1.3 ; par3 = 0 ; par4 = 2 ; par5 = 12 ;
R code (references can be found in the software module):
if (par1 == 'Default') {
par1 = 10*log10(length(x))
} else {
par1 <- as.numeric(par1)
}
par2 <- as.numeric(par2)
par3 <- as.numeric(par3)
par4 <- as.numeric(par4)
par5 <- as.numeric(par5)
if (par2 == 0) {
x <- log(x)
} else {
x <- (x ^ par2 - 1) / par2
}
if (par3 > 0) x <- diff(x,lag=1,difference=par3)
if (par4 > 0) x <- diff(x,lag=par5,difference=par4)
bitmap(file='pic1.png')
racf <- acf(x,par1,main='Autocorrelation',xlab='lags',ylab='ACF')
dev.off()
bitmap(file='pic2.png')
rpacf <- pacf(x,par1,main='Partial Autocorrelation',xlab='lags',ylab='PACF')
dev.off()
(myacf <- c(racf$acf))
(mypacf <- c(rpacf$acf))
lengthx <- length(x)
sqrtn <- sqrt(lengthx)
load(file='createtable')
a<-table.start()
a<-table.row.start(a)
a<-table.element(a,'Autocorrelation Function',4,TRUE)
a<-table.row.end(a)
a<-table.row.start(a)
a<-table.element(a,'Time lag k',header=TRUE)
a<-table.element(a,hyperlink('basics.htm','ACF(k)','click here for more information about the Autocorrelation Function'),header=TRUE)
a<-table.element(a,'T-STAT',header=TRUE)
a<-table.element(a,'P-value',header=TRUE)
a<-table.row.end(a)
for (i in 2:(par1+1)) {
a<-table.row.start(a)
a<-table.element(a,i-1,header=TRUE)
a<-table.element(a,round(myacf[i],6))
mytstat <- myacf[i]*sqrtn
a<-table.element(a,round(mytstat,4))
a<-table.element(a,round(1-pt(abs(mytstat),lengthx),6))
a<-table.row.end(a)
}
a<-table.end(a)
table.save(a,file='mytable.tab')
a<-table.start()
a<-table.row.start(a)
a<-table.element(a,'Partial Autocorrelation Function',4,TRUE)
a<-table.row.end(a)
a<-table.row.start(a)
a<-table.element(a,'Time lag k',header=TRUE)
a<-table.element(a,hyperlink('basics.htm','PACF(k)','click here for more information about the Partial Autocorrelation Function'),header=TRUE)
a<-table.element(a,'T-STAT',header=TRUE)
a<-table.element(a,'P-value',header=TRUE)
a<-table.row.end(a)
for (i in 1:par1) {
a<-table.row.start(a)
a<-table.element(a,i,header=TRUE)
a<-table.element(a,round(mypacf[i],6))
mytstat <- mypacf[i]*sqrtn
a<-table.element(a,round(mytstat,4))
a<-table.element(a,round(1-pt(abs(mytstat),lengthx),6))
a<-table.row.end(a)
}
a<-table.end(a)
table.save(a,file='mytable1.tab')