Free Statistics

of Irreproducible Research!

Author's title

Author*The author of this computation has been verified*
R Software Modulerwasp_cross.wasp
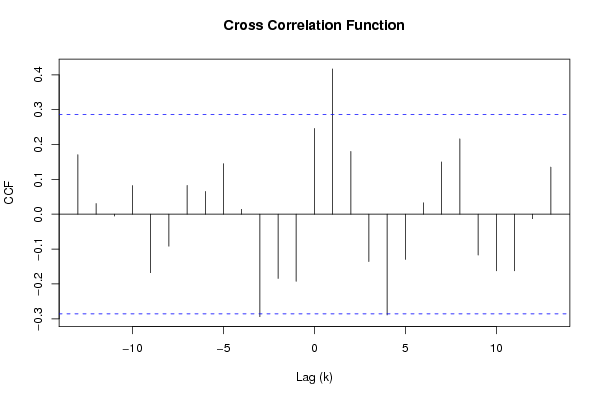
Title produced by softwareCross Correlation Function
Date of computationWed, 03 Dec 2008 06:42:33 -0700
Cite this page as followsStatistical Computations at FreeStatistics.org, Office for Research Development and Education, URL https://freestatistics.org/blog/index.php?v=date/2008/Dec/03/t1228311804os52hi5bio4xtmh.htm/, Retrieved Sun, 19 May 2024 04:21:49 +0000
Statistical Computations at FreeStatistics.org, Office for Research Development and Education, URL https://freestatistics.org/blog/index.php?pk=28706, Retrieved Sun, 19 May 2024 04:21:49 +0000
QR Codes:

Original text written by user:
IsPrivate?No (this computation is public)
User-defined keywordsnon stationary time series Q9 cross
Estimated Impact233
Family? (F = Feedback message, R = changed R code, M = changed R Module, P = changed Parameters, D = changed Data)
F     [Univariate Data Series] [Airline data] [2007-10-18 09:58:47] [42daae401fd3def69a25014f2252b4c2]
- RMPD  [Cross Correlation Function] [non stationary ti...] [2008-12-02 19:52:31] [47f64d63202c1921bd27f3073f07a153]
F   PD    [Cross Correlation Function] [non stationary ti...] [2008-12-02 20:08:18] [47f64d63202c1921bd27f3073f07a153]
F   P         [Cross Correlation Function] [non stationary ti...] [2008-12-03 13:42:33] [74c7506a1ea162af3aa8be25bcd05d28] [Current]
Feedback Forum
2008-12-08 18:25:01 [6066575aa30c0611e452e930b1dff53d] [reply
Deze vraag werd ook zeer goed beantwoord. Uit de tabel kunnen we afleiden dat voor k=0 de correlatie tussen Y[t] en X[t] zonder verschuiving in de tijd 0.246391621806179 bedraagt. Dit is toch een groot verschil met Q7 waar de correlatie 0.919639434552627 bedroeg. Bij de grafiek van de cross correlation function werd vermeld dat er slechts 1 verticale lijn is die buiten het 95% betrouwbaarheidsinterval ligt. Deze is significant verschillend van nul. Deze grafiek geeft een veel betrouwbaarder beeld dan Q7. Bovendien waren bij Q7 alle verticale lijnen positief en bij Q9 is dit niet zo.

Post a new message
Dataseries X:
8.4
8.4
8.4
8.6
8.9
8.8
8.3
7.5
7.2
7.5
8.8
9.3
9.3
8.7
8.2
8.3
8.5
8.6
8.6
8.2
8.1
8
8.6
8.7
8.8
8.5
8.4
8.5
8.7
8.7
8.6
8.5
8.3
8.1
8.2
8.1
8.1
7.9
7.9
7.9
8
8
7.9
8
7.7
7.2
7.5
7.3
7
7
7
7.2
7.3
7.1
6.8
6.6
6.2
6.2
6.8
6.9
6.8
Dataseries Y:
7.6
7.9
7.9
8.1
8.2
8
7.5
6.8
6.5
6.6
7.6
8
8
7.7
7.5
7.6
7.7
7.9
7.8
7.5
7.5
7.1
7.5
7.5
7.6
7.7
7.7
7.9
8.1
8.2
8.2
8.1
7.9
7.3
6.9
6.6
6.7
6.9
7
7.1
7.2
7.1
6.9
7
6.8
6.4
6.7
6.7
6.4
6.3
6.2
6.5
6.8
6.8
6.5
6.3
5.9
5.9
6.4
6.4
6.5


Summary of computational transaction
Raw Inputview raw input (R code)
Raw Outputview raw output of R engine
Computing time1 seconds
R Server'Gwilym Jenkins' @ 72.249.127.135

\begin{tabular}{lllllllll}
\hline
Summary of computational transaction \tabularnewline
Raw Input & view raw input (R code)  \tabularnewline
Raw Output & view raw output of R engine  \tabularnewline
Computing time & 1 seconds \tabularnewline
R Server & 'Gwilym Jenkins' @ 72.249.127.135 \tabularnewline
\hline
\end{tabular}
%Source: https://freestatistics.org/blog/index.php?pk=28706&T=0

[TABLE]
[ROW][C]Summary of computational transaction[/C][/ROW]
[ROW][C]Raw Input[/C][C]view raw input (R code) [/C][/ROW]
[ROW][C]Raw Output[/C][C]view raw output of R engine [/C][/ROW]
[ROW][C]Computing time[/C][C]1 seconds[/C][/ROW]
[ROW][C]R Server[/C][C]'Gwilym Jenkins' @ 72.249.127.135[/C][/ROW]
[/TABLE]
Source: https://freestatistics.org/blog/index.php?pk=28706&T=0

Globally Unique Identifier (entire table): ba.freestatistics.org/blog/index.php?pk=28706&T=0

As an alternative you can also use a QR Code:  

The GUIDs for individual cells are displayed in the table below:

Summary of computational transaction
Raw Inputview raw input (R code)
Raw Outputview raw output of R engine
Computing time1 seconds
R Server'Gwilym Jenkins' @ 72.249.127.135


Cross Correlation Function
ParameterValue
Box-Cox transformation parameter (lambda) of X series-0.8
Degree of non-seasonal differencing (d) of X series2
Degree of seasonal differencing (D) of X series1
Seasonal Period (s)12
Box-Cox transformation parameter (lambda) of Y series1.8
Degree of non-seasonal differencing (d) of Y series1
Degree of seasonal differencing (D) of Y series0
krho(Y[t],X[t+k])
-130.171037354661246
-120.0308412855794718
-11-0.00529292158655459
-100.0824929933197233
-9-0.167888506182735
-8-0.091653878859252
-70.0827049033748374
-60.0656296880163144
-50.145065486864864
-40.0140504419279036
-3-0.29398567536961
-2-0.184115791587947
-1-0.192639278412249
00.246391621806179
10.417072751644317
20.180132009234780
3-0.135698732172296
4-0.289125281583213
5-0.129833917724480
60.0329746240872741
70.150107087753461
80.216362908689795
9-0.117058227703332
10-0.162403444530631
11-0.162526300567020
12-0.0128478998952833
130.135264432673810

\begin{tabular}{lllllllll}
\hline
Cross Correlation Function \tabularnewline
Parameter & Value \tabularnewline
Box-Cox transformation parameter (lambda) of X series & -0.8 \tabularnewline
Degree of non-seasonal differencing (d) of X series & 2 \tabularnewline
Degree of seasonal differencing (D) of X series & 1 \tabularnewline
Seasonal Period (s) & 12 \tabularnewline
Box-Cox transformation parameter (lambda) of Y series & 1.8 \tabularnewline
Degree of non-seasonal differencing (d) of Y series & 1 \tabularnewline
Degree of seasonal differencing (D) of Y series & 0 \tabularnewline
k & rho(Y[t],X[t+k]) \tabularnewline
-13 & 0.171037354661246 \tabularnewline
-12 & 0.0308412855794718 \tabularnewline
-11 & -0.00529292158655459 \tabularnewline
-10 & 0.0824929933197233 \tabularnewline
-9 & -0.167888506182735 \tabularnewline
-8 & -0.091653878859252 \tabularnewline
-7 & 0.0827049033748374 \tabularnewline
-6 & 0.0656296880163144 \tabularnewline
-5 & 0.145065486864864 \tabularnewline
-4 & 0.0140504419279036 \tabularnewline
-3 & -0.29398567536961 \tabularnewline
-2 & -0.184115791587947 \tabularnewline
-1 & -0.192639278412249 \tabularnewline
0 & 0.246391621806179 \tabularnewline
1 & 0.417072751644317 \tabularnewline
2 & 0.180132009234780 \tabularnewline
3 & -0.135698732172296 \tabularnewline
4 & -0.289125281583213 \tabularnewline
5 & -0.129833917724480 \tabularnewline
6 & 0.0329746240872741 \tabularnewline
7 & 0.150107087753461 \tabularnewline
8 & 0.216362908689795 \tabularnewline
9 & -0.117058227703332 \tabularnewline
10 & -0.162403444530631 \tabularnewline
11 & -0.162526300567020 \tabularnewline
12 & -0.0128478998952833 \tabularnewline
13 & 0.135264432673810 \tabularnewline
\hline
\end{tabular}
%Source: https://freestatistics.org/blog/index.php?pk=28706&T=1

[TABLE]
[ROW][C]Cross Correlation Function[/C][/ROW]
[ROW][C]Parameter[/C][C]Value[/C][/ROW]
[ROW][C]Box-Cox transformation parameter (lambda) of X series[/C][C]-0.8[/C][/ROW]
[ROW][C]Degree of non-seasonal differencing (d) of X series[/C][C]2[/C][/ROW]
[ROW][C]Degree of seasonal differencing (D) of X series[/C][C]1[/C][/ROW]
[ROW][C]Seasonal Period (s)[/C][C]12[/C][/ROW]
[ROW][C]Box-Cox transformation parameter (lambda) of Y series[/C][C]1.8[/C][/ROW]
[ROW][C]Degree of non-seasonal differencing (d) of Y series[/C][C]1[/C][/ROW]
[ROW][C]Degree of seasonal differencing (D) of Y series[/C][C]0[/C][/ROW]
[ROW][C]k[/C][C]rho(Y[t],X[t+k])[/C][/ROW]
[ROW][C]-13[/C][C]0.171037354661246[/C][/ROW]
[ROW][C]-12[/C][C]0.0308412855794718[/C][/ROW]
[ROW][C]-11[/C][C]-0.00529292158655459[/C][/ROW]
[ROW][C]-10[/C][C]0.0824929933197233[/C][/ROW]
[ROW][C]-9[/C][C]-0.167888506182735[/C][/ROW]
[ROW][C]-8[/C][C]-0.091653878859252[/C][/ROW]
[ROW][C]-7[/C][C]0.0827049033748374[/C][/ROW]
[ROW][C]-6[/C][C]0.0656296880163144[/C][/ROW]
[ROW][C]-5[/C][C]0.145065486864864[/C][/ROW]
[ROW][C]-4[/C][C]0.0140504419279036[/C][/ROW]
[ROW][C]-3[/C][C]-0.29398567536961[/C][/ROW]
[ROW][C]-2[/C][C]-0.184115791587947[/C][/ROW]
[ROW][C]-1[/C][C]-0.192639278412249[/C][/ROW]
[ROW][C]0[/C][C]0.246391621806179[/C][/ROW]
[ROW][C]1[/C][C]0.417072751644317[/C][/ROW]
[ROW][C]2[/C][C]0.180132009234780[/C][/ROW]
[ROW][C]3[/C][C]-0.135698732172296[/C][/ROW]
[ROW][C]4[/C][C]-0.289125281583213[/C][/ROW]
[ROW][C]5[/C][C]-0.129833917724480[/C][/ROW]
[ROW][C]6[/C][C]0.0329746240872741[/C][/ROW]
[ROW][C]7[/C][C]0.150107087753461[/C][/ROW]
[ROW][C]8[/C][C]0.216362908689795[/C][/ROW]
[ROW][C]9[/C][C]-0.117058227703332[/C][/ROW]
[ROW][C]10[/C][C]-0.162403444530631[/C][/ROW]
[ROW][C]11[/C][C]-0.162526300567020[/C][/ROW]
[ROW][C]12[/C][C]-0.0128478998952833[/C][/ROW]
[ROW][C]13[/C][C]0.135264432673810[/C][/ROW]
[/TABLE]
Source: https://freestatistics.org/blog/index.php?pk=28706&T=1

Globally Unique Identifier (entire table): ba.freestatistics.org/blog/index.php?pk=28706&T=1

As an alternative you can also use a QR Code:  

The GUIDs for individual cells are displayed in the table below:

Cross Correlation Function
ParameterValue
Box-Cox transformation parameter (lambda) of X series-0.8
Degree of non-seasonal differencing (d) of X series2
Degree of seasonal differencing (D) of X series1
Seasonal Period (s)12
Box-Cox transformation parameter (lambda) of Y series1.8
Degree of non-seasonal differencing (d) of Y series1
Degree of seasonal differencing (D) of Y series0
krho(Y[t],X[t+k])
-130.171037354661246
-120.0308412855794718
-11-0.00529292158655459
-100.0824929933197233
-9-0.167888506182735
-8-0.091653878859252
-70.0827049033748374
-60.0656296880163144
-50.145065486864864
-40.0140504419279036
-3-0.29398567536961
-2-0.184115791587947
-1-0.192639278412249
00.246391621806179
10.417072751644317
20.180132009234780
3-0.135698732172296
4-0.289125281583213
5-0.129833917724480
60.0329746240872741
70.150107087753461
80.216362908689795
9-0.117058227703332
10-0.162403444530631
11-0.162526300567020
12-0.0128478998952833
130.135264432673810


Parameters (Session):
par1 = -0.8 ; par2 = 2 ; par3 = 1 ; par4 = 12 ; par5 = 1.8 ; par6 = 1 ; par7 = 0 ;
Parameters (R input):
par1 = -0.8 ; par2 = 2 ; par3 = 1 ; par4 = 12 ; par5 = 1.8 ; par6 = 1 ; par7 = 0 ;
R code (references can be found in the software module):
par1 <- as.numeric(par1)
par2 <- as.numeric(par2)
par3 <- as.numeric(par3)
par4 <- as.numeric(par4)
par5 <- as.numeric(par5)
par6 <- as.numeric(par6)
par7 <- as.numeric(par7)
if (par1 == 0) {
x <- log(x)
} else {
x <- (x ^ par1 - 1) / par1
}
if (par5 == 0) {
y <- log(y)
} else {
y <- (y ^ par5 - 1) / par5
}
if (par2 > 0) x <- diff(x,lag=1,difference=par2)
if (par6 > 0) y <- diff(y,lag=1,difference=par6)
if (par3 > 0) x <- diff(x,lag=par4,difference=par3)
if (par7 > 0) y <- diff(y,lag=par4,difference=par7)
x
y
bitmap(file='test1.png')
(r <- ccf(x,y,main='Cross Correlation Function',ylab='CCF',xlab='Lag (k)'))
dev.off()
load(file='createtable')
a<-table.start()
a<-table.row.start(a)
a<-table.element(a,'Cross Correlation Function',2,TRUE)
a<-table.row.end(a)
a<-table.row.start(a)
a<-table.element(a,'Parameter',header=TRUE)
a<-table.element(a,'Value',header=TRUE)
a<-table.row.end(a)
a<-table.row.start(a)
a<-table.element(a,'Box-Cox transformation parameter (lambda) of X series',header=TRUE)
a<-table.element(a,par1)
a<-table.row.end(a)
a<-table.row.start(a)
a<-table.element(a,'Degree of non-seasonal differencing (d) of X series',header=TRUE)
a<-table.element(a,par2)
a<-table.row.end(a)
a<-table.row.start(a)
a<-table.element(a,'Degree of seasonal differencing (D) of X series',header=TRUE)
a<-table.element(a,par3)
a<-table.row.end(a)
a<-table.row.start(a)
a<-table.element(a,'Seasonal Period (s)',header=TRUE)
a<-table.element(a,par4)
a<-table.row.end(a)
a<-table.row.start(a)
a<-table.element(a,'Box-Cox transformation parameter (lambda) of Y series',header=TRUE)
a<-table.element(a,par5)
a<-table.row.end(a)
a<-table.row.start(a)
a<-table.element(a,'Degree of non-seasonal differencing (d) of Y series',header=TRUE)
a<-table.element(a,par6)
a<-table.row.end(a)
a<-table.row.start(a)
a<-table.element(a,'Degree of seasonal differencing (D) of Y series',header=TRUE)
a<-table.element(a,par7)
a<-table.row.end(a)
a<-table.row.start(a)
a<-table.element(a,'k',header=TRUE)
a<-table.element(a,'rho(Y[t],X[t+k])',header=TRUE)
a<-table.row.end(a)
mylength <- length(r$acf)
myhalf <- floor((mylength-1)/2)
for (i in 1:mylength) {
a<-table.row.start(a)
a<-table.element(a,i-myhalf-1,header=TRUE)
a<-table.element(a,r$acf[i])
a<-table.row.end(a)
}
a<-table.end(a)
table.save(a,file='mytable.tab')