Free Statistics

of Irreproducible Research!

Author's title

Author*Unverified author*
R Software Modulerwasp_cross.wasp
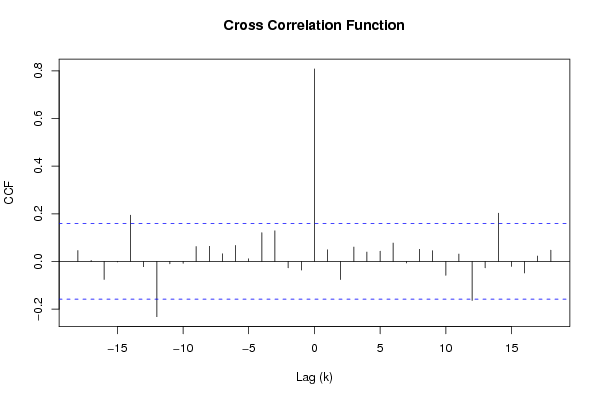
Title produced by softwareCross Correlation Function
Date of computationWed, 03 Dec 2008 05:45:14 -0700
Cite this page as followsStatistical Computations at FreeStatistics.org, Office for Research Development and Education, URL https://freestatistics.org/blog/index.php?v=date/2008/Dec/03/t1228308360hf1lg8msxp1bt4k.htm/, Retrieved Sun, 19 May 2024 06:06:20 +0000
Statistical Computations at FreeStatistics.org, Office for Research Development and Education, URL https://freestatistics.org/blog/index.php?pk=28667, Retrieved Sun, 19 May 2024 06:06:20 +0000
QR Codes:

Original text written by user:
IsPrivate?No (this computation is public)
User-defined keywords
Estimated Impact225
Family? (F = Feedback message, R = changed R code, M = changed R Module, P = changed Parameters, D = changed Data)
F     [Univariate Data Series] [Airline data] [2007-10-18 09:58:47] [42daae401fd3def69a25014f2252b4c2]
F RMPD  [Cross Correlation Function] [] [2008-12-02 19:55:38] [b28ef2aea2cd58ceb5ad90223572c703]
F   P       [Cross Correlation Function] [Q9] [2008-12-03 12:45:14] [d41d8cd98f00b204e9800998ecf8427e] [Current]
Feedback Forum
2008-12-03 19:09:11 [407693b66d7f2e0b350979005057872d] [reply
Dit antwoord is volledig juist:
Als we differentiatie toepassen door voor de parameter X en Y de kleine en grote d een 1 nemen zien we nu dat er maar 5 waarden buiten het betrouwbaarheidsinterval liggen .

2008-12-04 16:16:15 [c97d2ae59c98cf77a04815c1edffab5a] [reply
deze oplossing is niet juist, omdat de student Q8 niet volledig heeft opgelost.
(zie Q8)

2008-12-07 18:23:57 [Sandra Hofmans] [reply
Het klopt dat we het verband verdwenen is. Dit is te verklaren doordat de correlatie vertekend kan worden door een derde variabele. Deze kan een invloed uitoefenen op zowel x als y. We moeten deze variabele toch elimineren.
Maar ja had een betere grafiek bekomen indien je lambda ook nog had berekend.
2008-12-08 13:12:14 [Dave Bellekens] [reply
Het gevonden antwoord en de bijhorende uitleg kloppen wel, maar als je in Q8 de Lambda waarde had berekend, had je deze opgave nog beter kunnen oplossen.

We zien hier dus wel dat het aantal significante coëfficiënten sterk is gedaald, omdat de reeksen stationair zijn gemaakt.

Post a new message
Dataseries X:
263151
259372
251960
246936
240570
238382
261156
272095
272017
271876
266863
270878
274212
265841
255968
250606
240470
232662
256235
266169
261751
255914
252397
254227
255699
252285
247132
242785
235667
234952
255179
263727
261315
252049
245914
248289
246790
243978
238108
231776
224585
219058
240429
254569
249074
237521
230384
232521
234611
230592
225144
218143
212434
208676
229328
242148
233916
225628
217837
217786
218413
213261
204094
201484
194600
191325
211261
226293
219734
214591
205348
203496
208155
205010
200290
198088
195186
191395
213768
225780
230579
229261
216228
216713
220206
220115
218444
214912
210705
209673
237041
242081
241878
242621
238545
240337
244752
244576
241572
240541
236089
236997
264579
270349
269645
267037
258113
262813
267413
267366
264777
258863
254844
254868
277267
285351
286602
283042
276687
277915
277128
277103
275037
270150
267140
264993
287259
291186
292300
288186
281477
282656
280190
280408
276836
275216
274352
271311
289802
290726
292300
278506
269826
265861
269034
264176
255198
253353
246057
235372
258556
260993
254663
250643
243422
247105
248541
245039
237080
237085
225554
226839
247934
248333
246969
245098
Dataseries Y:
336766
332201
323529
320287
314768
316870
347093
358764
356615
352559
342807
344952
346958
338371
328380
323111
314764
312235
342631
353912
345948
334046
326268
325939
323758
319275
313328
308612
301096
305610
333005
343322
337653
325595
316726
317578
314484
310166
301792
294495
287256
286224
313654
329656
319784
301995
291228
293041
291908
285121
278310
271158
266586
266426
294354
309380
297710
285409
274580
274402
274452
267700
257841
255124
247377
247823
276919
294271
281758
270434
258848
256674
258882
255060
247698
244779
240901
239933
270247
283893
282348
273570
254756
254354
255843
254490
251995
246339
244019
245953
279806
283111
281097
275964
270694
271901
274412
272433
268361
268586
264768
269974
304744
309365
308347
298427
289231
291975
294912
293488
290555
284736
281818
287854
316263
325412
326011
328282
317480
317539
313737
312276
309391
302950
300316
304035
333476
337698
335932
323931
313927
314485
313218
309664
302963
298989
298423
301631
329765
335083
327616
309119
295916
291413
291542
284678
276475
272566
264981
263290
296806
303598
286994
276427
266424
267153
268381
262522
255542
253158
243803
250741
280445
285257
270976
261076


Summary of computational transaction
Raw Inputview raw input (R code)
Raw Outputview raw output of R engine
Computing time1 seconds
R Server'George Udny Yule' @ 72.249.76.132

\begin{tabular}{lllllllll}
\hline
Summary of computational transaction \tabularnewline
Raw Input & view raw input (R code)  \tabularnewline
Raw Output & view raw output of R engine  \tabularnewline
Computing time & 1 seconds \tabularnewline
R Server & 'George Udny Yule' @ 72.249.76.132 \tabularnewline
\hline
\end{tabular}
%Source: https://freestatistics.org/blog/index.php?pk=28667&T=0

[TABLE]
[ROW][C]Summary of computational transaction[/C][/ROW]
[ROW][C]Raw Input[/C][C]view raw input (R code) [/C][/ROW]
[ROW][C]Raw Output[/C][C]view raw output of R engine [/C][/ROW]
[ROW][C]Computing time[/C][C]1 seconds[/C][/ROW]
[ROW][C]R Server[/C][C]'George Udny Yule' @ 72.249.76.132[/C][/ROW]
[/TABLE]
Source: https://freestatistics.org/blog/index.php?pk=28667&T=0

Globally Unique Identifier (entire table): ba.freestatistics.org/blog/index.php?pk=28667&T=0

As an alternative you can also use a QR Code:  

The GUIDs for individual cells are displayed in the table below:

Summary of computational transaction
Raw Inputview raw input (R code)
Raw Outputview raw output of R engine
Computing time1 seconds
R Server'George Udny Yule' @ 72.249.76.132


Cross Correlation Function
ParameterValue
Box-Cox transformation parameter (lambda) of X series1
Degree of non-seasonal differencing (d) of X series1
Degree of seasonal differencing (D) of X series1
Seasonal Period (s)12
Box-Cox transformation parameter (lambda) of Y series1
Degree of non-seasonal differencing (d) of Y series1
Degree of seasonal differencing (D) of Y series1
krho(Y[t],X[t+k])
-180.0455789631444636
-170.00400323596052212
-16-0.0755873109858475
-15-0.00227560442869971
-140.194140579281223
-13-0.0220910322372835
-12-0.231678361770819
-11-0.0100392204092405
-10-0.0079866949022926
-90.0624684162268147
-80.0635370471582327
-70.0320628533820949
-60.0672611532898171
-50.0112166241785642
-40.120453771074033
-30.128587616865702
-2-0.0268846536534497
-1-0.036304988312156
00.807803711523296
10.0490167402762864
2-0.0762356107357594
30.060149383588605
40.0396014088594873
50.0432167268141464
60.0769581384606568
7-0.00611561411843158
80.0508795897124187
90.0451834432972536
10-0.0582579279194025
110.0307667743247605
12-0.163559043679027
13-0.0269307071796227
140.202425463126028
15-0.0209797792852681
16-0.0480157057088801
170.0224979861577774
180.0471338752181358

\begin{tabular}{lllllllll}
\hline
Cross Correlation Function \tabularnewline
Parameter & Value \tabularnewline
Box-Cox transformation parameter (lambda) of X series & 1 \tabularnewline
Degree of non-seasonal differencing (d) of X series & 1 \tabularnewline
Degree of seasonal differencing (D) of X series & 1 \tabularnewline
Seasonal Period (s) & 12 \tabularnewline
Box-Cox transformation parameter (lambda) of Y series & 1 \tabularnewline
Degree of non-seasonal differencing (d) of Y series & 1 \tabularnewline
Degree of seasonal differencing (D) of Y series & 1 \tabularnewline
k & rho(Y[t],X[t+k]) \tabularnewline
-18 & 0.0455789631444636 \tabularnewline
-17 & 0.00400323596052212 \tabularnewline
-16 & -0.0755873109858475 \tabularnewline
-15 & -0.00227560442869971 \tabularnewline
-14 & 0.194140579281223 \tabularnewline
-13 & -0.0220910322372835 \tabularnewline
-12 & -0.231678361770819 \tabularnewline
-11 & -0.0100392204092405 \tabularnewline
-10 & -0.0079866949022926 \tabularnewline
-9 & 0.0624684162268147 \tabularnewline
-8 & 0.0635370471582327 \tabularnewline
-7 & 0.0320628533820949 \tabularnewline
-6 & 0.0672611532898171 \tabularnewline
-5 & 0.0112166241785642 \tabularnewline
-4 & 0.120453771074033 \tabularnewline
-3 & 0.128587616865702 \tabularnewline
-2 & -0.0268846536534497 \tabularnewline
-1 & -0.036304988312156 \tabularnewline
0 & 0.807803711523296 \tabularnewline
1 & 0.0490167402762864 \tabularnewline
2 & -0.0762356107357594 \tabularnewline
3 & 0.060149383588605 \tabularnewline
4 & 0.0396014088594873 \tabularnewline
5 & 0.0432167268141464 \tabularnewline
6 & 0.0769581384606568 \tabularnewline
7 & -0.00611561411843158 \tabularnewline
8 & 0.0508795897124187 \tabularnewline
9 & 0.0451834432972536 \tabularnewline
10 & -0.0582579279194025 \tabularnewline
11 & 0.0307667743247605 \tabularnewline
12 & -0.163559043679027 \tabularnewline
13 & -0.0269307071796227 \tabularnewline
14 & 0.202425463126028 \tabularnewline
15 & -0.0209797792852681 \tabularnewline
16 & -0.0480157057088801 \tabularnewline
17 & 0.0224979861577774 \tabularnewline
18 & 0.0471338752181358 \tabularnewline
\hline
\end{tabular}
%Source: https://freestatistics.org/blog/index.php?pk=28667&T=1

[TABLE]
[ROW][C]Cross Correlation Function[/C][/ROW]
[ROW][C]Parameter[/C][C]Value[/C][/ROW]
[ROW][C]Box-Cox transformation parameter (lambda) of X series[/C][C]1[/C][/ROW]
[ROW][C]Degree of non-seasonal differencing (d) of X series[/C][C]1[/C][/ROW]
[ROW][C]Degree of seasonal differencing (D) of X series[/C][C]1[/C][/ROW]
[ROW][C]Seasonal Period (s)[/C][C]12[/C][/ROW]
[ROW][C]Box-Cox transformation parameter (lambda) of Y series[/C][C]1[/C][/ROW]
[ROW][C]Degree of non-seasonal differencing (d) of Y series[/C][C]1[/C][/ROW]
[ROW][C]Degree of seasonal differencing (D) of Y series[/C][C]1[/C][/ROW]
[ROW][C]k[/C][C]rho(Y[t],X[t+k])[/C][/ROW]
[ROW][C]-18[/C][C]0.0455789631444636[/C][/ROW]
[ROW][C]-17[/C][C]0.00400323596052212[/C][/ROW]
[ROW][C]-16[/C][C]-0.0755873109858475[/C][/ROW]
[ROW][C]-15[/C][C]-0.00227560442869971[/C][/ROW]
[ROW][C]-14[/C][C]0.194140579281223[/C][/ROW]
[ROW][C]-13[/C][C]-0.0220910322372835[/C][/ROW]
[ROW][C]-12[/C][C]-0.231678361770819[/C][/ROW]
[ROW][C]-11[/C][C]-0.0100392204092405[/C][/ROW]
[ROW][C]-10[/C][C]-0.0079866949022926[/C][/ROW]
[ROW][C]-9[/C][C]0.0624684162268147[/C][/ROW]
[ROW][C]-8[/C][C]0.0635370471582327[/C][/ROW]
[ROW][C]-7[/C][C]0.0320628533820949[/C][/ROW]
[ROW][C]-6[/C][C]0.0672611532898171[/C][/ROW]
[ROW][C]-5[/C][C]0.0112166241785642[/C][/ROW]
[ROW][C]-4[/C][C]0.120453771074033[/C][/ROW]
[ROW][C]-3[/C][C]0.128587616865702[/C][/ROW]
[ROW][C]-2[/C][C]-0.0268846536534497[/C][/ROW]
[ROW][C]-1[/C][C]-0.036304988312156[/C][/ROW]
[ROW][C]0[/C][C]0.807803711523296[/C][/ROW]
[ROW][C]1[/C][C]0.0490167402762864[/C][/ROW]
[ROW][C]2[/C][C]-0.0762356107357594[/C][/ROW]
[ROW][C]3[/C][C]0.060149383588605[/C][/ROW]
[ROW][C]4[/C][C]0.0396014088594873[/C][/ROW]
[ROW][C]5[/C][C]0.0432167268141464[/C][/ROW]
[ROW][C]6[/C][C]0.0769581384606568[/C][/ROW]
[ROW][C]7[/C][C]-0.00611561411843158[/C][/ROW]
[ROW][C]8[/C][C]0.0508795897124187[/C][/ROW]
[ROW][C]9[/C][C]0.0451834432972536[/C][/ROW]
[ROW][C]10[/C][C]-0.0582579279194025[/C][/ROW]
[ROW][C]11[/C][C]0.0307667743247605[/C][/ROW]
[ROW][C]12[/C][C]-0.163559043679027[/C][/ROW]
[ROW][C]13[/C][C]-0.0269307071796227[/C][/ROW]
[ROW][C]14[/C][C]0.202425463126028[/C][/ROW]
[ROW][C]15[/C][C]-0.0209797792852681[/C][/ROW]
[ROW][C]16[/C][C]-0.0480157057088801[/C][/ROW]
[ROW][C]17[/C][C]0.0224979861577774[/C][/ROW]
[ROW][C]18[/C][C]0.0471338752181358[/C][/ROW]
[/TABLE]
Source: https://freestatistics.org/blog/index.php?pk=28667&T=1

Globally Unique Identifier (entire table): ba.freestatistics.org/blog/index.php?pk=28667&T=1

As an alternative you can also use a QR Code:  

The GUIDs for individual cells are displayed in the table below:

Cross Correlation Function
ParameterValue
Box-Cox transformation parameter (lambda) of X series1
Degree of non-seasonal differencing (d) of X series1
Degree of seasonal differencing (D) of X series1
Seasonal Period (s)12
Box-Cox transformation parameter (lambda) of Y series1
Degree of non-seasonal differencing (d) of Y series1
Degree of seasonal differencing (D) of Y series1
krho(Y[t],X[t+k])
-180.0455789631444636
-170.00400323596052212
-16-0.0755873109858475
-15-0.00227560442869971
-140.194140579281223
-13-0.0220910322372835
-12-0.231678361770819
-11-0.0100392204092405
-10-0.0079866949022926
-90.0624684162268147
-80.0635370471582327
-70.0320628533820949
-60.0672611532898171
-50.0112166241785642
-40.120453771074033
-30.128587616865702
-2-0.0268846536534497
-1-0.036304988312156
00.807803711523296
10.0490167402762864
2-0.0762356107357594
30.060149383588605
40.0396014088594873
50.0432167268141464
60.0769581384606568
7-0.00611561411843158
80.0508795897124187
90.0451834432972536
10-0.0582579279194025
110.0307667743247605
12-0.163559043679027
13-0.0269307071796227
140.202425463126028
15-0.0209797792852681
16-0.0480157057088801
170.0224979861577774
180.0471338752181358


Parameters (Session):
par1 = 1 ; par2 = 1 ; par3 = 1 ; par4 = 12 ; par5 = 1 ; par6 = 1 ; par7 = 1 ;
Parameters (R input):
par1 = 1 ; par2 = 1 ; par3 = 1 ; par4 = 12 ; par5 = 1 ; par6 = 1 ; par7 = 1 ;
R code (references can be found in the software module):
par1 <- as.numeric(par1)
par2 <- as.numeric(par2)
par3 <- as.numeric(par3)
par4 <- as.numeric(par4)
par5 <- as.numeric(par5)
par6 <- as.numeric(par6)
par7 <- as.numeric(par7)
if (par1 == 0) {
x <- log(x)
} else {
x <- (x ^ par1 - 1) / par1
}
if (par5 == 0) {
y <- log(y)
} else {
y <- (y ^ par5 - 1) / par5
}
if (par2 > 0) x <- diff(x,lag=1,difference=par2)
if (par6 > 0) y <- diff(y,lag=1,difference=par6)
if (par3 > 0) x <- diff(x,lag=par4,difference=par3)
if (par7 > 0) y <- diff(y,lag=par4,difference=par7)
x
y
bitmap(file='test1.png')
(r <- ccf(x,y,main='Cross Correlation Function',ylab='CCF',xlab='Lag (k)'))
dev.off()
load(file='createtable')
a<-table.start()
a<-table.row.start(a)
a<-table.element(a,'Cross Correlation Function',2,TRUE)
a<-table.row.end(a)
a<-table.row.start(a)
a<-table.element(a,'Parameter',header=TRUE)
a<-table.element(a,'Value',header=TRUE)
a<-table.row.end(a)
a<-table.row.start(a)
a<-table.element(a,'Box-Cox transformation parameter (lambda) of X series',header=TRUE)
a<-table.element(a,par1)
a<-table.row.end(a)
a<-table.row.start(a)
a<-table.element(a,'Degree of non-seasonal differencing (d) of X series',header=TRUE)
a<-table.element(a,par2)
a<-table.row.end(a)
a<-table.row.start(a)
a<-table.element(a,'Degree of seasonal differencing (D) of X series',header=TRUE)
a<-table.element(a,par3)
a<-table.row.end(a)
a<-table.row.start(a)
a<-table.element(a,'Seasonal Period (s)',header=TRUE)
a<-table.element(a,par4)
a<-table.row.end(a)
a<-table.row.start(a)
a<-table.element(a,'Box-Cox transformation parameter (lambda) of Y series',header=TRUE)
a<-table.element(a,par5)
a<-table.row.end(a)
a<-table.row.start(a)
a<-table.element(a,'Degree of non-seasonal differencing (d) of Y series',header=TRUE)
a<-table.element(a,par6)
a<-table.row.end(a)
a<-table.row.start(a)
a<-table.element(a,'Degree of seasonal differencing (D) of Y series',header=TRUE)
a<-table.element(a,par7)
a<-table.row.end(a)
a<-table.row.start(a)
a<-table.element(a,'k',header=TRUE)
a<-table.element(a,'rho(Y[t],X[t+k])',header=TRUE)
a<-table.row.end(a)
mylength <- length(r$acf)
myhalf <- floor((mylength-1)/2)
for (i in 1:mylength) {
a<-table.row.start(a)
a<-table.element(a,i-myhalf-1,header=TRUE)
a<-table.element(a,r$acf[i])
a<-table.row.end(a)
}
a<-table.end(a)
table.save(a,file='mytable.tab')