Free Statistics

of Irreproducible Research!

Author's title

Author*Unverified author*
R Software Modulerwasp_autocorrelation.wasp
Title produced by software(Partial) Autocorrelation Function
Date of computationTue, 02 Dec 2008 15:53:08 -0700
Cite this page as followsStatistical Computations at FreeStatistics.org, Office for Research Development and Education, URL https://freestatistics.org/blog/index.php?v=date/2008/Dec/02/t12282584324dl72080ve3dbh3.htm/, Retrieved Sun, 19 May 2024 12:34:28 +0000
Statistical Computations at FreeStatistics.org, Office for Research Development and Education, URL https://freestatistics.org/blog/index.php?pk=28522, Retrieved Sun, 19 May 2024 12:34:28 +0000
QR Codes:

Original text written by user:
IsPrivate?No (this computation is public)
User-defined keywords
Estimated Impact148
Family? (F = Feedback message, R = changed R code, M = changed R Module, P = changed Parameters, D = changed Data)
F     [Univariate Data Series] [Airline data] [2007-10-18 09:58:47] [42daae401fd3def69a25014f2252b4c2]
- RM D  [(Partial) Autocorrelation Function] [Non stationary ti...] [2008-12-02 22:44:03] [1a689e9ccc515e1757f0522229a687e9]
-    D      [(Partial) Autocorrelation Function] [Non stationary ti...] [2008-12-02 22:53:08] [74a138e5b32af267311b5ad4cd13bf7e] [Current]
Feedback Forum

Post a new message
Dataseries X:
93.7
105.7
109.5
105.3
102.8
100.6
97.6
110.3
107.2
107.2
108.1
97.1
92.2
112.2
111.6
115.7
111.3
104.2
103.2
112.7
106.4
102.6
110.6
95.2
89
112.5
116.8
107.2
113.6
101.8
102.6
122.7
110.3
110.5
121.6
100.3
100.7
123.4
127.1
124.1
131.2
111.6
114.2
130.1
125.9
119
133.8
107.5
113.5
134.4
126.8
135.6
139.9
129.8
131
153.1
134.1
144.1
155.9
123.3
128.1
144.3
153
149.9
150.9
141
138.9
157.4
142.9
151.7
161
138.5
135.9
151.5
164
159.1
157
142.1
144.8
152.1
154.6
148.7
157.7
146.4
136.5


Summary of computational transaction
Raw Inputview raw input (R code)
Raw Outputview raw output of R engine
Computing time1 seconds
R Server'Gwilym Jenkins' @ 72.249.127.135

\begin{tabular}{lllllllll}
\hline
Summary of computational transaction \tabularnewline
Raw Input & view raw input (R code)  \tabularnewline
Raw Output & view raw output of R engine  \tabularnewline
Computing time & 1 seconds \tabularnewline
R Server & 'Gwilym Jenkins' @ 72.249.127.135 \tabularnewline
\hline
\end{tabular}
%Source: https://freestatistics.org/blog/index.php?pk=28522&T=0

[TABLE]
[ROW][C]Summary of computational transaction[/C][/ROW]
[ROW][C]Raw Input[/C][C]view raw input (R code) [/C][/ROW]
[ROW][C]Raw Output[/C][C]view raw output of R engine [/C][/ROW]
[ROW][C]Computing time[/C][C]1 seconds[/C][/ROW]
[ROW][C]R Server[/C][C]'Gwilym Jenkins' @ 72.249.127.135[/C][/ROW]
[/TABLE]
Source: https://freestatistics.org/blog/index.php?pk=28522&T=0

Globally Unique Identifier (entire table): ba.freestatistics.org/blog/index.php?pk=28522&T=0

As an alternative you can also use a QR Code:  

The GUIDs for individual cells are displayed in the table below:

Summary of computational transaction
Raw Inputview raw input (R code)
Raw Outputview raw output of R engine
Computing time1 seconds
R Server'Gwilym Jenkins' @ 72.249.127.135


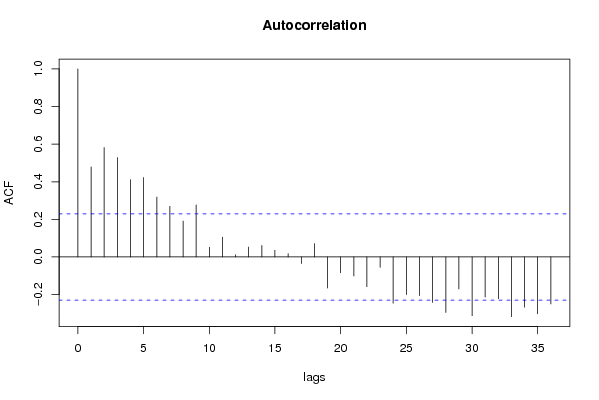
Autocorrelation Function
Time lag kACF(k)T-STATP-value
10.4792034.09435.4e-05
20.5821624.9742e-06
30.5286184.51651.2e-05
40.4111733.51310.000382
50.422553.61030.000279
60.318632.72240.004051
70.2697362.30460.012017
80.1907911.63010.053692
90.2767792.36480.01035
100.0522030.4460.328451
110.1050530.89760.186181
120.0115870.0990.460704
130.0526210.44960.327167
140.0611560.52250.301445
150.035480.30310.381322
160.0175920.15030.44047
17-0.035278-0.30140.381978
180.0712810.6090.272198
19-0.165435-1.41350.080883
20-0.084434-0.72140.236483
21-0.1009-0.86210.19573
22-0.157836-1.34860.090825
23-0.054656-0.4670.320953
24-0.246051-2.10230.01949
25-0.200041-1.70920.045836
26-0.204963-1.75120.042055
27-0.241701-2.06510.021233
28-0.295188-2.52210.006923
29-0.169675-1.44970.075712
30-0.312024-2.66590.004724
31-0.212905-1.81910.036502
32-0.221993-1.89670.030911
33-0.3173-2.7110.004179
34-0.26674-2.2790.012795
35-0.30235-2.58330.005894
36-0.249356-2.13050.01825

\begin{tabular}{lllllllll}
\hline
Autocorrelation Function \tabularnewline
Time lag k & ACF(k) & T-STAT & P-value \tabularnewline
1 & 0.479203 & 4.0943 & 5.4e-05 \tabularnewline
2 & 0.582162 & 4.974 & 2e-06 \tabularnewline
3 & 0.528618 & 4.5165 & 1.2e-05 \tabularnewline
4 & 0.411173 & 3.5131 & 0.000382 \tabularnewline
5 & 0.42255 & 3.6103 & 0.000279 \tabularnewline
6 & 0.31863 & 2.7224 & 0.004051 \tabularnewline
7 & 0.269736 & 2.3046 & 0.012017 \tabularnewline
8 & 0.190791 & 1.6301 & 0.053692 \tabularnewline
9 & 0.276779 & 2.3648 & 0.01035 \tabularnewline
10 & 0.052203 & 0.446 & 0.328451 \tabularnewline
11 & 0.105053 & 0.8976 & 0.186181 \tabularnewline
12 & 0.011587 & 0.099 & 0.460704 \tabularnewline
13 & 0.052621 & 0.4496 & 0.327167 \tabularnewline
14 & 0.061156 & 0.5225 & 0.301445 \tabularnewline
15 & 0.03548 & 0.3031 & 0.381322 \tabularnewline
16 & 0.017592 & 0.1503 & 0.44047 \tabularnewline
17 & -0.035278 & -0.3014 & 0.381978 \tabularnewline
18 & 0.071281 & 0.609 & 0.272198 \tabularnewline
19 & -0.165435 & -1.4135 & 0.080883 \tabularnewline
20 & -0.084434 & -0.7214 & 0.236483 \tabularnewline
21 & -0.1009 & -0.8621 & 0.19573 \tabularnewline
22 & -0.157836 & -1.3486 & 0.090825 \tabularnewline
23 & -0.054656 & -0.467 & 0.320953 \tabularnewline
24 & -0.246051 & -2.1023 & 0.01949 \tabularnewline
25 & -0.200041 & -1.7092 & 0.045836 \tabularnewline
26 & -0.204963 & -1.7512 & 0.042055 \tabularnewline
27 & -0.241701 & -2.0651 & 0.021233 \tabularnewline
28 & -0.295188 & -2.5221 & 0.006923 \tabularnewline
29 & -0.169675 & -1.4497 & 0.075712 \tabularnewline
30 & -0.312024 & -2.6659 & 0.004724 \tabularnewline
31 & -0.212905 & -1.8191 & 0.036502 \tabularnewline
32 & -0.221993 & -1.8967 & 0.030911 \tabularnewline
33 & -0.3173 & -2.711 & 0.004179 \tabularnewline
34 & -0.26674 & -2.279 & 0.012795 \tabularnewline
35 & -0.30235 & -2.5833 & 0.005894 \tabularnewline
36 & -0.249356 & -2.1305 & 0.01825 \tabularnewline
\hline
\end{tabular}
%Source: https://freestatistics.org/blog/index.php?pk=28522&T=1

[TABLE]
[ROW][C]Autocorrelation Function[/C][/ROW]
[ROW][C]Time lag k[/C][C]ACF(k)[/C][C]T-STAT[/C][C]P-value[/C][/ROW]
[ROW][C]1[/C][C]0.479203[/C][C]4.0943[/C][C]5.4e-05[/C][/ROW]
[ROW][C]2[/C][C]0.582162[/C][C]4.974[/C][C]2e-06[/C][/ROW]
[ROW][C]3[/C][C]0.528618[/C][C]4.5165[/C][C]1.2e-05[/C][/ROW]
[ROW][C]4[/C][C]0.411173[/C][C]3.5131[/C][C]0.000382[/C][/ROW]
[ROW][C]5[/C][C]0.42255[/C][C]3.6103[/C][C]0.000279[/C][/ROW]
[ROW][C]6[/C][C]0.31863[/C][C]2.7224[/C][C]0.004051[/C][/ROW]
[ROW][C]7[/C][C]0.269736[/C][C]2.3046[/C][C]0.012017[/C][/ROW]
[ROW][C]8[/C][C]0.190791[/C][C]1.6301[/C][C]0.053692[/C][/ROW]
[ROW][C]9[/C][C]0.276779[/C][C]2.3648[/C][C]0.01035[/C][/ROW]
[ROW][C]10[/C][C]0.052203[/C][C]0.446[/C][C]0.328451[/C][/ROW]
[ROW][C]11[/C][C]0.105053[/C][C]0.8976[/C][C]0.186181[/C][/ROW]
[ROW][C]12[/C][C]0.011587[/C][C]0.099[/C][C]0.460704[/C][/ROW]
[ROW][C]13[/C][C]0.052621[/C][C]0.4496[/C][C]0.327167[/C][/ROW]
[ROW][C]14[/C][C]0.061156[/C][C]0.5225[/C][C]0.301445[/C][/ROW]
[ROW][C]15[/C][C]0.03548[/C][C]0.3031[/C][C]0.381322[/C][/ROW]
[ROW][C]16[/C][C]0.017592[/C][C]0.1503[/C][C]0.44047[/C][/ROW]
[ROW][C]17[/C][C]-0.035278[/C][C]-0.3014[/C][C]0.381978[/C][/ROW]
[ROW][C]18[/C][C]0.071281[/C][C]0.609[/C][C]0.272198[/C][/ROW]
[ROW][C]19[/C][C]-0.165435[/C][C]-1.4135[/C][C]0.080883[/C][/ROW]
[ROW][C]20[/C][C]-0.084434[/C][C]-0.7214[/C][C]0.236483[/C][/ROW]
[ROW][C]21[/C][C]-0.1009[/C][C]-0.8621[/C][C]0.19573[/C][/ROW]
[ROW][C]22[/C][C]-0.157836[/C][C]-1.3486[/C][C]0.090825[/C][/ROW]
[ROW][C]23[/C][C]-0.054656[/C][C]-0.467[/C][C]0.320953[/C][/ROW]
[ROW][C]24[/C][C]-0.246051[/C][C]-2.1023[/C][C]0.01949[/C][/ROW]
[ROW][C]25[/C][C]-0.200041[/C][C]-1.7092[/C][C]0.045836[/C][/ROW]
[ROW][C]26[/C][C]-0.204963[/C][C]-1.7512[/C][C]0.042055[/C][/ROW]
[ROW][C]27[/C][C]-0.241701[/C][C]-2.0651[/C][C]0.021233[/C][/ROW]
[ROW][C]28[/C][C]-0.295188[/C][C]-2.5221[/C][C]0.006923[/C][/ROW]
[ROW][C]29[/C][C]-0.169675[/C][C]-1.4497[/C][C]0.075712[/C][/ROW]
[ROW][C]30[/C][C]-0.312024[/C][C]-2.6659[/C][C]0.004724[/C][/ROW]
[ROW][C]31[/C][C]-0.212905[/C][C]-1.8191[/C][C]0.036502[/C][/ROW]
[ROW][C]32[/C][C]-0.221993[/C][C]-1.8967[/C][C]0.030911[/C][/ROW]
[ROW][C]33[/C][C]-0.3173[/C][C]-2.711[/C][C]0.004179[/C][/ROW]
[ROW][C]34[/C][C]-0.26674[/C][C]-2.279[/C][C]0.012795[/C][/ROW]
[ROW][C]35[/C][C]-0.30235[/C][C]-2.5833[/C][C]0.005894[/C][/ROW]
[ROW][C]36[/C][C]-0.249356[/C][C]-2.1305[/C][C]0.01825[/C][/ROW]
[/TABLE]
Source: https://freestatistics.org/blog/index.php?pk=28522&T=1

Globally Unique Identifier (entire table): ba.freestatistics.org/blog/index.php?pk=28522&T=1

As an alternative you can also use a QR Code:  

The GUIDs for individual cells are displayed in the table below:

Autocorrelation Function
Time lag kACF(k)T-STATP-value
10.4792034.09435.4e-05
20.5821624.9742e-06
30.5286184.51651.2e-05
40.4111733.51310.000382
50.422553.61030.000279
60.318632.72240.004051
70.2697362.30460.012017
80.1907911.63010.053692
90.2767792.36480.01035
100.0522030.4460.328451
110.1050530.89760.186181
120.0115870.0990.460704
130.0526210.44960.327167
140.0611560.52250.301445
150.035480.30310.381322
160.0175920.15030.44047
17-0.035278-0.30140.381978
180.0712810.6090.272198
19-0.165435-1.41350.080883
20-0.084434-0.72140.236483
21-0.1009-0.86210.19573
22-0.157836-1.34860.090825
23-0.054656-0.4670.320953
24-0.246051-2.10230.01949
25-0.200041-1.70920.045836
26-0.204963-1.75120.042055
27-0.241701-2.06510.021233
28-0.295188-2.52210.006923
29-0.169675-1.44970.075712
30-0.312024-2.66590.004724
31-0.212905-1.81910.036502
32-0.221993-1.89670.030911
33-0.3173-2.7110.004179
34-0.26674-2.2790.012795
35-0.30235-2.58330.005894
36-0.249356-2.13050.01825


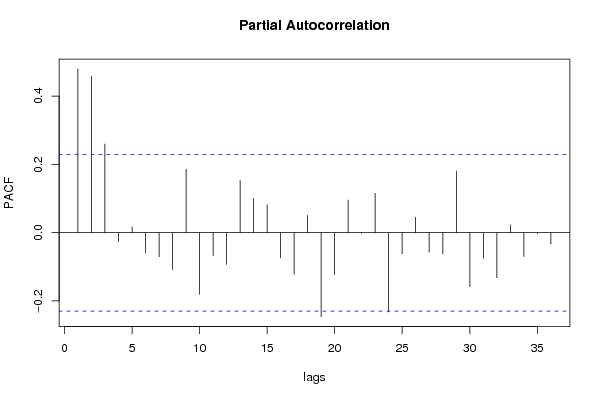
Partial Autocorrelation Function
Time lag kPACF(k)T-STATP-value
10.4792034.09435.4e-05
20.457613.90980.000102
30.2594512.21680.014878
4-0.026293-0.22460.411441
50.0165810.14170.443866
6-0.059493-0.50830.306386
7-0.070399-0.60150.274689
8-0.10823-0.92470.17908
90.1856221.5860.058536
10-0.180452-1.54180.063725
11-0.067149-0.57370.283959
12-0.092846-0.79330.215094
130.1525961.30380.098203
140.0999950.85440.197851
150.0813320.69490.244662
16-0.073572-0.62860.265787
17-0.122094-1.04320.150156
180.050470.43120.333791
19-0.245938-2.10130.019534
20-0.123147-1.05220.148096
210.0951980.81340.209324
22-0.002078-0.01780.492941
230.1151430.98380.164236
24-0.232281-1.98460.025473
25-0.061642-0.52670.300008
260.0452970.3870.349933
27-0.056737-0.48480.314648
28-0.062296-0.53230.298084
290.1807351.54420.063432
30-0.158176-1.35150.090361
31-0.075446-0.64460.260599
32-0.131699-1.12520.132087
330.0226970.19390.423388
34-0.069843-0.59670.276263
35-0.00344-0.02940.488315
36-0.03336-0.2850.388216

\begin{tabular}{lllllllll}
\hline
Partial Autocorrelation Function \tabularnewline
Time lag k & PACF(k) & T-STAT & P-value \tabularnewline
1 & 0.479203 & 4.0943 & 5.4e-05 \tabularnewline
2 & 0.45761 & 3.9098 & 0.000102 \tabularnewline
3 & 0.259451 & 2.2168 & 0.014878 \tabularnewline
4 & -0.026293 & -0.2246 & 0.411441 \tabularnewline
5 & 0.016581 & 0.1417 & 0.443866 \tabularnewline
6 & -0.059493 & -0.5083 & 0.306386 \tabularnewline
7 & -0.070399 & -0.6015 & 0.274689 \tabularnewline
8 & -0.10823 & -0.9247 & 0.17908 \tabularnewline
9 & 0.185622 & 1.586 & 0.058536 \tabularnewline
10 & -0.180452 & -1.5418 & 0.063725 \tabularnewline
11 & -0.067149 & -0.5737 & 0.283959 \tabularnewline
12 & -0.092846 & -0.7933 & 0.215094 \tabularnewline
13 & 0.152596 & 1.3038 & 0.098203 \tabularnewline
14 & 0.099995 & 0.8544 & 0.197851 \tabularnewline
15 & 0.081332 & 0.6949 & 0.244662 \tabularnewline
16 & -0.073572 & -0.6286 & 0.265787 \tabularnewline
17 & -0.122094 & -1.0432 & 0.150156 \tabularnewline
18 & 0.05047 & 0.4312 & 0.333791 \tabularnewline
19 & -0.245938 & -2.1013 & 0.019534 \tabularnewline
20 & -0.123147 & -1.0522 & 0.148096 \tabularnewline
21 & 0.095198 & 0.8134 & 0.209324 \tabularnewline
22 & -0.002078 & -0.0178 & 0.492941 \tabularnewline
23 & 0.115143 & 0.9838 & 0.164236 \tabularnewline
24 & -0.232281 & -1.9846 & 0.025473 \tabularnewline
25 & -0.061642 & -0.5267 & 0.300008 \tabularnewline
26 & 0.045297 & 0.387 & 0.349933 \tabularnewline
27 & -0.056737 & -0.4848 & 0.314648 \tabularnewline
28 & -0.062296 & -0.5323 & 0.298084 \tabularnewline
29 & 0.180735 & 1.5442 & 0.063432 \tabularnewline
30 & -0.158176 & -1.3515 & 0.090361 \tabularnewline
31 & -0.075446 & -0.6446 & 0.260599 \tabularnewline
32 & -0.131699 & -1.1252 & 0.132087 \tabularnewline
33 & 0.022697 & 0.1939 & 0.423388 \tabularnewline
34 & -0.069843 & -0.5967 & 0.276263 \tabularnewline
35 & -0.00344 & -0.0294 & 0.488315 \tabularnewline
36 & -0.03336 & -0.285 & 0.388216 \tabularnewline
\hline
\end{tabular}
%Source: https://freestatistics.org/blog/index.php?pk=28522&T=2

[TABLE]
[ROW][C]Partial Autocorrelation Function[/C][/ROW]
[ROW][C]Time lag k[/C][C]PACF(k)[/C][C]T-STAT[/C][C]P-value[/C][/ROW]
[ROW][C]1[/C][C]0.479203[/C][C]4.0943[/C][C]5.4e-05[/C][/ROW]
[ROW][C]2[/C][C]0.45761[/C][C]3.9098[/C][C]0.000102[/C][/ROW]
[ROW][C]3[/C][C]0.259451[/C][C]2.2168[/C][C]0.014878[/C][/ROW]
[ROW][C]4[/C][C]-0.026293[/C][C]-0.2246[/C][C]0.411441[/C][/ROW]
[ROW][C]5[/C][C]0.016581[/C][C]0.1417[/C][C]0.443866[/C][/ROW]
[ROW][C]6[/C][C]-0.059493[/C][C]-0.5083[/C][C]0.306386[/C][/ROW]
[ROW][C]7[/C][C]-0.070399[/C][C]-0.6015[/C][C]0.274689[/C][/ROW]
[ROW][C]8[/C][C]-0.10823[/C][C]-0.9247[/C][C]0.17908[/C][/ROW]
[ROW][C]9[/C][C]0.185622[/C][C]1.586[/C][C]0.058536[/C][/ROW]
[ROW][C]10[/C][C]-0.180452[/C][C]-1.5418[/C][C]0.063725[/C][/ROW]
[ROW][C]11[/C][C]-0.067149[/C][C]-0.5737[/C][C]0.283959[/C][/ROW]
[ROW][C]12[/C][C]-0.092846[/C][C]-0.7933[/C][C]0.215094[/C][/ROW]
[ROW][C]13[/C][C]0.152596[/C][C]1.3038[/C][C]0.098203[/C][/ROW]
[ROW][C]14[/C][C]0.099995[/C][C]0.8544[/C][C]0.197851[/C][/ROW]
[ROW][C]15[/C][C]0.081332[/C][C]0.6949[/C][C]0.244662[/C][/ROW]
[ROW][C]16[/C][C]-0.073572[/C][C]-0.6286[/C][C]0.265787[/C][/ROW]
[ROW][C]17[/C][C]-0.122094[/C][C]-1.0432[/C][C]0.150156[/C][/ROW]
[ROW][C]18[/C][C]0.05047[/C][C]0.4312[/C][C]0.333791[/C][/ROW]
[ROW][C]19[/C][C]-0.245938[/C][C]-2.1013[/C][C]0.019534[/C][/ROW]
[ROW][C]20[/C][C]-0.123147[/C][C]-1.0522[/C][C]0.148096[/C][/ROW]
[ROW][C]21[/C][C]0.095198[/C][C]0.8134[/C][C]0.209324[/C][/ROW]
[ROW][C]22[/C][C]-0.002078[/C][C]-0.0178[/C][C]0.492941[/C][/ROW]
[ROW][C]23[/C][C]0.115143[/C][C]0.9838[/C][C]0.164236[/C][/ROW]
[ROW][C]24[/C][C]-0.232281[/C][C]-1.9846[/C][C]0.025473[/C][/ROW]
[ROW][C]25[/C][C]-0.061642[/C][C]-0.5267[/C][C]0.300008[/C][/ROW]
[ROW][C]26[/C][C]0.045297[/C][C]0.387[/C][C]0.349933[/C][/ROW]
[ROW][C]27[/C][C]-0.056737[/C][C]-0.4848[/C][C]0.314648[/C][/ROW]
[ROW][C]28[/C][C]-0.062296[/C][C]-0.5323[/C][C]0.298084[/C][/ROW]
[ROW][C]29[/C][C]0.180735[/C][C]1.5442[/C][C]0.063432[/C][/ROW]
[ROW][C]30[/C][C]-0.158176[/C][C]-1.3515[/C][C]0.090361[/C][/ROW]
[ROW][C]31[/C][C]-0.075446[/C][C]-0.6446[/C][C]0.260599[/C][/ROW]
[ROW][C]32[/C][C]-0.131699[/C][C]-1.1252[/C][C]0.132087[/C][/ROW]
[ROW][C]33[/C][C]0.022697[/C][C]0.1939[/C][C]0.423388[/C][/ROW]
[ROW][C]34[/C][C]-0.069843[/C][C]-0.5967[/C][C]0.276263[/C][/ROW]
[ROW][C]35[/C][C]-0.00344[/C][C]-0.0294[/C][C]0.488315[/C][/ROW]
[ROW][C]36[/C][C]-0.03336[/C][C]-0.285[/C][C]0.388216[/C][/ROW]
[/TABLE]
Source: https://freestatistics.org/blog/index.php?pk=28522&T=2

Globally Unique Identifier (entire table): ba.freestatistics.org/blog/index.php?pk=28522&T=2

As an alternative you can also use a QR Code:  

The GUIDs for individual cells are displayed in the table below:

Partial Autocorrelation Function
Time lag kPACF(k)T-STATP-value
10.4792034.09435.4e-05
20.457613.90980.000102
30.2594512.21680.014878
4-0.026293-0.22460.411441
50.0165810.14170.443866
6-0.059493-0.50830.306386
7-0.070399-0.60150.274689
8-0.10823-0.92470.17908
90.1856221.5860.058536
10-0.180452-1.54180.063725
11-0.067149-0.57370.283959
12-0.092846-0.79330.215094
130.1525961.30380.098203
140.0999950.85440.197851
150.0813320.69490.244662
16-0.073572-0.62860.265787
17-0.122094-1.04320.150156
180.050470.43120.333791
19-0.245938-2.10130.019534
20-0.123147-1.05220.148096
210.0951980.81340.209324
22-0.002078-0.01780.492941
230.1151430.98380.164236
24-0.232281-1.98460.025473
25-0.061642-0.52670.300008
260.0452970.3870.349933
27-0.056737-0.48480.314648
28-0.062296-0.53230.298084
290.1807351.54420.063432
30-0.158176-1.35150.090361
31-0.075446-0.64460.260599
32-0.131699-1.12520.132087
330.0226970.19390.423388
34-0.069843-0.59670.276263
35-0.00344-0.02940.488315
36-0.03336-0.2850.388216


Parameters (Session):
par1 = Airline ; par2 = Box-Jenkins ; par3 = Airline Passengers ;
Parameters (R input):
par1 = 36 ; par2 = 1.0 ; par3 = 0 ; par4 = 1 ; par5 = 12 ;
R code (references can be found in the software module):
if (par1 == 'Default') {
par1 = 10*log10(length(x))
} else {
par1 <- as.numeric(par1)
}
par2 <- as.numeric(par2)
par3 <- as.numeric(par3)
par4 <- as.numeric(par4)
par5 <- as.numeric(par5)
if (par2 == 0) {
x <- log(x)
} else {
x <- (x ^ par2 - 1) / par2
}
if (par3 > 0) x <- diff(x,lag=1,difference=par3)
if (par4 > 0) x <- diff(x,lag=par5,difference=par4)
bitmap(file='pic1.png')
racf <- acf(x,par1,main='Autocorrelation',xlab='lags',ylab='ACF')
dev.off()
bitmap(file='pic2.png')
rpacf <- pacf(x,par1,main='Partial Autocorrelation',xlab='lags',ylab='PACF')
dev.off()
(myacf <- c(racf$acf))
(mypacf <- c(rpacf$acf))
lengthx <- length(x)
sqrtn <- sqrt(lengthx)
load(file='createtable')
a<-table.start()
a<-table.row.start(a)
a<-table.element(a,'Autocorrelation Function',4,TRUE)
a<-table.row.end(a)
a<-table.row.start(a)
a<-table.element(a,'Time lag k',header=TRUE)
a<-table.element(a,hyperlink('basics.htm','ACF(k)','click here for more information about the Autocorrelation Function'),header=TRUE)
a<-table.element(a,'T-STAT',header=TRUE)
a<-table.element(a,'P-value',header=TRUE)
a<-table.row.end(a)
for (i in 2:(par1+1)) {
a<-table.row.start(a)
a<-table.element(a,i-1,header=TRUE)
a<-table.element(a,round(myacf[i],6))
mytstat <- myacf[i]*sqrtn
a<-table.element(a,round(mytstat,4))
a<-table.element(a,round(1-pt(abs(mytstat),lengthx),6))
a<-table.row.end(a)
}
a<-table.end(a)
table.save(a,file='mytable.tab')
a<-table.start()
a<-table.row.start(a)
a<-table.element(a,'Partial Autocorrelation Function',4,TRUE)
a<-table.row.end(a)
a<-table.row.start(a)
a<-table.element(a,'Time lag k',header=TRUE)
a<-table.element(a,hyperlink('basics.htm','PACF(k)','click here for more information about the Partial Autocorrelation Function'),header=TRUE)
a<-table.element(a,'T-STAT',header=TRUE)
a<-table.element(a,'P-value',header=TRUE)
a<-table.row.end(a)
for (i in 1:par1) {
a<-table.row.start(a)
a<-table.element(a,i,header=TRUE)
a<-table.element(a,round(mypacf[i],6))
mytstat <- mypacf[i]*sqrtn
a<-table.element(a,round(mytstat,4))
a<-table.element(a,round(1-pt(abs(mytstat),lengthx),6))
a<-table.row.end(a)
}
a<-table.end(a)
table.save(a,file='mytable1.tab')