Free Statistics

of Irreproducible Research!

Author's title

Author*The author of this computation has been verified*
R Software Modulerwasp_cross.wasp
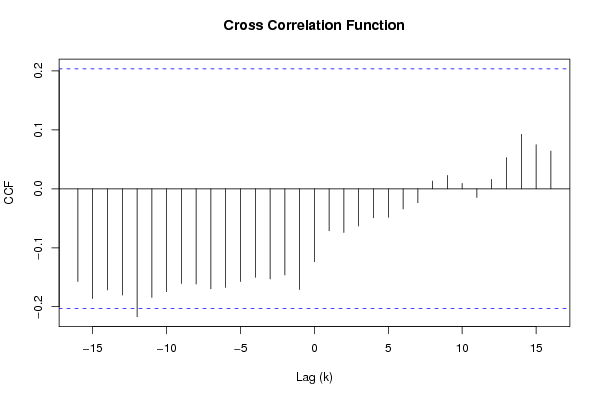
Title produced by softwareCross Correlation Function
Date of computationTue, 02 Dec 2008 15:44:25 -0700
Cite this page as followsStatistical Computations at FreeStatistics.org, Office for Research Development and Education, URL https://freestatistics.org/blog/index.php?v=date/2008/Dec/02/t1228257945nqhui67jlv4ff4g.htm/, Retrieved Sun, 19 May 2024 08:55:53 +0000
Statistical Computations at FreeStatistics.org, Office for Research Development and Education, URL https://freestatistics.org/blog/index.php?pk=28519, Retrieved Sun, 19 May 2024 08:55:53 +0000
QR Codes:

Original text written by user:
IsPrivate?No (this computation is public)
User-defined keywords
Estimated Impact148
Family? (F = Feedback message, R = changed R code, M = changed R Module, P = changed Parameters, D = changed Data)
F     [Cross Correlation Function] [Q7] [2008-12-02 22:28:18] [5262baed313b307078ce11eb68e9efe6]
F   P     [Cross Correlation Function] [Q8] [2008-12-02 22:44:25] [5bd06487453d0eec7a1bf04bf9f25085] [Current]
Feedback Forum
2008-12-04 10:42:09 [72e979bcc364082694890d2eccc1a66f] [reply
De student heeft deze vraag foutief beantwoord. Er werd ook een verkeerde software gebruikt.
We moeten hier ten eerste gebruik maken van de Variance reduction matrix. Hier zoeken we naar de kleinste variantie wat ons dan op de juiste waarde van d en D wijst.
Ten tweede moeten we dan gebruik maken van de Standard deviation mean plot. Hieruit kunnen we dan de lambda-waarde bepalen.
  2008-12-04 10:45:35 [72e979bcc364082694890d2eccc1a66f] [reply
Dezelfde link werd weergegeven in de volgende opdracht. De student geeft geen argumentatie.
2008-12-07 17:09:20 [Jolien Van Landeghem] [reply
Deze vraag werd fout beantwoord. Je moet hier de lambda waarde zoeken voor beide tijdreeksen zodat eventuele heteroskedasticiteit kan worden weggewerkt. Vervolgens moet je (zoals in voorgaande oefeningen) de seizoenale en niet seizoenale differentiewaarde vinden om de tijdreeks stationair te maken. Je maakt eerst de plots zonder dat je de lambda parameter en de differentiewaarden invult, en daarna vul je deze parameters in om vast te stellen of er al dan niet verbetering is in de stationariteit. (Je kan heteroskedasticiteit ook vaststellen adhv de p value , indien deze kleiner is dan 0.05 is er sprake van heteroskedasticiteit)
2008-12-07 17:13:01 [Jolien Van Landeghem] [reply
Q9: niet correct. Je ziet dat er in jou geval sprake was van valse correlatie: als de streepjes binnen het betrouwbaarheidsinterval liggen (dit heeft niets met betrouwbaarheid te maken zoals je beweerde) wil dit zeggen dat de verschillen niet significant zijn: y kan niet verklaard worden adhv x er is geen significante correlatie. Bij de vorige Cross Correlation lagen er veel waarden buiten het betrouwbaarheidsinterval: verschillen waren daar wél signifiant verschillend van 0 en er was wél correlatie.
2008-12-08 18:24:46 [Hannes Van Hoof] [reply
Om deze vraag correct te beantwoorden, kon je de variance reduction matrix gebruiken. Hier kan je controleren welke differentiatie de beste is om de reeks stationair te maken.
Om de de lambda waarde te zoeken moet je gebruik maken van de standard deviation mean plot.
Deze oef kon dus eigelijk gemaakt worden op dezelfde manier als bij de vorige vragen.
2008-12-08 18:28:04 [Hannes Van Hoof] [reply
q9
De cross correlation function grafiek geeft weer dat de de reeksen nog niet stationair zijn, aangezien er nog een trend aanwezig is.

Post a new message
Dataseries X:
116
111
104
100
93
91
119
139
134
124
113
109
109
106
101
98
93
91
122
139
140
132
117
114
113
110
107
103
98
98
137
148
147
139
130
128
127
123
118
114
108
111
151
159
158
148
138
137
136
133
126
120
114
116
153
162
161
149
139
135
130
127
122
117
112
113
149
157
157
147
137
132
125
123
117
114
111
112
144
150
149
134
123
116
117
111
105
102
95
93
124
130
124
115
106
105
105
101
95
93
84
87
116
120
117
109
Dataseries Y:
377
370
358
357
349
348
369
381
368
361
351
351
358
354
347
345
343
340
362
370
373
371
354
357
363
364
363
358
357
357
380
378
376
380
379
384
392
394
392
396
392
396
419
421
420
418
410
418
426
428
430
424
423
427
441
449
452
462
455
461
461
463
462
456
455
456
472
472
471
465
459
465
468
467
463
460
462
461
476
476
471
453
443
442
444
438
427
424
416
406
431
434
418
412
404
409
412
406
398
397
385
390
413
413
401
397


Summary of computational transaction
Raw Inputview raw input (R code)
Raw Outputview raw output of R engine
Computing time1 seconds
R Server'George Udny Yule' @ 72.249.76.132

\begin{tabular}{lllllllll}
\hline
Summary of computational transaction \tabularnewline
Raw Input & view raw input (R code)  \tabularnewline
Raw Output & view raw output of R engine  \tabularnewline
Computing time & 1 seconds \tabularnewline
R Server & 'George Udny Yule' @ 72.249.76.132 \tabularnewline
\hline
\end{tabular}
%Source: https://freestatistics.org/blog/index.php?pk=28519&T=0

[TABLE]
[ROW][C]Summary of computational transaction[/C][/ROW]
[ROW][C]Raw Input[/C][C]view raw input (R code) [/C][/ROW]
[ROW][C]Raw Output[/C][C]view raw output of R engine [/C][/ROW]
[ROW][C]Computing time[/C][C]1 seconds[/C][/ROW]
[ROW][C]R Server[/C][C]'George Udny Yule' @ 72.249.76.132[/C][/ROW]
[/TABLE]
Source: https://freestatistics.org/blog/index.php?pk=28519&T=0

Globally Unique Identifier (entire table): ba.freestatistics.org/blog/index.php?pk=28519&T=0

As an alternative you can also use a QR Code:  

The GUIDs for individual cells are displayed in the table below:

Summary of computational transaction
Raw Inputview raw input (R code)
Raw Outputview raw output of R engine
Computing time1 seconds
R Server'George Udny Yule' @ 72.249.76.132


Cross Correlation Function
ParameterValue
Box-Cox transformation parameter (lambda) of X series1
Degree of non-seasonal differencing (d) of X series1
Degree of seasonal differencing (D) of X series1
Seasonal Period (s)12
Box-Cox transformation parameter (lambda) of Y series1
Degree of non-seasonal differencing (d) of Y series0
Degree of seasonal differencing (D) of Y series0
krho(Y[t],X[t+k])
-16-0.157189463069684
-15-0.186174733149298
-14-0.171582725372604
-13-0.180306783602521
-12-0.216846039794330
-11-0.184179898201758
-10-0.174408532930019
-9-0.160668175355435
-8-0.161668925302796
-7-0.169606844884612
-6-0.167228206515202
-5-0.157405439870318
-4-0.150156773362933
-3-0.152903154257101
-2-0.146089887616355
-1-0.170812875205178
0-0.123544712159171
1-0.0712222108016524
2-0.074091681891094
3-0.0630979002823027
4-0.0493113107326314
5-0.0484617412945208
6-0.0342760352004293
7-0.0236854016163049
80.0131219480119079
90.0226351685001101
100.00914577057088077
11-0.0146228941172928
120.0159709365807414
130.0530564583459744
140.092314947964162
150.074753754985797
160.0640259210255359

\begin{tabular}{lllllllll}
\hline
Cross Correlation Function \tabularnewline
Parameter & Value \tabularnewline
Box-Cox transformation parameter (lambda) of X series & 1 \tabularnewline
Degree of non-seasonal differencing (d) of X series & 1 \tabularnewline
Degree of seasonal differencing (D) of X series & 1 \tabularnewline
Seasonal Period (s) & 12 \tabularnewline
Box-Cox transformation parameter (lambda) of Y series & 1 \tabularnewline
Degree of non-seasonal differencing (d) of Y series & 0 \tabularnewline
Degree of seasonal differencing (D) of Y series & 0 \tabularnewline
k & rho(Y[t],X[t+k]) \tabularnewline
-16 & -0.157189463069684 \tabularnewline
-15 & -0.186174733149298 \tabularnewline
-14 & -0.171582725372604 \tabularnewline
-13 & -0.180306783602521 \tabularnewline
-12 & -0.216846039794330 \tabularnewline
-11 & -0.184179898201758 \tabularnewline
-10 & -0.174408532930019 \tabularnewline
-9 & -0.160668175355435 \tabularnewline
-8 & -0.161668925302796 \tabularnewline
-7 & -0.169606844884612 \tabularnewline
-6 & -0.167228206515202 \tabularnewline
-5 & -0.157405439870318 \tabularnewline
-4 & -0.150156773362933 \tabularnewline
-3 & -0.152903154257101 \tabularnewline
-2 & -0.146089887616355 \tabularnewline
-1 & -0.170812875205178 \tabularnewline
0 & -0.123544712159171 \tabularnewline
1 & -0.0712222108016524 \tabularnewline
2 & -0.074091681891094 \tabularnewline
3 & -0.0630979002823027 \tabularnewline
4 & -0.0493113107326314 \tabularnewline
5 & -0.0484617412945208 \tabularnewline
6 & -0.0342760352004293 \tabularnewline
7 & -0.0236854016163049 \tabularnewline
8 & 0.0131219480119079 \tabularnewline
9 & 0.0226351685001101 \tabularnewline
10 & 0.00914577057088077 \tabularnewline
11 & -0.0146228941172928 \tabularnewline
12 & 0.0159709365807414 \tabularnewline
13 & 0.0530564583459744 \tabularnewline
14 & 0.092314947964162 \tabularnewline
15 & 0.074753754985797 \tabularnewline
16 & 0.0640259210255359 \tabularnewline
\hline
\end{tabular}
%Source: https://freestatistics.org/blog/index.php?pk=28519&T=1

[TABLE]
[ROW][C]Cross Correlation Function[/C][/ROW]
[ROW][C]Parameter[/C][C]Value[/C][/ROW]
[ROW][C]Box-Cox transformation parameter (lambda) of X series[/C][C]1[/C][/ROW]
[ROW][C]Degree of non-seasonal differencing (d) of X series[/C][C]1[/C][/ROW]
[ROW][C]Degree of seasonal differencing (D) of X series[/C][C]1[/C][/ROW]
[ROW][C]Seasonal Period (s)[/C][C]12[/C][/ROW]
[ROW][C]Box-Cox transformation parameter (lambda) of Y series[/C][C]1[/C][/ROW]
[ROW][C]Degree of non-seasonal differencing (d) of Y series[/C][C]0[/C][/ROW]
[ROW][C]Degree of seasonal differencing (D) of Y series[/C][C]0[/C][/ROW]
[ROW][C]k[/C][C]rho(Y[t],X[t+k])[/C][/ROW]
[ROW][C]-16[/C][C]-0.157189463069684[/C][/ROW]
[ROW][C]-15[/C][C]-0.186174733149298[/C][/ROW]
[ROW][C]-14[/C][C]-0.171582725372604[/C][/ROW]
[ROW][C]-13[/C][C]-0.180306783602521[/C][/ROW]
[ROW][C]-12[/C][C]-0.216846039794330[/C][/ROW]
[ROW][C]-11[/C][C]-0.184179898201758[/C][/ROW]
[ROW][C]-10[/C][C]-0.174408532930019[/C][/ROW]
[ROW][C]-9[/C][C]-0.160668175355435[/C][/ROW]
[ROW][C]-8[/C][C]-0.161668925302796[/C][/ROW]
[ROW][C]-7[/C][C]-0.169606844884612[/C][/ROW]
[ROW][C]-6[/C][C]-0.167228206515202[/C][/ROW]
[ROW][C]-5[/C][C]-0.157405439870318[/C][/ROW]
[ROW][C]-4[/C][C]-0.150156773362933[/C][/ROW]
[ROW][C]-3[/C][C]-0.152903154257101[/C][/ROW]
[ROW][C]-2[/C][C]-0.146089887616355[/C][/ROW]
[ROW][C]-1[/C][C]-0.170812875205178[/C][/ROW]
[ROW][C]0[/C][C]-0.123544712159171[/C][/ROW]
[ROW][C]1[/C][C]-0.0712222108016524[/C][/ROW]
[ROW][C]2[/C][C]-0.074091681891094[/C][/ROW]
[ROW][C]3[/C][C]-0.0630979002823027[/C][/ROW]
[ROW][C]4[/C][C]-0.0493113107326314[/C][/ROW]
[ROW][C]5[/C][C]-0.0484617412945208[/C][/ROW]
[ROW][C]6[/C][C]-0.0342760352004293[/C][/ROW]
[ROW][C]7[/C][C]-0.0236854016163049[/C][/ROW]
[ROW][C]8[/C][C]0.0131219480119079[/C][/ROW]
[ROW][C]9[/C][C]0.0226351685001101[/C][/ROW]
[ROW][C]10[/C][C]0.00914577057088077[/C][/ROW]
[ROW][C]11[/C][C]-0.0146228941172928[/C][/ROW]
[ROW][C]12[/C][C]0.0159709365807414[/C][/ROW]
[ROW][C]13[/C][C]0.0530564583459744[/C][/ROW]
[ROW][C]14[/C][C]0.092314947964162[/C][/ROW]
[ROW][C]15[/C][C]0.074753754985797[/C][/ROW]
[ROW][C]16[/C][C]0.0640259210255359[/C][/ROW]
[/TABLE]
Source: https://freestatistics.org/blog/index.php?pk=28519&T=1

Globally Unique Identifier (entire table): ba.freestatistics.org/blog/index.php?pk=28519&T=1

As an alternative you can also use a QR Code:  

The GUIDs for individual cells are displayed in the table below:

Cross Correlation Function
ParameterValue
Box-Cox transformation parameter (lambda) of X series1
Degree of non-seasonal differencing (d) of X series1
Degree of seasonal differencing (D) of X series1
Seasonal Period (s)12
Box-Cox transformation parameter (lambda) of Y series1
Degree of non-seasonal differencing (d) of Y series0
Degree of seasonal differencing (D) of Y series0
krho(Y[t],X[t+k])
-16-0.157189463069684
-15-0.186174733149298
-14-0.171582725372604
-13-0.180306783602521
-12-0.216846039794330
-11-0.184179898201758
-10-0.174408532930019
-9-0.160668175355435
-8-0.161668925302796
-7-0.169606844884612
-6-0.167228206515202
-5-0.157405439870318
-4-0.150156773362933
-3-0.152903154257101
-2-0.146089887616355
-1-0.170812875205178
0-0.123544712159171
1-0.0712222108016524
2-0.074091681891094
3-0.0630979002823027
4-0.0493113107326314
5-0.0484617412945208
6-0.0342760352004293
7-0.0236854016163049
80.0131219480119079
90.0226351685001101
100.00914577057088077
11-0.0146228941172928
120.0159709365807414
130.0530564583459744
140.092314947964162
150.074753754985797
160.0640259210255359


Parameters (Session):
par1 = 1 ; par2 = 1 ; par3 = 1 ; par4 = 12 ; par5 = 1 ; par6 = 0 ; par7 = 0 ;
Parameters (R input):
par1 = 1 ; par2 = 1 ; par3 = 1 ; par4 = 12 ; par5 = 1 ; par6 = 0 ; par7 = 0 ;
R code (references can be found in the software module):
par1 <- as.numeric(par1)
par2 <- as.numeric(par2)
par3 <- as.numeric(par3)
par4 <- as.numeric(par4)
par5 <- as.numeric(par5)
par6 <- as.numeric(par6)
par7 <- as.numeric(par7)
if (par1 == 0) {
x <- log(x)
} else {
x <- (x ^ par1 - 1) / par1
}
if (par5 == 0) {
y <- log(y)
} else {
y <- (y ^ par5 - 1) / par5
}
if (par2 > 0) x <- diff(x,lag=1,difference=par2)
if (par6 > 0) y <- diff(y,lag=1,difference=par6)
if (par3 > 0) x <- diff(x,lag=par4,difference=par3)
if (par7 > 0) y <- diff(y,lag=par4,difference=par7)
x
y
bitmap(file='test1.png')
(r <- ccf(x,y,main='Cross Correlation Function',ylab='CCF',xlab='Lag (k)'))
dev.off()
load(file='createtable')
a<-table.start()
a<-table.row.start(a)
a<-table.element(a,'Cross Correlation Function',2,TRUE)
a<-table.row.end(a)
a<-table.row.start(a)
a<-table.element(a,'Parameter',header=TRUE)
a<-table.element(a,'Value',header=TRUE)
a<-table.row.end(a)
a<-table.row.start(a)
a<-table.element(a,'Box-Cox transformation parameter (lambda) of X series',header=TRUE)
a<-table.element(a,par1)
a<-table.row.end(a)
a<-table.row.start(a)
a<-table.element(a,'Degree of non-seasonal differencing (d) of X series',header=TRUE)
a<-table.element(a,par2)
a<-table.row.end(a)
a<-table.row.start(a)
a<-table.element(a,'Degree of seasonal differencing (D) of X series',header=TRUE)
a<-table.element(a,par3)
a<-table.row.end(a)
a<-table.row.start(a)
a<-table.element(a,'Seasonal Period (s)',header=TRUE)
a<-table.element(a,par4)
a<-table.row.end(a)
a<-table.row.start(a)
a<-table.element(a,'Box-Cox transformation parameter (lambda) of Y series',header=TRUE)
a<-table.element(a,par5)
a<-table.row.end(a)
a<-table.row.start(a)
a<-table.element(a,'Degree of non-seasonal differencing (d) of Y series',header=TRUE)
a<-table.element(a,par6)
a<-table.row.end(a)
a<-table.row.start(a)
a<-table.element(a,'Degree of seasonal differencing (D) of Y series',header=TRUE)
a<-table.element(a,par7)
a<-table.row.end(a)
a<-table.row.start(a)
a<-table.element(a,'k',header=TRUE)
a<-table.element(a,'rho(Y[t],X[t+k])',header=TRUE)
a<-table.row.end(a)
mylength <- length(r$acf)
myhalf <- floor((mylength-1)/2)
for (i in 1:mylength) {
a<-table.row.start(a)
a<-table.element(a,i-myhalf-1,header=TRUE)
a<-table.element(a,r$acf[i])
a<-table.row.end(a)
}
a<-table.end(a)
table.save(a,file='mytable.tab')