Free Statistics

of Irreproducible Research!

Author's title

Author*The author of this computation has been verified*
R Software Modulerwasp_cross.wasp
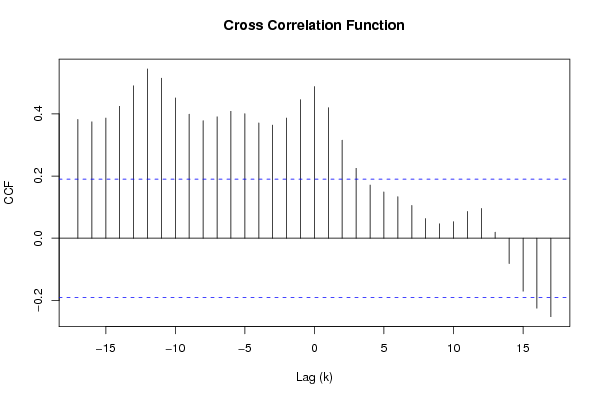
Title produced by softwareCross Correlation Function
Date of computationTue, 02 Dec 2008 15:28:18 -0700
Cite this page as followsStatistical Computations at FreeStatistics.org, Office for Research Development and Education, URL https://freestatistics.org/blog/index.php?v=date/2008/Dec/02/t1228256952i3nfj1jkr1xpv6z.htm/, Retrieved Sun, 19 May 2024 10:47:03 +0000
Statistical Computations at FreeStatistics.org, Office for Research Development and Education, URL https://freestatistics.org/blog/index.php?pk=28514, Retrieved Sun, 19 May 2024 10:47:03 +0000
QR Codes:

Original text written by user:
IsPrivate?No (this computation is public)
User-defined keywords
Estimated Impact142
Family? (F = Feedback message, R = changed R code, M = changed R Module, P = changed Parameters, D = changed Data)
F       [Cross Correlation Function] [Q7] [2008-12-02 22:28:18] [5bd06487453d0eec7a1bf04bf9f25085] [Current]
F   P     [Cross Correlation Function] [Q8] [2008-12-02 22:44:25] [5262baed313b307078ce11eb68e9efe6]
Feedback Forum
2008-12-04 10:38:12 [72e979bcc364082694890d2eccc1a66f] [reply
De stippellijn in deze figuur duidt op het betrouwbaarheidsinterval. De correlaties die er buiten vallen zijn significant verschillende van 0 en kunnen niet toegewezen worden aan het toeval.
2008-12-07 17:05:13 [Jolien Van Landeghem] [reply
Dit is niet helemaal juist. De cross correlatie functie toont inhoeverre een tijdreeks y verklaard kan worden door een tijdreeks x of het verleden van tijdreeks X. Er is hier sprake van een leading indicator (de meeste streepjes liggen links). We stellen vast dat de correlatie het hoogst is indien we de tijdreeks 11 perioden terugschuiven in de tijd (als k=11 steekt de waarde het hoogst boven het betrouwbaarheidsinterval uit). Hou er rekening mee dat je te maken kan krijgen met valse correlatie. Het zou kunnen dat er hier een hoge correlatie wordt weergegeven tussen x en y, maar later bij verdere analyse de variabele z deze correlatie veroorzaakt.
2008-12-08 18:18:28 [Hannes Van Hoof] [reply
De cross correlatie geeft weer in welke mate een tijdsreeks kan verklaard worden door de andere tijdsreeks.
Dit geeft wel niet altijd de juiste oplossing weer, aangezien er ook invloed kan zijn van een andere variabele.

Post a new message
Dataseries X:
116
111
104
100
93
91
119
139
134
124
113
109
109
106
101
98
93
91
122
139
140
132
117
114
113
110
107
103
98
98
137
148
147
139
130
128
127
123
118
114
108
111
151
159
158
148
138
137
136
133
126
120
114
116
153
162
161
149
139
135
130
127
122
117
112
113
149
157
157
147
137
132
125
123
117
114
111
112
144
150
149
134
123
116
117
111
105
102
95
93
124
130
124
115
106
105
105
101
95
93
84
87
116
120
117
109
Dataseries Y:
377
370
358
357
349
348
369
381
368
361
351
351
358
354
347
345
343
340
362
370
373
371
354
357
363
364
363
358
357
357
380
378
376
380
379
384
392
394
392
396
392
396
419
421
420
418
410
418
426
428
430
424
423
427
441
449
452
462
455
461
461
463
462
456
455
456
472
472
471
465
459
465
468
467
463
460
462
461
476
476
471
453
443
442
444
438
427
424
416
406
431
434
418
412
404
409
412
406
398
397
385
390
413
413
401
397


Summary of computational transaction
Raw Inputview raw input (R code)
Raw Outputview raw output of R engine
Computing time1 seconds
R Server'Gwilym Jenkins' @ 72.249.127.135

\begin{tabular}{lllllllll}
\hline
Summary of computational transaction \tabularnewline
Raw Input & view raw input (R code)  \tabularnewline
Raw Output & view raw output of R engine  \tabularnewline
Computing time & 1 seconds \tabularnewline
R Server & 'Gwilym Jenkins' @ 72.249.127.135 \tabularnewline
\hline
\end{tabular}
%Source: https://freestatistics.org/blog/index.php?pk=28514&T=0

[TABLE]
[ROW][C]Summary of computational transaction[/C][/ROW]
[ROW][C]Raw Input[/C][C]view raw input (R code) [/C][/ROW]
[ROW][C]Raw Output[/C][C]view raw output of R engine [/C][/ROW]
[ROW][C]Computing time[/C][C]1 seconds[/C][/ROW]
[ROW][C]R Server[/C][C]'Gwilym Jenkins' @ 72.249.127.135[/C][/ROW]
[/TABLE]
Source: https://freestatistics.org/blog/index.php?pk=28514&T=0

Globally Unique Identifier (entire table): ba.freestatistics.org/blog/index.php?pk=28514&T=0

As an alternative you can also use a QR Code:  

The GUIDs for individual cells are displayed in the table below:

Summary of computational transaction
Raw Inputview raw input (R code)
Raw Outputview raw output of R engine
Computing time1 seconds
R Server'Gwilym Jenkins' @ 72.249.127.135


Cross Correlation Function
ParameterValue
Box-Cox transformation parameter (lambda) of X series1
Degree of non-seasonal differencing (d) of X series0
Degree of seasonal differencing (D) of X series0
Seasonal Period (s)12
Box-Cox transformation parameter (lambda) of Y series1
Degree of non-seasonal differencing (d) of Y series0
Degree of seasonal differencing (D) of Y series0
krho(Y[t],X[t+k])
-170.382222526885550
-160.374456453638275
-150.386524433702781
-140.424356351306065
-130.490078331660924
-120.544467252062405
-110.514672604181148
-100.451208013096301
-90.398882517613551
-80.378073832427111
-70.390383712577693
-60.40806707168237
-50.400623453938911
-40.370871480553264
-30.363794629639201
-20.386569932943371
-10.445599032473009
00.487907329291163
10.420064601879117
20.315317321412654
30.224958127119553
40.171050668561696
50.148954065112367
60.133661880758977
70.10548386939413
80.0634144328349672
90.046493836495663
100.0532852944130566
110.0861577672174324
120.0959875323058456
130.0196000847919489
14-0.0814301886486534
15-0.170384515162981
16-0.225147334295864
17-0.252197452895912

\begin{tabular}{lllllllll}
\hline
Cross Correlation Function \tabularnewline
Parameter & Value \tabularnewline
Box-Cox transformation parameter (lambda) of X series & 1 \tabularnewline
Degree of non-seasonal differencing (d) of X series & 0 \tabularnewline
Degree of seasonal differencing (D) of X series & 0 \tabularnewline
Seasonal Period (s) & 12 \tabularnewline
Box-Cox transformation parameter (lambda) of Y series & 1 \tabularnewline
Degree of non-seasonal differencing (d) of Y series & 0 \tabularnewline
Degree of seasonal differencing (D) of Y series & 0 \tabularnewline
k & rho(Y[t],X[t+k]) \tabularnewline
-17 & 0.382222526885550 \tabularnewline
-16 & 0.374456453638275 \tabularnewline
-15 & 0.386524433702781 \tabularnewline
-14 & 0.424356351306065 \tabularnewline
-13 & 0.490078331660924 \tabularnewline
-12 & 0.544467252062405 \tabularnewline
-11 & 0.514672604181148 \tabularnewline
-10 & 0.451208013096301 \tabularnewline
-9 & 0.398882517613551 \tabularnewline
-8 & 0.378073832427111 \tabularnewline
-7 & 0.390383712577693 \tabularnewline
-6 & 0.40806707168237 \tabularnewline
-5 & 0.400623453938911 \tabularnewline
-4 & 0.370871480553264 \tabularnewline
-3 & 0.363794629639201 \tabularnewline
-2 & 0.386569932943371 \tabularnewline
-1 & 0.445599032473009 \tabularnewline
0 & 0.487907329291163 \tabularnewline
1 & 0.420064601879117 \tabularnewline
2 & 0.315317321412654 \tabularnewline
3 & 0.224958127119553 \tabularnewline
4 & 0.171050668561696 \tabularnewline
5 & 0.148954065112367 \tabularnewline
6 & 0.133661880758977 \tabularnewline
7 & 0.10548386939413 \tabularnewline
8 & 0.0634144328349672 \tabularnewline
9 & 0.046493836495663 \tabularnewline
10 & 0.0532852944130566 \tabularnewline
11 & 0.0861577672174324 \tabularnewline
12 & 0.0959875323058456 \tabularnewline
13 & 0.0196000847919489 \tabularnewline
14 & -0.0814301886486534 \tabularnewline
15 & -0.170384515162981 \tabularnewline
16 & -0.225147334295864 \tabularnewline
17 & -0.252197452895912 \tabularnewline
\hline
\end{tabular}
%Source: https://freestatistics.org/blog/index.php?pk=28514&T=1

[TABLE]
[ROW][C]Cross Correlation Function[/C][/ROW]
[ROW][C]Parameter[/C][C]Value[/C][/ROW]
[ROW][C]Box-Cox transformation parameter (lambda) of X series[/C][C]1[/C][/ROW]
[ROW][C]Degree of non-seasonal differencing (d) of X series[/C][C]0[/C][/ROW]
[ROW][C]Degree of seasonal differencing (D) of X series[/C][C]0[/C][/ROW]
[ROW][C]Seasonal Period (s)[/C][C]12[/C][/ROW]
[ROW][C]Box-Cox transformation parameter (lambda) of Y series[/C][C]1[/C][/ROW]
[ROW][C]Degree of non-seasonal differencing (d) of Y series[/C][C]0[/C][/ROW]
[ROW][C]Degree of seasonal differencing (D) of Y series[/C][C]0[/C][/ROW]
[ROW][C]k[/C][C]rho(Y[t],X[t+k])[/C][/ROW]
[ROW][C]-17[/C][C]0.382222526885550[/C][/ROW]
[ROW][C]-16[/C][C]0.374456453638275[/C][/ROW]
[ROW][C]-15[/C][C]0.386524433702781[/C][/ROW]
[ROW][C]-14[/C][C]0.424356351306065[/C][/ROW]
[ROW][C]-13[/C][C]0.490078331660924[/C][/ROW]
[ROW][C]-12[/C][C]0.544467252062405[/C][/ROW]
[ROW][C]-11[/C][C]0.514672604181148[/C][/ROW]
[ROW][C]-10[/C][C]0.451208013096301[/C][/ROW]
[ROW][C]-9[/C][C]0.398882517613551[/C][/ROW]
[ROW][C]-8[/C][C]0.378073832427111[/C][/ROW]
[ROW][C]-7[/C][C]0.390383712577693[/C][/ROW]
[ROW][C]-6[/C][C]0.40806707168237[/C][/ROW]
[ROW][C]-5[/C][C]0.400623453938911[/C][/ROW]
[ROW][C]-4[/C][C]0.370871480553264[/C][/ROW]
[ROW][C]-3[/C][C]0.363794629639201[/C][/ROW]
[ROW][C]-2[/C][C]0.386569932943371[/C][/ROW]
[ROW][C]-1[/C][C]0.445599032473009[/C][/ROW]
[ROW][C]0[/C][C]0.487907329291163[/C][/ROW]
[ROW][C]1[/C][C]0.420064601879117[/C][/ROW]
[ROW][C]2[/C][C]0.315317321412654[/C][/ROW]
[ROW][C]3[/C][C]0.224958127119553[/C][/ROW]
[ROW][C]4[/C][C]0.171050668561696[/C][/ROW]
[ROW][C]5[/C][C]0.148954065112367[/C][/ROW]
[ROW][C]6[/C][C]0.133661880758977[/C][/ROW]
[ROW][C]7[/C][C]0.10548386939413[/C][/ROW]
[ROW][C]8[/C][C]0.0634144328349672[/C][/ROW]
[ROW][C]9[/C][C]0.046493836495663[/C][/ROW]
[ROW][C]10[/C][C]0.0532852944130566[/C][/ROW]
[ROW][C]11[/C][C]0.0861577672174324[/C][/ROW]
[ROW][C]12[/C][C]0.0959875323058456[/C][/ROW]
[ROW][C]13[/C][C]0.0196000847919489[/C][/ROW]
[ROW][C]14[/C][C]-0.0814301886486534[/C][/ROW]
[ROW][C]15[/C][C]-0.170384515162981[/C][/ROW]
[ROW][C]16[/C][C]-0.225147334295864[/C][/ROW]
[ROW][C]17[/C][C]-0.252197452895912[/C][/ROW]
[/TABLE]
Source: https://freestatistics.org/blog/index.php?pk=28514&T=1

Globally Unique Identifier (entire table): ba.freestatistics.org/blog/index.php?pk=28514&T=1

As an alternative you can also use a QR Code:  

The GUIDs for individual cells are displayed in the table below:

Cross Correlation Function
ParameterValue
Box-Cox transformation parameter (lambda) of X series1
Degree of non-seasonal differencing (d) of X series0
Degree of seasonal differencing (D) of X series0
Seasonal Period (s)12
Box-Cox transformation parameter (lambda) of Y series1
Degree of non-seasonal differencing (d) of Y series0
Degree of seasonal differencing (D) of Y series0
krho(Y[t],X[t+k])
-170.382222526885550
-160.374456453638275
-150.386524433702781
-140.424356351306065
-130.490078331660924
-120.544467252062405
-110.514672604181148
-100.451208013096301
-90.398882517613551
-80.378073832427111
-70.390383712577693
-60.40806707168237
-50.400623453938911
-40.370871480553264
-30.363794629639201
-20.386569932943371
-10.445599032473009
00.487907329291163
10.420064601879117
20.315317321412654
30.224958127119553
40.171050668561696
50.148954065112367
60.133661880758977
70.10548386939413
80.0634144328349672
90.046493836495663
100.0532852944130566
110.0861577672174324
120.0959875323058456
130.0196000847919489
14-0.0814301886486534
15-0.170384515162981
16-0.225147334295864
17-0.252197452895912


Parameters (Session):
par1 = 1 ; par2 = 0 ; par3 = 0 ; par4 = 12 ; par5 = 1 ; par6 = 0 ; par7 = 0 ;
Parameters (R input):
par1 = 1 ; par2 = 0 ; par3 = 0 ; par4 = 12 ; par5 = 1 ; par6 = 0 ; par7 = 0 ;
R code (references can be found in the software module):
par1 <- as.numeric(par1)
par2 <- as.numeric(par2)
par3 <- as.numeric(par3)
par4 <- as.numeric(par4)
par5 <- as.numeric(par5)
par6 <- as.numeric(par6)
par7 <- as.numeric(par7)
if (par1 == 0) {
x <- log(x)
} else {
x <- (x ^ par1 - 1) / par1
}
if (par5 == 0) {
y <- log(y)
} else {
y <- (y ^ par5 - 1) / par5
}
if (par2 > 0) x <- diff(x,lag=1,difference=par2)
if (par6 > 0) y <- diff(y,lag=1,difference=par6)
if (par3 > 0) x <- diff(x,lag=par4,difference=par3)
if (par7 > 0) y <- diff(y,lag=par4,difference=par7)
x
y
bitmap(file='test1.png')
(r <- ccf(x,y,main='Cross Correlation Function',ylab='CCF',xlab='Lag (k)'))
dev.off()
load(file='createtable')
a<-table.start()
a<-table.row.start(a)
a<-table.element(a,'Cross Correlation Function',2,TRUE)
a<-table.row.end(a)
a<-table.row.start(a)
a<-table.element(a,'Parameter',header=TRUE)
a<-table.element(a,'Value',header=TRUE)
a<-table.row.end(a)
a<-table.row.start(a)
a<-table.element(a,'Box-Cox transformation parameter (lambda) of X series',header=TRUE)
a<-table.element(a,par1)
a<-table.row.end(a)
a<-table.row.start(a)
a<-table.element(a,'Degree of non-seasonal differencing (d) of X series',header=TRUE)
a<-table.element(a,par2)
a<-table.row.end(a)
a<-table.row.start(a)
a<-table.element(a,'Degree of seasonal differencing (D) of X series',header=TRUE)
a<-table.element(a,par3)
a<-table.row.end(a)
a<-table.row.start(a)
a<-table.element(a,'Seasonal Period (s)',header=TRUE)
a<-table.element(a,par4)
a<-table.row.end(a)
a<-table.row.start(a)
a<-table.element(a,'Box-Cox transformation parameter (lambda) of Y series',header=TRUE)
a<-table.element(a,par5)
a<-table.row.end(a)
a<-table.row.start(a)
a<-table.element(a,'Degree of non-seasonal differencing (d) of Y series',header=TRUE)
a<-table.element(a,par6)
a<-table.row.end(a)
a<-table.row.start(a)
a<-table.element(a,'Degree of seasonal differencing (D) of Y series',header=TRUE)
a<-table.element(a,par7)
a<-table.row.end(a)
a<-table.row.start(a)
a<-table.element(a,'k',header=TRUE)
a<-table.element(a,'rho(Y[t],X[t+k])',header=TRUE)
a<-table.row.end(a)
mylength <- length(r$acf)
myhalf <- floor((mylength-1)/2)
for (i in 1:mylength) {
a<-table.row.start(a)
a<-table.element(a,i-myhalf-1,header=TRUE)
a<-table.element(a,r$acf[i])
a<-table.row.end(a)
}
a<-table.end(a)
table.save(a,file='mytable.tab')