Free Statistics

of Irreproducible Research!

Author's title

Author*Unverified author*
R Software Modulerwasp_autocorrelation.wasp
Title produced by software(Partial) Autocorrelation Function
Date of computationTue, 02 Dec 2008 15:15:57 -0700
Cite this page as followsStatistical Computations at FreeStatistics.org, Office for Research Development and Education, URL https://freestatistics.org/blog/index.php?v=date/2008/Dec/02/t1228256195hhw9uwb1nzxay1n.htm/, Retrieved Sun, 19 May 2024 12:19:07 +0000
Statistical Computations at FreeStatistics.org, Office for Research Development and Education, URL https://freestatistics.org/blog/index.php?pk=28510, Retrieved Sun, 19 May 2024 12:19:07 +0000
QR Codes:

Original text written by user:
IsPrivate?No (this computation is public)
User-defined keywords
Estimated Impact147
Family? (F = Feedback message, R = changed R code, M = changed R Module, P = changed Parameters, D = changed Data)
F     [Univariate Data Series] [Airline data] [2007-10-18 09:58:47] [42daae401fd3def69a25014f2252b4c2]
F RMPD  [Spectral Analysis] [Non stationary ti...] [2008-12-02 21:06:35] [74be16979710d4c4e7c6647856088456]
F   P     [Spectral Analysis] [Non stationary ti...] [2008-12-02 21:32:09] [74be16979710d4c4e7c6647856088456]
F RM D        [(Partial) Autocorrelation Function] [Non stationary ti...] [2008-12-02 22:15:57] [d41d8cd98f00b204e9800998ecf8427e] [Current]
Feedback Forum
2008-12-04 12:31:46 [72e979bcc364082694890d2eccc1a66f] [reply
Om de waarden van D en d te vinden maak je het best gebruik van de Variance Reduction Matrix. Daar moet je dan op zoek gaan naar de kleinste variantie.
Naast die kleinste variantie vind je dan de waarden voor d en D.

Post a new message
Dataseries X:
101.2
100.5
98
106.6
90.1
96.9
125.9
112
100
123.9
79.8
83.4
113.6
112.9
104
109.9
99
106.3
128.9
111.1
102.9
130
87
87.5
117.6
103.4
110.8
112.6
102.5
112.4
135.6
105.1
127.7
137
91
90.5
122.4
123.3
124.3
120
118.1
119
142.7
123.6
129.6
151.6
110.4
99.2
130.5
136.2
129.7
128
121.6
135.8
143.8
147.5
136.2
156.6
123.3
100.4


Summary of computational transaction
Raw Inputview raw input (R code)
Raw Outputview raw output of R engine
Computing time1 seconds
R Server'Gwilym Jenkins' @ 72.249.127.135

\begin{tabular}{lllllllll}
\hline
Summary of computational transaction \tabularnewline
Raw Input & view raw input (R code)  \tabularnewline
Raw Output & view raw output of R engine  \tabularnewline
Computing time & 1 seconds \tabularnewline
R Server & 'Gwilym Jenkins' @ 72.249.127.135 \tabularnewline
\hline
\end{tabular}
%Source: https://freestatistics.org/blog/index.php?pk=28510&T=0

[TABLE]
[ROW][C]Summary of computational transaction[/C][/ROW]
[ROW][C]Raw Input[/C][C]view raw input (R code) [/C][/ROW]
[ROW][C]Raw Output[/C][C]view raw output of R engine [/C][/ROW]
[ROW][C]Computing time[/C][C]1 seconds[/C][/ROW]
[ROW][C]R Server[/C][C]'Gwilym Jenkins' @ 72.249.127.135[/C][/ROW]
[/TABLE]
Source: https://freestatistics.org/blog/index.php?pk=28510&T=0

Globally Unique Identifier (entire table): ba.freestatistics.org/blog/index.php?pk=28510&T=0

As an alternative you can also use a QR Code:  

The GUIDs for individual cells are displayed in the table below:

Summary of computational transaction
Raw Inputview raw input (R code)
Raw Outputview raw output of R engine
Computing time1 seconds
R Server'Gwilym Jenkins' @ 72.249.127.135


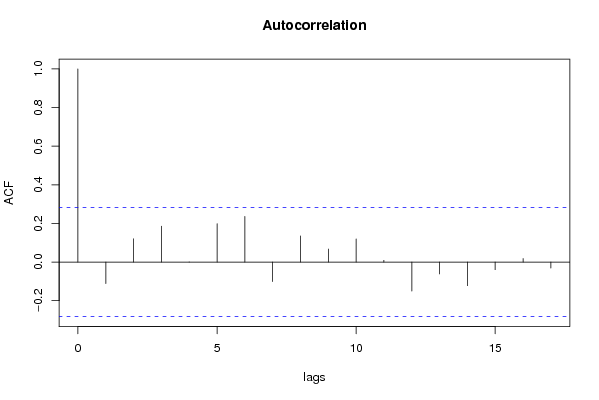
Autocorrelation Function
Time lag kACF(k)T-STATP-value
1-0.111277-0.7710.222257
20.1201470.83240.204653
30.185821.28740.102065
4-2.7e-05-2e-040.499926
50.1983851.37450.087842
60.2360951.63570.05422
7-0.101071-0.70020.243579
80.134930.93480.177279
90.0673960.46690.321329
100.1197430.82960.205435
110.009060.06280.475104
12-0.150642-1.04370.150931
13-0.061946-0.42920.334859
14-0.12273-0.85030.199691
15-0.039716-0.27520.392188
160.0179350.12430.450815
17-0.031103-0.21550.415151

\begin{tabular}{lllllllll}
\hline
Autocorrelation Function \tabularnewline
Time lag k & ACF(k) & T-STAT & P-value \tabularnewline
1 & -0.111277 & -0.771 & 0.222257 \tabularnewline
2 & 0.120147 & 0.8324 & 0.204653 \tabularnewline
3 & 0.18582 & 1.2874 & 0.102065 \tabularnewline
4 & -2.7e-05 & -2e-04 & 0.499926 \tabularnewline
5 & 0.198385 & 1.3745 & 0.087842 \tabularnewline
6 & 0.236095 & 1.6357 & 0.05422 \tabularnewline
7 & -0.101071 & -0.7002 & 0.243579 \tabularnewline
8 & 0.13493 & 0.9348 & 0.177279 \tabularnewline
9 & 0.067396 & 0.4669 & 0.321329 \tabularnewline
10 & 0.119743 & 0.8296 & 0.205435 \tabularnewline
11 & 0.00906 & 0.0628 & 0.475104 \tabularnewline
12 & -0.150642 & -1.0437 & 0.150931 \tabularnewline
13 & -0.061946 & -0.4292 & 0.334859 \tabularnewline
14 & -0.12273 & -0.8503 & 0.199691 \tabularnewline
15 & -0.039716 & -0.2752 & 0.392188 \tabularnewline
16 & 0.017935 & 0.1243 & 0.450815 \tabularnewline
17 & -0.031103 & -0.2155 & 0.415151 \tabularnewline
\hline
\end{tabular}
%Source: https://freestatistics.org/blog/index.php?pk=28510&T=1

[TABLE]
[ROW][C]Autocorrelation Function[/C][/ROW]
[ROW][C]Time lag k[/C][C]ACF(k)[/C][C]T-STAT[/C][C]P-value[/C][/ROW]
[ROW][C]1[/C][C]-0.111277[/C][C]-0.771[/C][C]0.222257[/C][/ROW]
[ROW][C]2[/C][C]0.120147[/C][C]0.8324[/C][C]0.204653[/C][/ROW]
[ROW][C]3[/C][C]0.18582[/C][C]1.2874[/C][C]0.102065[/C][/ROW]
[ROW][C]4[/C][C]-2.7e-05[/C][C]-2e-04[/C][C]0.499926[/C][/ROW]
[ROW][C]5[/C][C]0.198385[/C][C]1.3745[/C][C]0.087842[/C][/ROW]
[ROW][C]6[/C][C]0.236095[/C][C]1.6357[/C][C]0.05422[/C][/ROW]
[ROW][C]7[/C][C]-0.101071[/C][C]-0.7002[/C][C]0.243579[/C][/ROW]
[ROW][C]8[/C][C]0.13493[/C][C]0.9348[/C][C]0.177279[/C][/ROW]
[ROW][C]9[/C][C]0.067396[/C][C]0.4669[/C][C]0.321329[/C][/ROW]
[ROW][C]10[/C][C]0.119743[/C][C]0.8296[/C][C]0.205435[/C][/ROW]
[ROW][C]11[/C][C]0.00906[/C][C]0.0628[/C][C]0.475104[/C][/ROW]
[ROW][C]12[/C][C]-0.150642[/C][C]-1.0437[/C][C]0.150931[/C][/ROW]
[ROW][C]13[/C][C]-0.061946[/C][C]-0.4292[/C][C]0.334859[/C][/ROW]
[ROW][C]14[/C][C]-0.12273[/C][C]-0.8503[/C][C]0.199691[/C][/ROW]
[ROW][C]15[/C][C]-0.039716[/C][C]-0.2752[/C][C]0.392188[/C][/ROW]
[ROW][C]16[/C][C]0.017935[/C][C]0.1243[/C][C]0.450815[/C][/ROW]
[ROW][C]17[/C][C]-0.031103[/C][C]-0.2155[/C][C]0.415151[/C][/ROW]
[/TABLE]
Source: https://freestatistics.org/blog/index.php?pk=28510&T=1

Globally Unique Identifier (entire table): ba.freestatistics.org/blog/index.php?pk=28510&T=1

As an alternative you can also use a QR Code:  

The GUIDs for individual cells are displayed in the table below:

Autocorrelation Function
Time lag kACF(k)T-STATP-value
1-0.111277-0.7710.222257
20.1201470.83240.204653
30.185821.28740.102065
4-2.7e-05-2e-040.499926
50.1983851.37450.087842
60.2360951.63570.05422
7-0.101071-0.70020.243579
80.134930.93480.177279
90.0673960.46690.321329
100.1197430.82960.205435
110.009060.06280.475104
12-0.150642-1.04370.150931
13-0.061946-0.42920.334859
14-0.12273-0.85030.199691
15-0.039716-0.27520.392188
160.0179350.12430.450815
17-0.031103-0.21550.415151


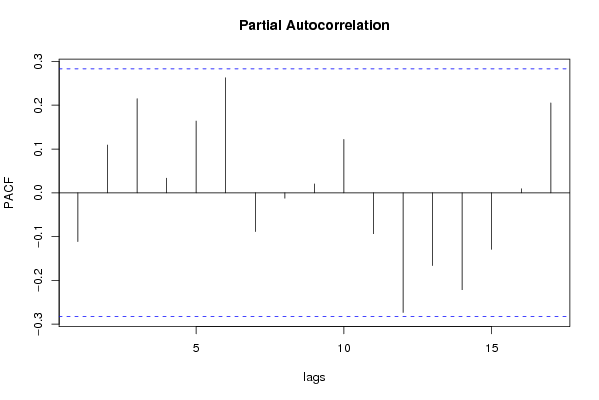
Partial Autocorrelation Function
Time lag kPACF(k)T-STATP-value
1-0.111277-0.7710.222257
20.1091150.7560.22668
30.2150641.490.071382
40.0333240.23090.409197
50.163851.13520.130966
60.2627481.82040.03747
7-0.088426-0.61260.271505
8-0.012193-0.08450.466516
90.0203680.14110.444186
100.121830.84410.20141
11-0.09329-0.64630.260571
12-0.273207-1.89280.032209
13-0.166069-1.15060.127806
14-0.221287-1.53310.065906
15-0.129114-0.89450.187752
160.0090370.06260.475169
170.2053391.42260.080655

\begin{tabular}{lllllllll}
\hline
Partial Autocorrelation Function \tabularnewline
Time lag k & PACF(k) & T-STAT & P-value \tabularnewline
1 & -0.111277 & -0.771 & 0.222257 \tabularnewline
2 & 0.109115 & 0.756 & 0.22668 \tabularnewline
3 & 0.215064 & 1.49 & 0.071382 \tabularnewline
4 & 0.033324 & 0.2309 & 0.409197 \tabularnewline
5 & 0.16385 & 1.1352 & 0.130966 \tabularnewline
6 & 0.262748 & 1.8204 & 0.03747 \tabularnewline
7 & -0.088426 & -0.6126 & 0.271505 \tabularnewline
8 & -0.012193 & -0.0845 & 0.466516 \tabularnewline
9 & 0.020368 & 0.1411 & 0.444186 \tabularnewline
10 & 0.12183 & 0.8441 & 0.20141 \tabularnewline
11 & -0.09329 & -0.6463 & 0.260571 \tabularnewline
12 & -0.273207 & -1.8928 & 0.032209 \tabularnewline
13 & -0.166069 & -1.1506 & 0.127806 \tabularnewline
14 & -0.221287 & -1.5331 & 0.065906 \tabularnewline
15 & -0.129114 & -0.8945 & 0.187752 \tabularnewline
16 & 0.009037 & 0.0626 & 0.475169 \tabularnewline
17 & 0.205339 & 1.4226 & 0.080655 \tabularnewline
\hline
\end{tabular}
%Source: https://freestatistics.org/blog/index.php?pk=28510&T=2

[TABLE]
[ROW][C]Partial Autocorrelation Function[/C][/ROW]
[ROW][C]Time lag k[/C][C]PACF(k)[/C][C]T-STAT[/C][C]P-value[/C][/ROW]
[ROW][C]1[/C][C]-0.111277[/C][C]-0.771[/C][C]0.222257[/C][/ROW]
[ROW][C]2[/C][C]0.109115[/C][C]0.756[/C][C]0.22668[/C][/ROW]
[ROW][C]3[/C][C]0.215064[/C][C]1.49[/C][C]0.071382[/C][/ROW]
[ROW][C]4[/C][C]0.033324[/C][C]0.2309[/C][C]0.409197[/C][/ROW]
[ROW][C]5[/C][C]0.16385[/C][C]1.1352[/C][C]0.130966[/C][/ROW]
[ROW][C]6[/C][C]0.262748[/C][C]1.8204[/C][C]0.03747[/C][/ROW]
[ROW][C]7[/C][C]-0.088426[/C][C]-0.6126[/C][C]0.271505[/C][/ROW]
[ROW][C]8[/C][C]-0.012193[/C][C]-0.0845[/C][C]0.466516[/C][/ROW]
[ROW][C]9[/C][C]0.020368[/C][C]0.1411[/C][C]0.444186[/C][/ROW]
[ROW][C]10[/C][C]0.12183[/C][C]0.8441[/C][C]0.20141[/C][/ROW]
[ROW][C]11[/C][C]-0.09329[/C][C]-0.6463[/C][C]0.260571[/C][/ROW]
[ROW][C]12[/C][C]-0.273207[/C][C]-1.8928[/C][C]0.032209[/C][/ROW]
[ROW][C]13[/C][C]-0.166069[/C][C]-1.1506[/C][C]0.127806[/C][/ROW]
[ROW][C]14[/C][C]-0.221287[/C][C]-1.5331[/C][C]0.065906[/C][/ROW]
[ROW][C]15[/C][C]-0.129114[/C][C]-0.8945[/C][C]0.187752[/C][/ROW]
[ROW][C]16[/C][C]0.009037[/C][C]0.0626[/C][C]0.475169[/C][/ROW]
[ROW][C]17[/C][C]0.205339[/C][C]1.4226[/C][C]0.080655[/C][/ROW]
[/TABLE]
Source: https://freestatistics.org/blog/index.php?pk=28510&T=2

Globally Unique Identifier (entire table): ba.freestatistics.org/blog/index.php?pk=28510&T=2

As an alternative you can also use a QR Code:  

The GUIDs for individual cells are displayed in the table below:

Partial Autocorrelation Function
Time lag kPACF(k)T-STATP-value
1-0.111277-0.7710.222257
20.1091150.7560.22668
30.2150641.490.071382
40.0333240.23090.409197
50.163851.13520.130966
60.2627481.82040.03747
7-0.088426-0.61260.271505
8-0.012193-0.08450.466516
90.0203680.14110.444186
100.121830.84410.20141
11-0.09329-0.64630.260571
12-0.273207-1.89280.032209
13-0.166069-1.15060.127806
14-0.221287-1.53310.065906
15-0.129114-0.89450.187752
160.0090370.06260.475169
170.2053391.42260.080655


Parameters (Session):
par1 = 1 ; par2 = 1 ; par3 = 0 ; par4 = 12 ;
Parameters (R input):
par1 = Default ; par2 = 1 ; par3 = 0 ; par4 = 1 ; par5 = 12 ;
R code (references can be found in the software module):
if (par1 == 'Default') {
par1 = 10*log10(length(x))
} else {
par1 <- as.numeric(par1)
}
par2 <- as.numeric(par2)
par3 <- as.numeric(par3)
par4 <- as.numeric(par4)
par5 <- as.numeric(par5)
if (par2 == 0) {
x <- log(x)
} else {
x <- (x ^ par2 - 1) / par2
}
if (par3 > 0) x <- diff(x,lag=1,difference=par3)
if (par4 > 0) x <- diff(x,lag=par5,difference=par4)
bitmap(file='pic1.png')
racf <- acf(x,par1,main='Autocorrelation',xlab='lags',ylab='ACF')
dev.off()
bitmap(file='pic2.png')
rpacf <- pacf(x,par1,main='Partial Autocorrelation',xlab='lags',ylab='PACF')
dev.off()
(myacf <- c(racf$acf))
(mypacf <- c(rpacf$acf))
lengthx <- length(x)
sqrtn <- sqrt(lengthx)
load(file='createtable')
a<-table.start()
a<-table.row.start(a)
a<-table.element(a,'Autocorrelation Function',4,TRUE)
a<-table.row.end(a)
a<-table.row.start(a)
a<-table.element(a,'Time lag k',header=TRUE)
a<-table.element(a,hyperlink('basics.htm','ACF(k)','click here for more information about the Autocorrelation Function'),header=TRUE)
a<-table.element(a,'T-STAT',header=TRUE)
a<-table.element(a,'P-value',header=TRUE)
a<-table.row.end(a)
for (i in 2:(par1+1)) {
a<-table.row.start(a)
a<-table.element(a,i-1,header=TRUE)
a<-table.element(a,round(myacf[i],6))
mytstat <- myacf[i]*sqrtn
a<-table.element(a,round(mytstat,4))
a<-table.element(a,round(1-pt(abs(mytstat),lengthx),6))
a<-table.row.end(a)
}
a<-table.end(a)
table.save(a,file='mytable.tab')
a<-table.start()
a<-table.row.start(a)
a<-table.element(a,'Partial Autocorrelation Function',4,TRUE)
a<-table.row.end(a)
a<-table.row.start(a)
a<-table.element(a,'Time lag k',header=TRUE)
a<-table.element(a,hyperlink('basics.htm','PACF(k)','click here for more information about the Partial Autocorrelation Function'),header=TRUE)
a<-table.element(a,'T-STAT',header=TRUE)
a<-table.element(a,'P-value',header=TRUE)
a<-table.row.end(a)
for (i in 1:par1) {
a<-table.row.start(a)
a<-table.element(a,i,header=TRUE)
a<-table.element(a,round(mypacf[i],6))
mytstat <- mypacf[i]*sqrtn
a<-table.element(a,round(mytstat,4))
a<-table.element(a,round(1-pt(abs(mytstat),lengthx),6))
a<-table.row.end(a)
}
a<-table.end(a)
table.save(a,file='mytable1.tab')