Free Statistics

of Irreproducible Research!

Author's title

Author*Unverified author*
R Software Modulerwasp_cross.wasp
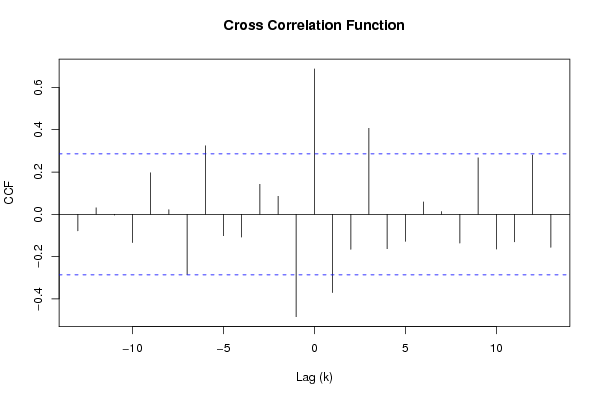
Title produced by softwareCross Correlation Function
Date of computationTue, 02 Dec 2008 14:49:22 -0700
Cite this page as followsStatistical Computations at FreeStatistics.org, Office for Research Development and Education, URL https://freestatistics.org/blog/index.php?v=date/2008/Dec/02/t12282546005mgabx0sqklxbv1.htm/, Retrieved Sun, 19 May 2024 08:52:30 +0000
Statistical Computations at FreeStatistics.org, Office for Research Development and Education, URL https://freestatistics.org/blog/index.php?pk=28494, Retrieved Sun, 19 May 2024 08:52:30 +0000
QR Codes:

Original text written by user:
IsPrivate?No (this computation is public)
User-defined keywords
Estimated Impact147
Family? (F = Feedback message, R = changed R code, M = changed R Module, P = changed Parameters, D = changed Data)
-     [Cross Correlation Function] [] [2008-12-02 21:46:28] [74be16979710d4c4e7c6647856088456]
F   PD    [Cross Correlation Function] [] [2008-12-02 21:49:22] [d41d8cd98f00b204e9800998ecf8427e] [Current]
-   P       [Cross Correlation Function] [] [2008-12-04 16:44:01] [996314793dac993597edc1ca2281ff39]
Feedback Forum
2008-12-04 16:49:14 [Angelique Van de Vijver] [reply
Juiste methode( hier moet je inderdaad de kruiscorrelatie berekenen), maar de student heeft geen analyse gedaan naar welke differentiatie het beste is voor elke tijdreeks. Deze analyse moest je in Q8 doen maar dit heeft de student niet gedaan. Hij kan dus ook niet weten welke differentiatie het beste is. Hij heeft dus eigenlijk gegokt naar een bepaalde differentiatie.
De student heeft d=1 en D=1 gebruikt bij elke tijdreeks. Maar als ik de analyse uitvoer kom ik tot de conclusie dat bij beide tijdreeksen d=0 en D=1 de beste differentiatie is.
Ik heb daarom de kruiscorrelatie opnieuw berekend maar dan met d=0 en D=1 als differentiatie van de tijdreeksen:
http://www.freestatistics.org/blog/date/2008/Dec/04/t1228409070i92gm95uz8ub3kj.htm
Dit geeft dus het verband weer tussen de duurzame consumptiegoederen en de niet-duurzame consumptiegoederen.
Hier zie je dat bij een k-waarde van -6 je de hoogste positieve correlatie hebt. Bij een k-waarde van 5 heb je de hoogste negatieve correlatie.
2008-12-10 09:05:02 [Peter Van Doninck] [reply
De student kan deze opgave niet correct beantwoord hebben. Hiervoor had hij gegevens uit vorige vraag nodig, welke hij niet had. Hij had de gevonden waarden moeten invoeren, om dan de kruiscorrelatie te berekenen om zo te cijfers te interpreteren.

Post a new message
Dataseries X:
100.8
100.7
86.2
83.2
71.7
77.5
89.8
80.3
78.7
93.8
57.6
60.6
91
85.3
77.4
77.3
68.3
69.9
81.7
75.1
69.9
84
54.3
60
89.9
77
85.3
77.6
69.2
75.5
85.7
72.2
79.9
85.3
52.2
61.2
82.4
85.4
78.2
70.2
70.2
69.3
77.5
66.1
69
79.2
56.2
63.3
77.8
92
78.1
65.1
71.1
70.9
72
81.9
70.6
72.5
65.1
61.1
Dataseries Y:
127.5
128.6
116.6
127.4
105
108.3
125
111.6
106.5
130.3
115
116.1
134
126.5
125.8
136.4
114.9
110.9
125.5
116.8
116.8
125.5
104.2
115.1
132.8
123.3
124.8
122
117.4
117.9
137.4
114.6
124.7
129.6
109.4
120.9
134.9
136.3
133.2
127.2
122.7
120.5
137.8
119.1
124.3
134.4
121.1
122.2
127.7
137.4
132.2
129.2
124.9
124.8
128.2
134.4
118.6
132.6
123.2
112.3


Summary of computational transaction
Raw Inputview raw input (R code)
Raw Outputview raw output of R engine
Computing time1 seconds
R Server'George Udny Yule' @ 72.249.76.132

\begin{tabular}{lllllllll}
\hline
Summary of computational transaction \tabularnewline
Raw Input & view raw input (R code)  \tabularnewline
Raw Output & view raw output of R engine  \tabularnewline
Computing time & 1 seconds \tabularnewline
R Server & 'George Udny Yule' @ 72.249.76.132 \tabularnewline
\hline
\end{tabular}
%Source: https://freestatistics.org/blog/index.php?pk=28494&T=0

[TABLE]
[ROW][C]Summary of computational transaction[/C][/ROW]
[ROW][C]Raw Input[/C][C]view raw input (R code) [/C][/ROW]
[ROW][C]Raw Output[/C][C]view raw output of R engine [/C][/ROW]
[ROW][C]Computing time[/C][C]1 seconds[/C][/ROW]
[ROW][C]R Server[/C][C]'George Udny Yule' @ 72.249.76.132[/C][/ROW]
[/TABLE]
Source: https://freestatistics.org/blog/index.php?pk=28494&T=0

Globally Unique Identifier (entire table): ba.freestatistics.org/blog/index.php?pk=28494&T=0

As an alternative you can also use a QR Code:  

The GUIDs for individual cells are displayed in the table below:

Summary of computational transaction
Raw Inputview raw input (R code)
Raw Outputview raw output of R engine
Computing time1 seconds
R Server'George Udny Yule' @ 72.249.76.132


Cross Correlation Function
ParameterValue
Box-Cox transformation parameter (lambda) of X series1
Degree of non-seasonal differencing (d) of X series1
Degree of seasonal differencing (D) of X series1
Seasonal Period (s)12
Box-Cox transformation parameter (lambda) of Y series1
Degree of non-seasonal differencing (d) of Y series1
Degree of seasonal differencing (D) of Y series1
krho(Y[t],X[t+k])
-13-0.0781115904816836
-120.0307919403822810
-11-0.00355379287326089
-10-0.133452426140486
-90.196310371393923
-80.0219377970648323
-7-0.284183039313044
-60.323865841645351
-5-0.101316393279531
-4-0.107898908312370
-30.141755540210517
-20.0853838436819786
-1-0.484102852016324
00.68752752398253
1-0.36998150574335
2-0.165410806821592
30.406609836197045
4-0.162786838527194
5-0.127941731049725
60.0583858685668906
70.0130437919758371
8-0.136129378777505
90.267453333443085
10-0.164237034806508
11-0.130037682022957
120.280426708460558
13-0.156301983265120

\begin{tabular}{lllllllll}
\hline
Cross Correlation Function \tabularnewline
Parameter & Value \tabularnewline
Box-Cox transformation parameter (lambda) of X series & 1 \tabularnewline
Degree of non-seasonal differencing (d) of X series & 1 \tabularnewline
Degree of seasonal differencing (D) of X series & 1 \tabularnewline
Seasonal Period (s) & 12 \tabularnewline
Box-Cox transformation parameter (lambda) of Y series & 1 \tabularnewline
Degree of non-seasonal differencing (d) of Y series & 1 \tabularnewline
Degree of seasonal differencing (D) of Y series & 1 \tabularnewline
k & rho(Y[t],X[t+k]) \tabularnewline
-13 & -0.0781115904816836 \tabularnewline
-12 & 0.0307919403822810 \tabularnewline
-11 & -0.00355379287326089 \tabularnewline
-10 & -0.133452426140486 \tabularnewline
-9 & 0.196310371393923 \tabularnewline
-8 & 0.0219377970648323 \tabularnewline
-7 & -0.284183039313044 \tabularnewline
-6 & 0.323865841645351 \tabularnewline
-5 & -0.101316393279531 \tabularnewline
-4 & -0.107898908312370 \tabularnewline
-3 & 0.141755540210517 \tabularnewline
-2 & 0.0853838436819786 \tabularnewline
-1 & -0.484102852016324 \tabularnewline
0 & 0.68752752398253 \tabularnewline
1 & -0.36998150574335 \tabularnewline
2 & -0.165410806821592 \tabularnewline
3 & 0.406609836197045 \tabularnewline
4 & -0.162786838527194 \tabularnewline
5 & -0.127941731049725 \tabularnewline
6 & 0.0583858685668906 \tabularnewline
7 & 0.0130437919758371 \tabularnewline
8 & -0.136129378777505 \tabularnewline
9 & 0.267453333443085 \tabularnewline
10 & -0.164237034806508 \tabularnewline
11 & -0.130037682022957 \tabularnewline
12 & 0.280426708460558 \tabularnewline
13 & -0.156301983265120 \tabularnewline
\hline
\end{tabular}
%Source: https://freestatistics.org/blog/index.php?pk=28494&T=1

[TABLE]
[ROW][C]Cross Correlation Function[/C][/ROW]
[ROW][C]Parameter[/C][C]Value[/C][/ROW]
[ROW][C]Box-Cox transformation parameter (lambda) of X series[/C][C]1[/C][/ROW]
[ROW][C]Degree of non-seasonal differencing (d) of X series[/C][C]1[/C][/ROW]
[ROW][C]Degree of seasonal differencing (D) of X series[/C][C]1[/C][/ROW]
[ROW][C]Seasonal Period (s)[/C][C]12[/C][/ROW]
[ROW][C]Box-Cox transformation parameter (lambda) of Y series[/C][C]1[/C][/ROW]
[ROW][C]Degree of non-seasonal differencing (d) of Y series[/C][C]1[/C][/ROW]
[ROW][C]Degree of seasonal differencing (D) of Y series[/C][C]1[/C][/ROW]
[ROW][C]k[/C][C]rho(Y[t],X[t+k])[/C][/ROW]
[ROW][C]-13[/C][C]-0.0781115904816836[/C][/ROW]
[ROW][C]-12[/C][C]0.0307919403822810[/C][/ROW]
[ROW][C]-11[/C][C]-0.00355379287326089[/C][/ROW]
[ROW][C]-10[/C][C]-0.133452426140486[/C][/ROW]
[ROW][C]-9[/C][C]0.196310371393923[/C][/ROW]
[ROW][C]-8[/C][C]0.0219377970648323[/C][/ROW]
[ROW][C]-7[/C][C]-0.284183039313044[/C][/ROW]
[ROW][C]-6[/C][C]0.323865841645351[/C][/ROW]
[ROW][C]-5[/C][C]-0.101316393279531[/C][/ROW]
[ROW][C]-4[/C][C]-0.107898908312370[/C][/ROW]
[ROW][C]-3[/C][C]0.141755540210517[/C][/ROW]
[ROW][C]-2[/C][C]0.0853838436819786[/C][/ROW]
[ROW][C]-1[/C][C]-0.484102852016324[/C][/ROW]
[ROW][C]0[/C][C]0.68752752398253[/C][/ROW]
[ROW][C]1[/C][C]-0.36998150574335[/C][/ROW]
[ROW][C]2[/C][C]-0.165410806821592[/C][/ROW]
[ROW][C]3[/C][C]0.406609836197045[/C][/ROW]
[ROW][C]4[/C][C]-0.162786838527194[/C][/ROW]
[ROW][C]5[/C][C]-0.127941731049725[/C][/ROW]
[ROW][C]6[/C][C]0.0583858685668906[/C][/ROW]
[ROW][C]7[/C][C]0.0130437919758371[/C][/ROW]
[ROW][C]8[/C][C]-0.136129378777505[/C][/ROW]
[ROW][C]9[/C][C]0.267453333443085[/C][/ROW]
[ROW][C]10[/C][C]-0.164237034806508[/C][/ROW]
[ROW][C]11[/C][C]-0.130037682022957[/C][/ROW]
[ROW][C]12[/C][C]0.280426708460558[/C][/ROW]
[ROW][C]13[/C][C]-0.156301983265120[/C][/ROW]
[/TABLE]
Source: https://freestatistics.org/blog/index.php?pk=28494&T=1

Globally Unique Identifier (entire table): ba.freestatistics.org/blog/index.php?pk=28494&T=1

As an alternative you can also use a QR Code:  

The GUIDs for individual cells are displayed in the table below:

Cross Correlation Function
ParameterValue
Box-Cox transformation parameter (lambda) of X series1
Degree of non-seasonal differencing (d) of X series1
Degree of seasonal differencing (D) of X series1
Seasonal Period (s)12
Box-Cox transformation parameter (lambda) of Y series1
Degree of non-seasonal differencing (d) of Y series1
Degree of seasonal differencing (D) of Y series1
krho(Y[t],X[t+k])
-13-0.0781115904816836
-120.0307919403822810
-11-0.00355379287326089
-10-0.133452426140486
-90.196310371393923
-80.0219377970648323
-7-0.284183039313044
-60.323865841645351
-5-0.101316393279531
-4-0.107898908312370
-30.141755540210517
-20.0853838436819786
-1-0.484102852016324
00.68752752398253
1-0.36998150574335
2-0.165410806821592
30.406609836197045
4-0.162786838527194
5-0.127941731049725
60.0583858685668906
70.0130437919758371
8-0.136129378777505
90.267453333443085
10-0.164237034806508
11-0.130037682022957
120.280426708460558
13-0.156301983265120


Parameters (Session):
par1 = 1 ; par2 = 1 ; par3 = 1 ; par4 = 12 ; par5 = 1 ; par6 = 1 ; par7 = 1 ;
Parameters (R input):
par1 = 1 ; par2 = 1 ; par3 = 1 ; par4 = 12 ; par5 = 1 ; par6 = 1 ; par7 = 1 ;
R code (references can be found in the software module):
par1 <- as.numeric(par1)
par2 <- as.numeric(par2)
par3 <- as.numeric(par3)
par4 <- as.numeric(par4)
par5 <- as.numeric(par5)
par6 <- as.numeric(par6)
par7 <- as.numeric(par7)
if (par1 == 0) {
x <- log(x)
} else {
x <- (x ^ par1 - 1) / par1
}
if (par5 == 0) {
y <- log(y)
} else {
y <- (y ^ par5 - 1) / par5
}
if (par2 > 0) x <- diff(x,lag=1,difference=par2)
if (par6 > 0) y <- diff(y,lag=1,difference=par6)
if (par3 > 0) x <- diff(x,lag=par4,difference=par3)
if (par7 > 0) y <- diff(y,lag=par4,difference=par7)
x
y
bitmap(file='test1.png')
(r <- ccf(x,y,main='Cross Correlation Function',ylab='CCF',xlab='Lag (k)'))
dev.off()
load(file='createtable')
a<-table.start()
a<-table.row.start(a)
a<-table.element(a,'Cross Correlation Function',2,TRUE)
a<-table.row.end(a)
a<-table.row.start(a)
a<-table.element(a,'Parameter',header=TRUE)
a<-table.element(a,'Value',header=TRUE)
a<-table.row.end(a)
a<-table.row.start(a)
a<-table.element(a,'Box-Cox transformation parameter (lambda) of X series',header=TRUE)
a<-table.element(a,par1)
a<-table.row.end(a)
a<-table.row.start(a)
a<-table.element(a,'Degree of non-seasonal differencing (d) of X series',header=TRUE)
a<-table.element(a,par2)
a<-table.row.end(a)
a<-table.row.start(a)
a<-table.element(a,'Degree of seasonal differencing (D) of X series',header=TRUE)
a<-table.element(a,par3)
a<-table.row.end(a)
a<-table.row.start(a)
a<-table.element(a,'Seasonal Period (s)',header=TRUE)
a<-table.element(a,par4)
a<-table.row.end(a)
a<-table.row.start(a)
a<-table.element(a,'Box-Cox transformation parameter (lambda) of Y series',header=TRUE)
a<-table.element(a,par5)
a<-table.row.end(a)
a<-table.row.start(a)
a<-table.element(a,'Degree of non-seasonal differencing (d) of Y series',header=TRUE)
a<-table.element(a,par6)
a<-table.row.end(a)
a<-table.row.start(a)
a<-table.element(a,'Degree of seasonal differencing (D) of Y series',header=TRUE)
a<-table.element(a,par7)
a<-table.row.end(a)
a<-table.row.start(a)
a<-table.element(a,'k',header=TRUE)
a<-table.element(a,'rho(Y[t],X[t+k])',header=TRUE)
a<-table.row.end(a)
mylength <- length(r$acf)
myhalf <- floor((mylength-1)/2)
for (i in 1:mylength) {
a<-table.row.start(a)
a<-table.element(a,i-myhalf-1,header=TRUE)
a<-table.element(a,r$acf[i])
a<-table.row.end(a)
}
a<-table.end(a)
table.save(a,file='mytable.tab')