Free Statistics

of Irreproducible Research!

Author's title

Author*The author of this computation has been verified*
R Software Modulerwasp_smp.wasp
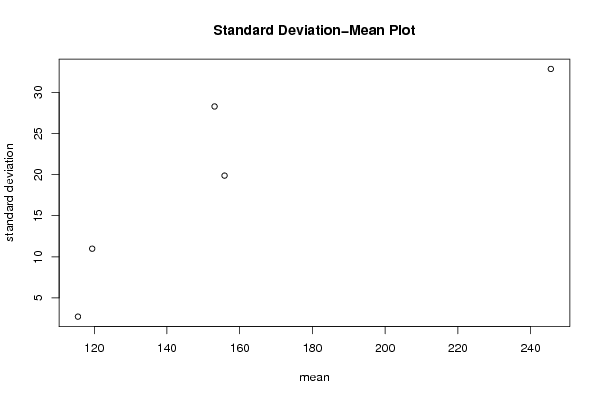
Title produced by softwareStandard Deviation-Mean Plot
Date of computationTue, 02 Dec 2008 14:04:58 -0700
Cite this page as followsStatistical Computations at FreeStatistics.org, Office for Research Development and Education, URL https://freestatistics.org/blog/index.php?v=date/2008/Dec/02/t1228252029dn9exxk94padrn2.htm/, Retrieved Sun, 19 May 2024 12:19:36 +0000
Statistical Computations at FreeStatistics.org, Office for Research Development and Education, URL https://freestatistics.org/blog/index.php?pk=28457, Retrieved Sun, 19 May 2024 12:19:36 +0000
QR Codes:

Original text written by user:
IsPrivate?No (this computation is public)
User-defined keywords
Estimated Impact161
Family? (F = Feedback message, R = changed R code, M = changed R Module, P = changed Parameters, D = changed Data)
F       [Standard Deviation-Mean Plot] [Standard Deviatio...] [2008-12-02 21:04:58] [96839c4b6d4e03ef3851369c676780bf] [Current]
- RMP     [(Partial) Autocorrelation Function] [] [2008-12-06 14:15:12] [74be16979710d4c4e7c6647856088456]
- RMP     [Spectral Analysis] [] [2008-12-06 14:16:54] [74be16979710d4c4e7c6647856088456]
- RM      [Variance Reduction Matrix] [] [2008-12-06 14:19:05] [74be16979710d4c4e7c6647856088456]
Feedback Forum
2008-12-06 14:20:25 [Ken Wright] [reply
je hebt hier enkel lambda berekend om jouw tijdreeks stationair te maken. maar je moet ook misschien seizoenaal en niet seizoenaal differentieren.
ACF:http://www.freestatistics.org/blog/index.php?v=date/2008/Dec/06/t1228572940rrftoszxa5r09nt.htm
het is hier een langzaam dalend verloop: LT
spectraal analyse:http://www.freestatistics.org/blog/index.php?v=date/2008/Dec/06/t1228573066x1ato5ftwgz6ios.htm
rawperiodogram: hoge waarde bij lage frequentie en dalend verloop: LT trend
variance reduction matrix:http://www.freestatistics.org/blog/index.php?v=date/2008/Dec/06/t12285731740q2e7svyvquqt3g.htm
geeft lage variantie bij d=1 D=0
=> men zal dus best enkel niet seizoenaal differentieren

Post a new message
Dataseries X:
147.4
148
158.1
165
187
190.3
182.4
168.8
151.2
120.1
112.5
106.2
107.1
108.5
106.5
108.3
125.6
124
127.2
136.9
135.8
124.3
115.4
113.6
114.4
118.4
117
116.5
115.4
113.6
117.4
116.9
116.4
111.1
110.2
118.9
131.8
130.6
138.3
148.4
148.7
144.3
152.5
162.9
167.2
166.5
185.6
193.2
207.8
223.4
246.4
266.3
264.3
255.8
259.5
289.1
288.5
243.8
224.8
177
171.6


Summary of computational transaction
Raw Inputview raw input (R code)
Raw Outputview raw output of R engine
Computing time2 seconds
R Server'Herman Ole Andreas Wold' @ 193.190.124.10:1001

\begin{tabular}{lllllllll}
\hline
Summary of computational transaction \tabularnewline
Raw Input & view raw input (R code)  \tabularnewline
Raw Output & view raw output of R engine  \tabularnewline
Computing time & 2 seconds \tabularnewline
R Server & 'Herman Ole Andreas Wold' @ 193.190.124.10:1001 \tabularnewline
\hline
\end{tabular}
%Source: https://freestatistics.org/blog/index.php?pk=28457&T=0

[TABLE]
[ROW][C]Summary of computational transaction[/C][/ROW]
[ROW][C]Raw Input[/C][C]view raw input (R code) [/C][/ROW]
[ROW][C]Raw Output[/C][C]view raw output of R engine [/C][/ROW]
[ROW][C]Computing time[/C][C]2 seconds[/C][/ROW]
[ROW][C]R Server[/C][C]'Herman Ole Andreas Wold' @ 193.190.124.10:1001[/C][/ROW]
[/TABLE]
Source: https://freestatistics.org/blog/index.php?pk=28457&T=0

Globally Unique Identifier (entire table): ba.freestatistics.org/blog/index.php?pk=28457&T=0

As an alternative you can also use a QR Code:  

The GUIDs for individual cells are displayed in the table below:

Summary of computational transaction
Raw Inputview raw input (R code)
Raw Outputview raw output of R engine
Computing time2 seconds
R Server'Herman Ole Andreas Wold' @ 193.190.124.10:1001


Standard Deviation-Mean Plot
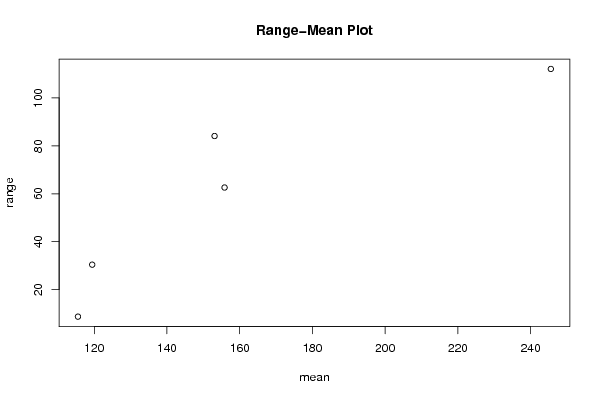
SectionMeanStandard DeviationRange
1153.08333333333328.290243526485984.1
2119.43333333333310.991759999144330.4
3115.5166666666672.728247300618728.7
4155.83333333333319.879744526131262.6
5245.55833333333332.8526035590189112.1

\begin{tabular}{lllllllll}
\hline
Standard Deviation-Mean Plot \tabularnewline
Section & Mean & Standard Deviation & Range \tabularnewline
1 & 153.083333333333 & 28.2902435264859 & 84.1 \tabularnewline
2 & 119.433333333333 & 10.9917599991443 & 30.4 \tabularnewline
3 & 115.516666666667 & 2.72824730061872 & 8.7 \tabularnewline
4 & 155.833333333333 & 19.8797445261312 & 62.6 \tabularnewline
5 & 245.558333333333 & 32.8526035590189 & 112.1 \tabularnewline
\hline
\end{tabular}
%Source: https://freestatistics.org/blog/index.php?pk=28457&T=1

[TABLE]
[ROW][C]Standard Deviation-Mean Plot[/C][/ROW]
[ROW][C]Section[/C][C]Mean[/C][C]Standard Deviation[/C][C]Range[/C][/ROW]
[ROW][C]1[/C][C]153.083333333333[/C][C]28.2902435264859[/C][C]84.1[/C][/ROW]
[ROW][C]2[/C][C]119.433333333333[/C][C]10.9917599991443[/C][C]30.4[/C][/ROW]
[ROW][C]3[/C][C]115.516666666667[/C][C]2.72824730061872[/C][C]8.7[/C][/ROW]
[ROW][C]4[/C][C]155.833333333333[/C][C]19.8797445261312[/C][C]62.6[/C][/ROW]
[ROW][C]5[/C][C]245.558333333333[/C][C]32.8526035590189[/C][C]112.1[/C][/ROW]
[/TABLE]
Source: https://freestatistics.org/blog/index.php?pk=28457&T=1

Globally Unique Identifier (entire table): ba.freestatistics.org/blog/index.php?pk=28457&T=1

As an alternative you can also use a QR Code:  

The GUIDs for individual cells are displayed in the table below:

Standard Deviation-Mean Plot
SectionMeanStandard DeviationRange
1153.08333333333328.290243526485984.1
2119.43333333333310.991759999144330.4
3115.5166666666672.728247300618728.7
4155.83333333333319.879744526131262.6
5245.55833333333332.8526035590189112.1


Regression: S.E.(k) = alpha + beta * Mean(k)
alpha-12.1676571453671
beta0.197081273886987
S.D.0.0741225132023088
T-STAT2.65885849484186
p-value0.0764131084062974

\begin{tabular}{lllllllll}
\hline
Regression: S.E.(k) = alpha + beta * Mean(k) \tabularnewline
alpha & -12.1676571453671 \tabularnewline
beta & 0.197081273886987 \tabularnewline
S.D. & 0.0741225132023088 \tabularnewline
T-STAT & 2.65885849484186 \tabularnewline
p-value & 0.0764131084062974 \tabularnewline
\hline
\end{tabular}
%Source: https://freestatistics.org/blog/index.php?pk=28457&T=2

[TABLE]
[ROW][C]Regression: S.E.(k) = alpha + beta * Mean(k)[/C][/ROW]
[ROW][C]alpha[/C][C]-12.1676571453671[/C][/ROW]
[ROW][C]beta[/C][C]0.197081273886987[/C][/ROW]
[ROW][C]S.D.[/C][C]0.0741225132023088[/C][/ROW]
[ROW][C]T-STAT[/C][C]2.65885849484186[/C][/ROW]
[ROW][C]p-value[/C][C]0.0764131084062974[/C][/ROW]
[/TABLE]
Source: https://freestatistics.org/blog/index.php?pk=28457&T=2

Globally Unique Identifier (entire table): ba.freestatistics.org/blog/index.php?pk=28457&T=2

As an alternative you can also use a QR Code:  

The GUIDs for individual cells are displayed in the table below:

Regression: S.E.(k) = alpha + beta * Mean(k)
alpha-12.1676571453671
beta0.197081273886987
S.D.0.0741225132023088
T-STAT2.65885849484186
p-value0.0764131084062974


Regression: ln S.E.(k) = alpha + beta * ln Mean(k)
alpha-10.1824722725693
beta2.55370087273647
S.D.1.24849289699446
T-STAT2.04542683333168
p-value0.133348792125259
Lambda-1.55370087273647

\begin{tabular}{lllllllll}
\hline
Regression: ln S.E.(k) = alpha + beta * ln Mean(k) \tabularnewline
alpha & -10.1824722725693 \tabularnewline
beta & 2.55370087273647 \tabularnewline
S.D. & 1.24849289699446 \tabularnewline
T-STAT & 2.04542683333168 \tabularnewline
p-value & 0.133348792125259 \tabularnewline
Lambda & -1.55370087273647 \tabularnewline
\hline
\end{tabular}
%Source: https://freestatistics.org/blog/index.php?pk=28457&T=3

[TABLE]
[ROW][C]Regression: ln S.E.(k) = alpha + beta * ln Mean(k)[/C][/ROW]
[ROW][C]alpha[/C][C]-10.1824722725693[/C][/ROW]
[ROW][C]beta[/C][C]2.55370087273647[/C][/ROW]
[ROW][C]S.D.[/C][C]1.24849289699446[/C][/ROW]
[ROW][C]T-STAT[/C][C]2.04542683333168[/C][/ROW]
[ROW][C]p-value[/C][C]0.133348792125259[/C][/ROW]
[ROW][C]Lambda[/C][C]-1.55370087273647[/C][/ROW]
[/TABLE]
Source: https://freestatistics.org/blog/index.php?pk=28457&T=3

Globally Unique Identifier (entire table): ba.freestatistics.org/blog/index.php?pk=28457&T=3

As an alternative you can also use a QR Code:  

The GUIDs for individual cells are displayed in the table below:

Regression: ln S.E.(k) = alpha + beta * ln Mean(k)
alpha-10.1824722725693
beta2.55370087273647
S.D.1.24849289699446
T-STAT2.04542683333168
p-value0.133348792125259
Lambda-1.55370087273647


Parameters (Session):
par1 = 12 ;
Parameters (R input):
par1 = 12 ;
R code (references can be found in the software module):
par1 <- as.numeric(par1)
(n <- length(x))
(np <- floor(n / par1))
arr <- array(NA,dim=c(par1,np))
j <- 0
k <- 1
for (i in 1:(np*par1))
{
j = j + 1
arr[j,k] <- x[i]
if (j == par1) {
j = 0
k=k+1
}
}
arr
arr.mean <- array(NA,dim=np)
arr.sd <- array(NA,dim=np)
arr.range <- array(NA,dim=np)
for (j in 1:np)
{
arr.mean[j] <- mean(arr[,j],na.rm=TRUE)
arr.sd[j] <- sd(arr[,j],na.rm=TRUE)
arr.range[j] <- max(arr[,j],na.rm=TRUE) - min(arr[,j],na.rm=TRUE)
}
arr.mean
arr.sd
arr.range
(lm1 <- lm(arr.sd~arr.mean))
(lnlm1 <- lm(log(arr.sd)~log(arr.mean)))
(lm2 <- lm(arr.range~arr.mean))
bitmap(file='test1.png')
plot(arr.mean,arr.sd,main='Standard Deviation-Mean Plot',xlab='mean',ylab='standard deviation')
dev.off()
bitmap(file='test2.png')
plot(arr.mean,arr.range,main='Range-Mean Plot',xlab='mean',ylab='range')
dev.off()
load(file='createtable')
a<-table.start()
a<-table.row.start(a)
a<-table.element(a,'Standard Deviation-Mean Plot',4,TRUE)
a<-table.row.end(a)
a<-table.row.start(a)
a<-table.element(a,'Section',header=TRUE)
a<-table.element(a,'Mean',header=TRUE)
a<-table.element(a,'Standard Deviation',header=TRUE)
a<-table.element(a,'Range',header=TRUE)
a<-table.row.end(a)
for (j in 1:np) {
a<-table.row.start(a)
a<-table.element(a,j,header=TRUE)
a<-table.element(a,arr.mean[j])
a<-table.element(a,arr.sd[j] )
a<-table.element(a,arr.range[j] )
a<-table.row.end(a)
}
a<-table.end(a)
table.save(a,file='mytable.tab')
a<-table.start()
a<-table.row.start(a)
a<-table.element(a,'Regression: S.E.(k) = alpha + beta * Mean(k)',2,TRUE)
a<-table.row.end(a)
a<-table.row.start(a)
a<-table.element(a,'alpha',header=TRUE)
a<-table.element(a,lm1$coefficients[[1]])
a<-table.row.end(a)
a<-table.row.start(a)
a<-table.element(a,'beta',header=TRUE)
a<-table.element(a,lm1$coefficients[[2]])
a<-table.row.end(a)
a<-table.row.start(a)
a<-table.element(a,'S.D.',header=TRUE)
a<-table.element(a,summary(lm1)$coefficients[2,2])
a<-table.row.end(a)
a<-table.row.start(a)
a<-table.element(a,'T-STAT',header=TRUE)
a<-table.element(a,summary(lm1)$coefficients[2,3])
a<-table.row.end(a)
a<-table.row.start(a)
a<-table.element(a,'p-value',header=TRUE)
a<-table.element(a,summary(lm1)$coefficients[2,4])
a<-table.row.end(a)
a<-table.end(a)
table.save(a,file='mytable1.tab')
a<-table.start()
a<-table.row.start(a)
a<-table.element(a,'Regression: ln S.E.(k) = alpha + beta * ln Mean(k)',2,TRUE)
a<-table.row.end(a)
a<-table.row.start(a)
a<-table.element(a,'alpha',header=TRUE)
a<-table.element(a,lnlm1$coefficients[[1]])
a<-table.row.end(a)
a<-table.row.start(a)
a<-table.element(a,'beta',header=TRUE)
a<-table.element(a,lnlm1$coefficients[[2]])
a<-table.row.end(a)
a<-table.row.start(a)
a<-table.element(a,'S.D.',header=TRUE)
a<-table.element(a,summary(lnlm1)$coefficients[2,2])
a<-table.row.end(a)
a<-table.row.start(a)
a<-table.element(a,'T-STAT',header=TRUE)
a<-table.element(a,summary(lnlm1)$coefficients[2,3])
a<-table.row.end(a)
a<-table.row.start(a)
a<-table.element(a,'p-value',header=TRUE)
a<-table.element(a,summary(lnlm1)$coefficients[2,4])
a<-table.row.end(a)
a<-table.row.start(a)
a<-table.element(a,'Lambda',header=TRUE)
a<-table.element(a,1-lnlm1$coefficients[[2]])
a<-table.row.end(a)
a<-table.end(a)
table.save(a,file='mytable2.tab')