Free Statistics

of Irreproducible Research!

Author's title

Author*Unverified author*
R Software Modulerwasp_autocorrelation.wasp
Title produced by software(Partial) Autocorrelation Function
Date of computationTue, 02 Dec 2008 13:31:04 -0700
Cite this page as followsStatistical Computations at FreeStatistics.org, Office for Research Development and Education, URL https://freestatistics.org/blog/index.php?v=date/2008/Dec/02/t1228249891sphi3rufqhhvlgo.htm/, Retrieved Sun, 19 May 2024 10:50:06 +0000
Statistical Computations at FreeStatistics.org, Office for Research Development and Education, URL https://freestatistics.org/blog/index.php?pk=28387, Retrieved Sun, 19 May 2024 10:50:06 +0000
QR Codes:

Original text written by user:
IsPrivate?No (this computation is public)
User-defined keywordsVan Dooren Leen
Estimated Impact150
Family? (F = Feedback message, R = changed R code, M = changed R Module, P = changed Parameters, D = changed Data)
F     [Univariate Data Series] [Airline data] [2007-10-18 09:58:47] [42daae401fd3def69a25014f2252b4c2]
F RMPD    [(Partial) Autocorrelation Function] [NST Q8] [2008-12-02 20:31:04] [006ad2c49b6a7c2ad6ab685cfc1dae56] [Current]
Feedback Forum
2008-12-07 11:23:56 [006ad2c49b6a7c2ad6ab685cfc1dae56] [reply
Goede differentiaties.

Post a new message
Dataseries X:
392
394
392
396
392
396
419
421
420
418
410
418
426
428
430
424
423
427
441
449
452
462
455
461
461
463
462
456
455
456
472
472
471
465
459
465
468
467
463
460
462
461
476
476
471
453
443
442
444
438
427
424
416
406
431
434
418
412
404
409
412
406
398
397
385
390
413
413
401
397


Summary of computational transaction
Raw Inputview raw input (R code)
Raw Outputview raw output of R engine
Computing time2 seconds
R Server'Gwilym Jenkins' @ 72.249.127.135

\begin{tabular}{lllllllll}
\hline
Summary of computational transaction \tabularnewline
Raw Input & view raw input (R code)  \tabularnewline
Raw Output & view raw output of R engine  \tabularnewline
Computing time & 2 seconds \tabularnewline
R Server & 'Gwilym Jenkins' @ 72.249.127.135 \tabularnewline
\hline
\end{tabular}
%Source: https://freestatistics.org/blog/index.php?pk=28387&T=0

[TABLE]
[ROW][C]Summary of computational transaction[/C][/ROW]
[ROW][C]Raw Input[/C][C]view raw input (R code) [/C][/ROW]
[ROW][C]Raw Output[/C][C]view raw output of R engine [/C][/ROW]
[ROW][C]Computing time[/C][C]2 seconds[/C][/ROW]
[ROW][C]R Server[/C][C]'Gwilym Jenkins' @ 72.249.127.135[/C][/ROW]
[/TABLE]
Source: https://freestatistics.org/blog/index.php?pk=28387&T=0

Globally Unique Identifier (entire table): ba.freestatistics.org/blog/index.php?pk=28387&T=0

As an alternative you can also use a QR Code:  

The GUIDs for individual cells are displayed in the table below:

Summary of computational transaction
Raw Inputview raw input (R code)
Raw Outputview raw output of R engine
Computing time2 seconds
R Server'Gwilym Jenkins' @ 72.249.127.135


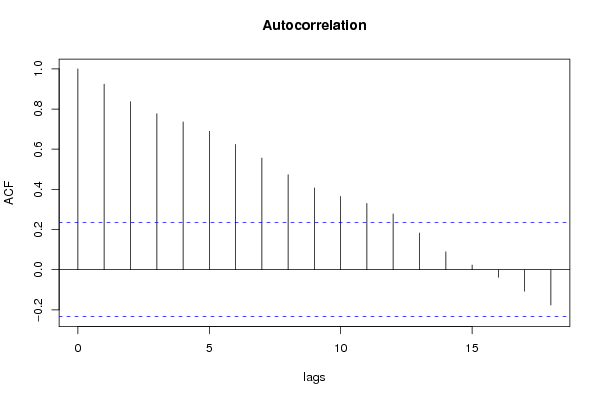
Autocorrelation Function
Time lag kACF(k)T-STATP-value
10.9238887.72980
20.836767.00080
30.7770566.50130
40.7358116.15620
50.6892595.76680
60.624085.22141e-06
70.5561074.65278e-06
80.4730593.95799e-05
90.4072383.40720.000546
100.3644793.04950.001618
110.3300082.7610.003676
120.2776292.32280.011551
130.1825781.52760.065565
140.0885910.74120.230523
150.0225830.18890.425342
16-0.038514-0.32220.374118
17-0.107355-0.89820.18608
18-0.17651-1.47680.072108

\begin{tabular}{lllllllll}
\hline
Autocorrelation Function \tabularnewline
Time lag k & ACF(k) & T-STAT & P-value \tabularnewline
1 & 0.923888 & 7.7298 & 0 \tabularnewline
2 & 0.83676 & 7.0008 & 0 \tabularnewline
3 & 0.777056 & 6.5013 & 0 \tabularnewline
4 & 0.735811 & 6.1562 & 0 \tabularnewline
5 & 0.689259 & 5.7668 & 0 \tabularnewline
6 & 0.62408 & 5.2214 & 1e-06 \tabularnewline
7 & 0.556107 & 4.6527 & 8e-06 \tabularnewline
8 & 0.473059 & 3.9579 & 9e-05 \tabularnewline
9 & 0.407238 & 3.4072 & 0.000546 \tabularnewline
10 & 0.364479 & 3.0495 & 0.001618 \tabularnewline
11 & 0.330008 & 2.761 & 0.003676 \tabularnewline
12 & 0.277629 & 2.3228 & 0.011551 \tabularnewline
13 & 0.182578 & 1.5276 & 0.065565 \tabularnewline
14 & 0.088591 & 0.7412 & 0.230523 \tabularnewline
15 & 0.022583 & 0.1889 & 0.425342 \tabularnewline
16 & -0.038514 & -0.3222 & 0.374118 \tabularnewline
17 & -0.107355 & -0.8982 & 0.18608 \tabularnewline
18 & -0.17651 & -1.4768 & 0.072108 \tabularnewline
\hline
\end{tabular}
%Source: https://freestatistics.org/blog/index.php?pk=28387&T=1

[TABLE]
[ROW][C]Autocorrelation Function[/C][/ROW]
[ROW][C]Time lag k[/C][C]ACF(k)[/C][C]T-STAT[/C][C]P-value[/C][/ROW]
[ROW][C]1[/C][C]0.923888[/C][C]7.7298[/C][C]0[/C][/ROW]
[ROW][C]2[/C][C]0.83676[/C][C]7.0008[/C][C]0[/C][/ROW]
[ROW][C]3[/C][C]0.777056[/C][C]6.5013[/C][C]0[/C][/ROW]
[ROW][C]4[/C][C]0.735811[/C][C]6.1562[/C][C]0[/C][/ROW]
[ROW][C]5[/C][C]0.689259[/C][C]5.7668[/C][C]0[/C][/ROW]
[ROW][C]6[/C][C]0.62408[/C][C]5.2214[/C][C]1e-06[/C][/ROW]
[ROW][C]7[/C][C]0.556107[/C][C]4.6527[/C][C]8e-06[/C][/ROW]
[ROW][C]8[/C][C]0.473059[/C][C]3.9579[/C][C]9e-05[/C][/ROW]
[ROW][C]9[/C][C]0.407238[/C][C]3.4072[/C][C]0.000546[/C][/ROW]
[ROW][C]10[/C][C]0.364479[/C][C]3.0495[/C][C]0.001618[/C][/ROW]
[ROW][C]11[/C][C]0.330008[/C][C]2.761[/C][C]0.003676[/C][/ROW]
[ROW][C]12[/C][C]0.277629[/C][C]2.3228[/C][C]0.011551[/C][/ROW]
[ROW][C]13[/C][C]0.182578[/C][C]1.5276[/C][C]0.065565[/C][/ROW]
[ROW][C]14[/C][C]0.088591[/C][C]0.7412[/C][C]0.230523[/C][/ROW]
[ROW][C]15[/C][C]0.022583[/C][C]0.1889[/C][C]0.425342[/C][/ROW]
[ROW][C]16[/C][C]-0.038514[/C][C]-0.3222[/C][C]0.374118[/C][/ROW]
[ROW][C]17[/C][C]-0.107355[/C][C]-0.8982[/C][C]0.18608[/C][/ROW]
[ROW][C]18[/C][C]-0.17651[/C][C]-1.4768[/C][C]0.072108[/C][/ROW]
[/TABLE]
Source: https://freestatistics.org/blog/index.php?pk=28387&T=1

Globally Unique Identifier (entire table): ba.freestatistics.org/blog/index.php?pk=28387&T=1

As an alternative you can also use a QR Code:  

The GUIDs for individual cells are displayed in the table below:

Autocorrelation Function
Time lag kACF(k)T-STATP-value
10.9238887.72980
20.836767.00080
30.7770566.50130
40.7358116.15620
50.6892595.76680
60.624085.22141e-06
70.5561074.65278e-06
80.4730593.95799e-05
90.4072383.40720.000546
100.3644793.04950.001618
110.3300082.7610.003676
120.2776292.32280.011551
130.1825781.52760.065565
140.0885910.74120.230523
150.0225830.18890.425342
16-0.038514-0.32220.374118
17-0.107355-0.89820.18608
18-0.17651-1.47680.072108


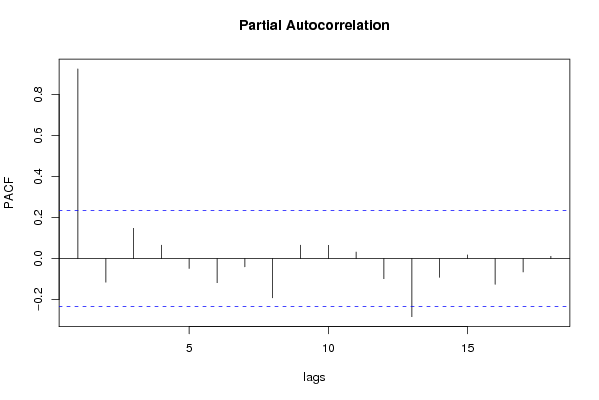
Partial Autocorrelation Function
Time lag kPACF(k)T-STATP-value
10.9238887.72980
2-0.114794-0.96040.170071
30.1473771.2330.110842
40.0654130.54730.292962
5-0.048268-0.40380.343782
6-0.1174-0.98220.164682
7-0.040163-0.3360.368927
8-0.19109-1.59880.057188
90.0650340.54410.294047
100.0649260.54320.294356
110.031730.26550.395713
12-0.097956-0.81960.207626
13-0.282968-2.36750.010339
14-0.091533-0.76580.223179
150.0178280.14920.44093
16-0.125342-1.04870.148964
17-0.065357-0.54680.293122
180.0108510.09080.463961

\begin{tabular}{lllllllll}
\hline
Partial Autocorrelation Function \tabularnewline
Time lag k & PACF(k) & T-STAT & P-value \tabularnewline
1 & 0.923888 & 7.7298 & 0 \tabularnewline
2 & -0.114794 & -0.9604 & 0.170071 \tabularnewline
3 & 0.147377 & 1.233 & 0.110842 \tabularnewline
4 & 0.065413 & 0.5473 & 0.292962 \tabularnewline
5 & -0.048268 & -0.4038 & 0.343782 \tabularnewline
6 & -0.1174 & -0.9822 & 0.164682 \tabularnewline
7 & -0.040163 & -0.336 & 0.368927 \tabularnewline
8 & -0.19109 & -1.5988 & 0.057188 \tabularnewline
9 & 0.065034 & 0.5441 & 0.294047 \tabularnewline
10 & 0.064926 & 0.5432 & 0.294356 \tabularnewline
11 & 0.03173 & 0.2655 & 0.395713 \tabularnewline
12 & -0.097956 & -0.8196 & 0.207626 \tabularnewline
13 & -0.282968 & -2.3675 & 0.010339 \tabularnewline
14 & -0.091533 & -0.7658 & 0.223179 \tabularnewline
15 & 0.017828 & 0.1492 & 0.44093 \tabularnewline
16 & -0.125342 & -1.0487 & 0.148964 \tabularnewline
17 & -0.065357 & -0.5468 & 0.293122 \tabularnewline
18 & 0.010851 & 0.0908 & 0.463961 \tabularnewline
\hline
\end{tabular}
%Source: https://freestatistics.org/blog/index.php?pk=28387&T=2

[TABLE]
[ROW][C]Partial Autocorrelation Function[/C][/ROW]
[ROW][C]Time lag k[/C][C]PACF(k)[/C][C]T-STAT[/C][C]P-value[/C][/ROW]
[ROW][C]1[/C][C]0.923888[/C][C]7.7298[/C][C]0[/C][/ROW]
[ROW][C]2[/C][C]-0.114794[/C][C]-0.9604[/C][C]0.170071[/C][/ROW]
[ROW][C]3[/C][C]0.147377[/C][C]1.233[/C][C]0.110842[/C][/ROW]
[ROW][C]4[/C][C]0.065413[/C][C]0.5473[/C][C]0.292962[/C][/ROW]
[ROW][C]5[/C][C]-0.048268[/C][C]-0.4038[/C][C]0.343782[/C][/ROW]
[ROW][C]6[/C][C]-0.1174[/C][C]-0.9822[/C][C]0.164682[/C][/ROW]
[ROW][C]7[/C][C]-0.040163[/C][C]-0.336[/C][C]0.368927[/C][/ROW]
[ROW][C]8[/C][C]-0.19109[/C][C]-1.5988[/C][C]0.057188[/C][/ROW]
[ROW][C]9[/C][C]0.065034[/C][C]0.5441[/C][C]0.294047[/C][/ROW]
[ROW][C]10[/C][C]0.064926[/C][C]0.5432[/C][C]0.294356[/C][/ROW]
[ROW][C]11[/C][C]0.03173[/C][C]0.2655[/C][C]0.395713[/C][/ROW]
[ROW][C]12[/C][C]-0.097956[/C][C]-0.8196[/C][C]0.207626[/C][/ROW]
[ROW][C]13[/C][C]-0.282968[/C][C]-2.3675[/C][C]0.010339[/C][/ROW]
[ROW][C]14[/C][C]-0.091533[/C][C]-0.7658[/C][C]0.223179[/C][/ROW]
[ROW][C]15[/C][C]0.017828[/C][C]0.1492[/C][C]0.44093[/C][/ROW]
[ROW][C]16[/C][C]-0.125342[/C][C]-1.0487[/C][C]0.148964[/C][/ROW]
[ROW][C]17[/C][C]-0.065357[/C][C]-0.5468[/C][C]0.293122[/C][/ROW]
[ROW][C]18[/C][C]0.010851[/C][C]0.0908[/C][C]0.463961[/C][/ROW]
[/TABLE]
Source: https://freestatistics.org/blog/index.php?pk=28387&T=2

Globally Unique Identifier (entire table): ba.freestatistics.org/blog/index.php?pk=28387&T=2

As an alternative you can also use a QR Code:  

The GUIDs for individual cells are displayed in the table below:

Partial Autocorrelation Function
Time lag kPACF(k)T-STATP-value
10.9238887.72980
2-0.114794-0.96040.170071
30.1473771.2330.110842
40.0654130.54730.292962
5-0.048268-0.40380.343782
6-0.1174-0.98220.164682
7-0.040163-0.3360.368927
8-0.19109-1.59880.057188
90.0650340.54410.294047
100.0649260.54320.294356
110.031730.26550.395713
12-0.097956-0.81960.207626
13-0.282968-2.36750.010339
14-0.091533-0.76580.223179
150.0178280.14920.44093
16-0.125342-1.04870.148964
17-0.065357-0.54680.293122
180.0108510.09080.463961


Parameters (Session):
par1 = Default ; par2 = 1 ; par3 = 1 ; par4 = 1 ; par5 = 12 ;
Parameters (R input):
par1 = Default ; par2 = 1 ; par3 = 0 ; par4 = 0 ; par5 = 12 ;
R code (references can be found in the software module):
if (par1 == 'Default') {
par1 = 10*log10(length(x))
} else {
par1 <- as.numeric(par1)
}
par2 <- as.numeric(par2)
par3 <- as.numeric(par3)
par4 <- as.numeric(par4)
par5 <- as.numeric(par5)
if (par2 == 0) {
x <- log(x)
} else {
x <- (x ^ par2 - 1) / par2
}
if (par3 > 0) x <- diff(x,lag=1,difference=par3)
if (par4 > 0) x <- diff(x,lag=par5,difference=par4)
bitmap(file='pic1.png')
racf <- acf(x,par1,main='Autocorrelation',xlab='lags',ylab='ACF')
dev.off()
bitmap(file='pic2.png')
rpacf <- pacf(x,par1,main='Partial Autocorrelation',xlab='lags',ylab='PACF')
dev.off()
(myacf <- c(racf$acf))
(mypacf <- c(rpacf$acf))
lengthx <- length(x)
sqrtn <- sqrt(lengthx)
load(file='createtable')
a<-table.start()
a<-table.row.start(a)
a<-table.element(a,'Autocorrelation Function',4,TRUE)
a<-table.row.end(a)
a<-table.row.start(a)
a<-table.element(a,'Time lag k',header=TRUE)
a<-table.element(a,hyperlink('basics.htm','ACF(k)','click here for more information about the Autocorrelation Function'),header=TRUE)
a<-table.element(a,'T-STAT',header=TRUE)
a<-table.element(a,'P-value',header=TRUE)
a<-table.row.end(a)
for (i in 2:(par1+1)) {
a<-table.row.start(a)
a<-table.element(a,i-1,header=TRUE)
a<-table.element(a,round(myacf[i],6))
mytstat <- myacf[i]*sqrtn
a<-table.element(a,round(mytstat,4))
a<-table.element(a,round(1-pt(abs(mytstat),lengthx),6))
a<-table.row.end(a)
}
a<-table.end(a)
table.save(a,file='mytable.tab')
a<-table.start()
a<-table.row.start(a)
a<-table.element(a,'Partial Autocorrelation Function',4,TRUE)
a<-table.row.end(a)
a<-table.row.start(a)
a<-table.element(a,'Time lag k',header=TRUE)
a<-table.element(a,hyperlink('basics.htm','PACF(k)','click here for more information about the Partial Autocorrelation Function'),header=TRUE)
a<-table.element(a,'T-STAT',header=TRUE)
a<-table.element(a,'P-value',header=TRUE)
a<-table.row.end(a)
for (i in 1:par1) {
a<-table.row.start(a)
a<-table.element(a,i,header=TRUE)
a<-table.element(a,round(mypacf[i],6))
mytstat <- mypacf[i]*sqrtn
a<-table.element(a,round(mytstat,4))
a<-table.element(a,round(1-pt(abs(mytstat),lengthx),6))
a<-table.row.end(a)
}
a<-table.end(a)
table.save(a,file='mytable1.tab')