Free Statistics

of Irreproducible Research!

Author's title

Author*Unverified author*
R Software Modulerwasp_autocorrelation.wasp
Title produced by software(Partial) Autocorrelation Function
Date of computationTue, 02 Dec 2008 13:26:52 -0700
Cite this page as followsStatistical Computations at FreeStatistics.org, Office for Research Development and Education, URL https://freestatistics.org/blog/index.php?v=date/2008/Dec/02/t1228249730rbw01yowdfhdlwm.htm/, Retrieved Sun, 19 May 2024 10:05:28 +0000
Statistical Computations at FreeStatistics.org, Office for Research Development and Education, URL https://freestatistics.org/blog/index.php?pk=28379, Retrieved Sun, 19 May 2024 10:05:28 +0000
QR Codes:

Original text written by user:
IsPrivate?No (this computation is public)
User-defined keywordsVan Dooren Leen
Estimated Impact142
Family? (F = Feedback message, R = changed R code, M = changed R Module, P = changed Parameters, D = changed Data)
F     [Univariate Data Series] [Airline data] [2007-10-18 09:58:47] [42daae401fd3def69a25014f2252b4c2]
F RMPD    [(Partial) Autocorrelation Function] [NST Q8] [2008-12-02 20:26:52] [006ad2c49b6a7c2ad6ab685cfc1dae56] [Current]
Feedback Forum
2008-12-06 19:40:43 [Stefan Temmerman] [reply
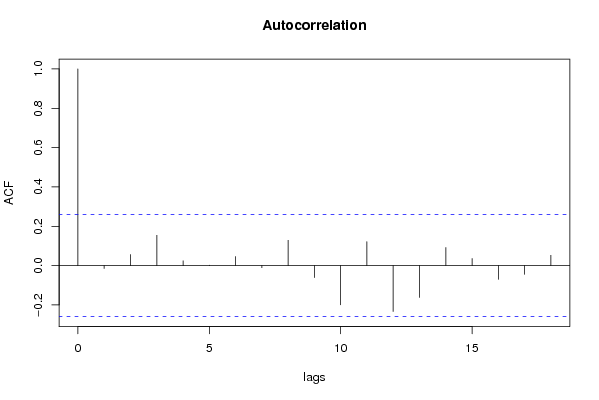
De student heeft de tijdreeks mooi stationair gemaakt, alle correlaties vallen binnen het betrouwbaarheidsinterval na de differentiatie. De eerste verticale lijn is voor ons irrelevant.
2008-12-07 11:24:45 [006ad2c49b6a7c2ad6ab685cfc1dae56] [reply
Goede differentiaties.
2008-12-07 11:58:49 [Lana Van Wesemael] [reply
Ook hier geeft de studente haar stappen logisch weer. De studente schrijft dat alle correlatiecoëfficiënten binnen het betrouwbaarheidsinterval vallen, behalve de eerste. Maar we moeten echter niet kijken naar het streepje op lag 0. De studente is vergeten om de juiste lambda waarde te zoeken. Deze kan men vinden met behulp van de standard deviation mean plot, er wordt dan 2 tabellen gegenereerd waar de lambda waarde in gegeven staat.
2008-12-08 19:46:08 [Birgit Van Dyck] [reply
De student is vergeten de lambda te berrekenen. Dit kan met behulp van de standard deviation-mean plot. De tabel geeft dan de optimale Lambda waarde weer om de tijdreeks stationair te maken.

Post a new message
Dataseries X:
392
394
392
396
392
396
419
421
420
418
410
418
426
428
430
424
423
427
441
449
452
462
455
461
461
463
462
456
455
456
472
472
471
465
459
465
468
467
463
460
462
461
476
476
471
453
443
442
444
438
427
424
416
406
431
434
418
412
404
409
412
406
398
397
385
390
413
413
401
397


Summary of computational transaction
Raw Inputview raw input (R code)
Raw Outputview raw output of R engine
Computing time2 seconds
R Server'Gwilym Jenkins' @ 72.249.127.135

\begin{tabular}{lllllllll}
\hline
Summary of computational transaction \tabularnewline
Raw Input & view raw input (R code)  \tabularnewline
Raw Output & view raw output of R engine  \tabularnewline
Computing time & 2 seconds \tabularnewline
R Server & 'Gwilym Jenkins' @ 72.249.127.135 \tabularnewline
\hline
\end{tabular}
%Source: https://freestatistics.org/blog/index.php?pk=28379&T=0

[TABLE]
[ROW][C]Summary of computational transaction[/C][/ROW]
[ROW][C]Raw Input[/C][C]view raw input (R code) [/C][/ROW]
[ROW][C]Raw Output[/C][C]view raw output of R engine [/C][/ROW]
[ROW][C]Computing time[/C][C]2 seconds[/C][/ROW]
[ROW][C]R Server[/C][C]'Gwilym Jenkins' @ 72.249.127.135[/C][/ROW]
[/TABLE]
Source: https://freestatistics.org/blog/index.php?pk=28379&T=0

Globally Unique Identifier (entire table): ba.freestatistics.org/blog/index.php?pk=28379&T=0

As an alternative you can also use a QR Code:  

The GUIDs for individual cells are displayed in the table below:

Summary of computational transaction
Raw Inputview raw input (R code)
Raw Outputview raw output of R engine
Computing time2 seconds
R Server'Gwilym Jenkins' @ 72.249.127.135


Autocorrelation Function
Time lag kACF(k)T-STATP-value
1-0.014143-0.10680.457671
20.0558190.42140.337516
30.1540121.16280.124885
40.0245640.18550.426766
50.0019830.0150.494055
60.0462390.34910.364152
7-0.010477-0.07910.468615
80.1286920.97160.167677
9-0.060857-0.45950.323826
10-0.199637-1.50720.068637
110.1214220.91670.181576
12-0.233167-1.76040.041855
13-0.161938-1.22260.113256
140.0920590.6950.24493
150.0359850.27170.393423
16-0.06958-0.52530.300699
17-0.044058-0.33260.370316
180.0525030.39640.34665

\begin{tabular}{lllllllll}
\hline
Autocorrelation Function \tabularnewline
Time lag k & ACF(k) & T-STAT & P-value \tabularnewline
1 & -0.014143 & -0.1068 & 0.457671 \tabularnewline
2 & 0.055819 & 0.4214 & 0.337516 \tabularnewline
3 & 0.154012 & 1.1628 & 0.124885 \tabularnewline
4 & 0.024564 & 0.1855 & 0.426766 \tabularnewline
5 & 0.001983 & 0.015 & 0.494055 \tabularnewline
6 & 0.046239 & 0.3491 & 0.364152 \tabularnewline
7 & -0.010477 & -0.0791 & 0.468615 \tabularnewline
8 & 0.128692 & 0.9716 & 0.167677 \tabularnewline
9 & -0.060857 & -0.4595 & 0.323826 \tabularnewline
10 & -0.199637 & -1.5072 & 0.068637 \tabularnewline
11 & 0.121422 & 0.9167 & 0.181576 \tabularnewline
12 & -0.233167 & -1.7604 & 0.041855 \tabularnewline
13 & -0.161938 & -1.2226 & 0.113256 \tabularnewline
14 & 0.092059 & 0.695 & 0.24493 \tabularnewline
15 & 0.035985 & 0.2717 & 0.393423 \tabularnewline
16 & -0.06958 & -0.5253 & 0.300699 \tabularnewline
17 & -0.044058 & -0.3326 & 0.370316 \tabularnewline
18 & 0.052503 & 0.3964 & 0.34665 \tabularnewline
\hline
\end{tabular}
%Source: https://freestatistics.org/blog/index.php?pk=28379&T=1

[TABLE]
[ROW][C]Autocorrelation Function[/C][/ROW]
[ROW][C]Time lag k[/C][C]ACF(k)[/C][C]T-STAT[/C][C]P-value[/C][/ROW]
[ROW][C]1[/C][C]-0.014143[/C][C]-0.1068[/C][C]0.457671[/C][/ROW]
[ROW][C]2[/C][C]0.055819[/C][C]0.4214[/C][C]0.337516[/C][/ROW]
[ROW][C]3[/C][C]0.154012[/C][C]1.1628[/C][C]0.124885[/C][/ROW]
[ROW][C]4[/C][C]0.024564[/C][C]0.1855[/C][C]0.426766[/C][/ROW]
[ROW][C]5[/C][C]0.001983[/C][C]0.015[/C][C]0.494055[/C][/ROW]
[ROW][C]6[/C][C]0.046239[/C][C]0.3491[/C][C]0.364152[/C][/ROW]
[ROW][C]7[/C][C]-0.010477[/C][C]-0.0791[/C][C]0.468615[/C][/ROW]
[ROW][C]8[/C][C]0.128692[/C][C]0.9716[/C][C]0.167677[/C][/ROW]
[ROW][C]9[/C][C]-0.060857[/C][C]-0.4595[/C][C]0.323826[/C][/ROW]
[ROW][C]10[/C][C]-0.199637[/C][C]-1.5072[/C][C]0.068637[/C][/ROW]
[ROW][C]11[/C][C]0.121422[/C][C]0.9167[/C][C]0.181576[/C][/ROW]
[ROW][C]12[/C][C]-0.233167[/C][C]-1.7604[/C][C]0.041855[/C][/ROW]
[ROW][C]13[/C][C]-0.161938[/C][C]-1.2226[/C][C]0.113256[/C][/ROW]
[ROW][C]14[/C][C]0.092059[/C][C]0.695[/C][C]0.24493[/C][/ROW]
[ROW][C]15[/C][C]0.035985[/C][C]0.2717[/C][C]0.393423[/C][/ROW]
[ROW][C]16[/C][C]-0.06958[/C][C]-0.5253[/C][C]0.300699[/C][/ROW]
[ROW][C]17[/C][C]-0.044058[/C][C]-0.3326[/C][C]0.370316[/C][/ROW]
[ROW][C]18[/C][C]0.052503[/C][C]0.3964[/C][C]0.34665[/C][/ROW]
[/TABLE]
Source: https://freestatistics.org/blog/index.php?pk=28379&T=1

Globally Unique Identifier (entire table): ba.freestatistics.org/blog/index.php?pk=28379&T=1

As an alternative you can also use a QR Code:  

The GUIDs for individual cells are displayed in the table below:

Autocorrelation Function
Time lag kACF(k)T-STATP-value
1-0.014143-0.10680.457671
20.0558190.42140.337516
30.1540121.16280.124885
40.0245640.18550.426766
50.0019830.0150.494055
60.0462390.34910.364152
7-0.010477-0.07910.468615
80.1286920.97160.167677
9-0.060857-0.45950.323826
10-0.199637-1.50720.068637
110.1214220.91670.181576
12-0.233167-1.76040.041855
13-0.161938-1.22260.113256
140.0920590.6950.24493
150.0359850.27170.393423
16-0.06958-0.52530.300699
17-0.044058-0.33260.370316
180.0525030.39640.34665


Partial Autocorrelation Function
Time lag kPACF(k)T-STATP-value
1-0.014143-0.10680.457671
20.055630.420.338034
30.1560581.17820.121803
40.0277070.20920.417525
5-0.014784-0.11160.45576
60.0194180.14660.44198
7-0.01664-0.12560.450233
80.1292720.9760.166599
9-0.065962-0.4980.310199
10-0.225121-1.69960.047326
110.089930.6790.249955
12-0.210376-1.58830.058875
13-0.125885-0.95040.172958
140.1035180.78150.218857
150.1211450.91460.182121
16-0.031042-0.23440.407773
17-0.077892-0.58810.279403
180.1163630.87850.191674

\begin{tabular}{lllllllll}
\hline
Partial Autocorrelation Function \tabularnewline
Time lag k & PACF(k) & T-STAT & P-value \tabularnewline
1 & -0.014143 & -0.1068 & 0.457671 \tabularnewline
2 & 0.05563 & 0.42 & 0.338034 \tabularnewline
3 & 0.156058 & 1.1782 & 0.121803 \tabularnewline
4 & 0.027707 & 0.2092 & 0.417525 \tabularnewline
5 & -0.014784 & -0.1116 & 0.45576 \tabularnewline
6 & 0.019418 & 0.1466 & 0.44198 \tabularnewline
7 & -0.01664 & -0.1256 & 0.450233 \tabularnewline
8 & 0.129272 & 0.976 & 0.166599 \tabularnewline
9 & -0.065962 & -0.498 & 0.310199 \tabularnewline
10 & -0.225121 & -1.6996 & 0.047326 \tabularnewline
11 & 0.08993 & 0.679 & 0.249955 \tabularnewline
12 & -0.210376 & -1.5883 & 0.058875 \tabularnewline
13 & -0.125885 & -0.9504 & 0.172958 \tabularnewline
14 & 0.103518 & 0.7815 & 0.218857 \tabularnewline
15 & 0.121145 & 0.9146 & 0.182121 \tabularnewline
16 & -0.031042 & -0.2344 & 0.407773 \tabularnewline
17 & -0.077892 & -0.5881 & 0.279403 \tabularnewline
18 & 0.116363 & 0.8785 & 0.191674 \tabularnewline
\hline
\end{tabular}
%Source: https://freestatistics.org/blog/index.php?pk=28379&T=2

[TABLE]
[ROW][C]Partial Autocorrelation Function[/C][/ROW]
[ROW][C]Time lag k[/C][C]PACF(k)[/C][C]T-STAT[/C][C]P-value[/C][/ROW]
[ROW][C]1[/C][C]-0.014143[/C][C]-0.1068[/C][C]0.457671[/C][/ROW]
[ROW][C]2[/C][C]0.05563[/C][C]0.42[/C][C]0.338034[/C][/ROW]
[ROW][C]3[/C][C]0.156058[/C][C]1.1782[/C][C]0.121803[/C][/ROW]
[ROW][C]4[/C][C]0.027707[/C][C]0.2092[/C][C]0.417525[/C][/ROW]
[ROW][C]5[/C][C]-0.014784[/C][C]-0.1116[/C][C]0.45576[/C][/ROW]
[ROW][C]6[/C][C]0.019418[/C][C]0.1466[/C][C]0.44198[/C][/ROW]
[ROW][C]7[/C][C]-0.01664[/C][C]-0.1256[/C][C]0.450233[/C][/ROW]
[ROW][C]8[/C][C]0.129272[/C][C]0.976[/C][C]0.166599[/C][/ROW]
[ROW][C]9[/C][C]-0.065962[/C][C]-0.498[/C][C]0.310199[/C][/ROW]
[ROW][C]10[/C][C]-0.225121[/C][C]-1.6996[/C][C]0.047326[/C][/ROW]
[ROW][C]11[/C][C]0.08993[/C][C]0.679[/C][C]0.249955[/C][/ROW]
[ROW][C]12[/C][C]-0.210376[/C][C]-1.5883[/C][C]0.058875[/C][/ROW]
[ROW][C]13[/C][C]-0.125885[/C][C]-0.9504[/C][C]0.172958[/C][/ROW]
[ROW][C]14[/C][C]0.103518[/C][C]0.7815[/C][C]0.218857[/C][/ROW]
[ROW][C]15[/C][C]0.121145[/C][C]0.9146[/C][C]0.182121[/C][/ROW]
[ROW][C]16[/C][C]-0.031042[/C][C]-0.2344[/C][C]0.407773[/C][/ROW]
[ROW][C]17[/C][C]-0.077892[/C][C]-0.5881[/C][C]0.279403[/C][/ROW]
[ROW][C]18[/C][C]0.116363[/C][C]0.8785[/C][C]0.191674[/C][/ROW]
[/TABLE]
Source: https://freestatistics.org/blog/index.php?pk=28379&T=2

Globally Unique Identifier (entire table): ba.freestatistics.org/blog/index.php?pk=28379&T=2

As an alternative you can also use a QR Code:  

The GUIDs for individual cells are displayed in the table below:

Partial Autocorrelation Function
Time lag kPACF(k)T-STATP-value
1-0.014143-0.10680.457671
20.055630.420.338034
30.1560581.17820.121803
40.0277070.20920.417525
5-0.014784-0.11160.45576
60.0194180.14660.44198
7-0.01664-0.12560.450233
80.1292720.9760.166599
9-0.065962-0.4980.310199
10-0.225121-1.69960.047326
110.089930.6790.249955
12-0.210376-1.58830.058875
13-0.125885-0.95040.172958
140.1035180.78150.218857
150.1211450.91460.182121
16-0.031042-0.23440.407773
17-0.077892-0.58810.279403
180.1163630.87850.191674


Parameters (Session):
par1 = Default ; par2 = 1 ; par3 = 1 ; par4 = 1 ; par5 = 12 ;
Parameters (R input):
par1 = Default ; par2 = 1 ; par3 = 1 ; par4 = 1 ; par5 = 12 ;
R code (references can be found in the software module):
if (par1 == 'Default') {
par1 = 10*log10(length(x))
} else {
par1 <- as.numeric(par1)
}
par2 <- as.numeric(par2)
par3 <- as.numeric(par3)
par4 <- as.numeric(par4)
par5 <- as.numeric(par5)
if (par2 == 0) {
x <- log(x)
} else {
x <- (x ^ par2 - 1) / par2
}
if (par3 > 0) x <- diff(x,lag=1,difference=par3)
if (par4 > 0) x <- diff(x,lag=par5,difference=par4)
bitmap(file='pic1.png')
racf <- acf(x,par1,main='Autocorrelation',xlab='lags',ylab='ACF')
dev.off()
bitmap(file='pic2.png')
rpacf <- pacf(x,par1,main='Partial Autocorrelation',xlab='lags',ylab='PACF')
dev.off()
(myacf <- c(racf$acf))
(mypacf <- c(rpacf$acf))
lengthx <- length(x)
sqrtn <- sqrt(lengthx)
load(file='createtable')
a<-table.start()
a<-table.row.start(a)
a<-table.element(a,'Autocorrelation Function',4,TRUE)
a<-table.row.end(a)
a<-table.row.start(a)
a<-table.element(a,'Time lag k',header=TRUE)
a<-table.element(a,hyperlink('basics.htm','ACF(k)','click here for more information about the Autocorrelation Function'),header=TRUE)
a<-table.element(a,'T-STAT',header=TRUE)
a<-table.element(a,'P-value',header=TRUE)
a<-table.row.end(a)
for (i in 2:(par1+1)) {
a<-table.row.start(a)
a<-table.element(a,i-1,header=TRUE)
a<-table.element(a,round(myacf[i],6))
mytstat <- myacf[i]*sqrtn
a<-table.element(a,round(mytstat,4))
a<-table.element(a,round(1-pt(abs(mytstat),lengthx),6))
a<-table.row.end(a)
}
a<-table.end(a)
table.save(a,file='mytable.tab')
a<-table.start()
a<-table.row.start(a)
a<-table.element(a,'Partial Autocorrelation Function',4,TRUE)
a<-table.row.end(a)
a<-table.row.start(a)
a<-table.element(a,'Time lag k',header=TRUE)
a<-table.element(a,hyperlink('basics.htm','PACF(k)','click here for more information about the Partial Autocorrelation Function'),header=TRUE)
a<-table.element(a,'T-STAT',header=TRUE)
a<-table.element(a,'P-value',header=TRUE)
a<-table.row.end(a)
for (i in 1:par1) {
a<-table.row.start(a)
a<-table.element(a,i,header=TRUE)
a<-table.element(a,round(mypacf[i],6))
mytstat <- mypacf[i]*sqrtn
a<-table.element(a,round(mytstat,4))
a<-table.element(a,round(1-pt(abs(mytstat),lengthx),6))
a<-table.row.end(a)
}
a<-table.end(a)
table.save(a,file='mytable1.tab')