Free Statistics

of Irreproducible Research!

Author's title

Author*The author of this computation has been verified*
R Software Modulerwasp_autocorrelation.wasp
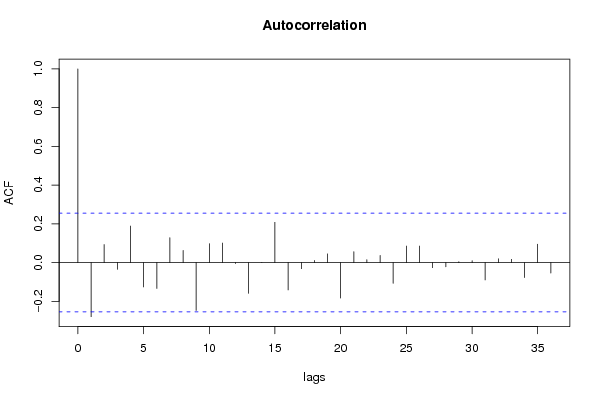
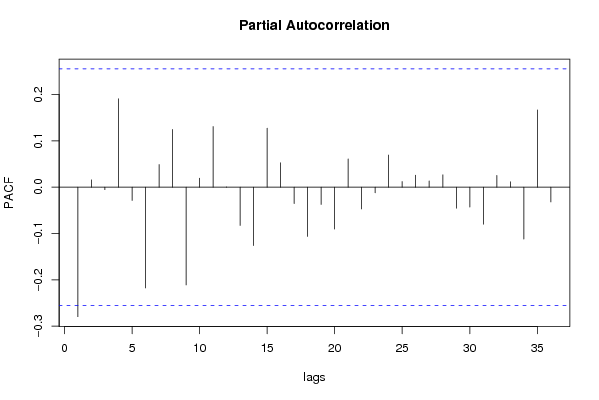
Title produced by software(Partial) Autocorrelation Function
Date of computationTue, 02 Dec 2008 13:17:14 -0700
Cite this page as followsStatistical Computations at FreeStatistics.org, Office for Research Development and Education, URL https://freestatistics.org/blog/index.php?v=date/2008/Dec/02/t1228249187mqdzbcaoalg5nck.htm/, Retrieved Sun, 19 May 2024 11:16:24 +0000
Statistical Computations at FreeStatistics.org, Office for Research Development and Education, URL https://freestatistics.org/blog/index.php?pk=28360, Retrieved Sun, 19 May 2024 11:16:24 +0000
QR Codes:

Original text written by user:
IsPrivate?No (this computation is public)
User-defined keywords
Estimated Impact122
Family? (F = Feedback message, R = changed R code, M = changed R Module, P = changed Parameters, D = changed Data)
F       [(Partial) Autocorrelation Function] [Non stat time ser...] [2008-12-02 20:17:14] [c5d6d05aee6be5527ac4a30a8c3b8fe5] [Current]
Feedback Forum
2008-12-08 16:57:44 [Jonas Janssens] [reply
Goed uitgewerkt. De tijdreeks is stationair gemaakt.
2008-12-08 19:48:53 [5faab2fc6fb120339944528a32d48a04] [reply
Als we de grafiek met parameters d=2 en D=0 bekijken is de seizonaliteit en de lange termijn trend weg. We hebben de reeks stationair gemaakt.
2008-12-09 22:57:55 [Gert-Jan Geudens] [reply
Dit is volledig correct en dus kunnen we hier niets aan toe voegen.

Post a new message
Dataseries X:
105.4
107.1
110.7
117.1
118.7
126.5
127.5
134.6
131.8
135.9
142.7
141.7
153.4
145
137.7
148.3
152.2
169.4
168.6
161.1
174.1
179
190.6
190
181.6
174.8
180.5
196.8
193.8
197
216.3
221.4
217.9
229.7
227.4
204.2
196.6
198.8
207.5
190.7
201.6
210.5
223.5
223.8
231.2
244
234.7
250.2
265.7
287.6
283.3
295.4
312.3
333.8
347.7
383.2
407.1
413.6
362.7
321.9
239.4


Summary of computational transaction
Raw Inputview raw input (R code)
Raw Outputview raw output of R engine
Computing time2 seconds
R Server'Herman Ole Andreas Wold' @ 193.190.124.10:1001

\begin{tabular}{lllllllll}
\hline
Summary of computational transaction \tabularnewline
Raw Input & view raw input (R code)  \tabularnewline
Raw Output & view raw output of R engine  \tabularnewline
Computing time & 2 seconds \tabularnewline
R Server & 'Herman Ole Andreas Wold' @ 193.190.124.10:1001 \tabularnewline
\hline
\end{tabular}
%Source: https://freestatistics.org/blog/index.php?pk=28360&T=0

[TABLE]
[ROW][C]Summary of computational transaction[/C][/ROW]
[ROW][C]Raw Input[/C][C]view raw input (R code) [/C][/ROW]
[ROW][C]Raw Output[/C][C]view raw output of R engine [/C][/ROW]
[ROW][C]Computing time[/C][C]2 seconds[/C][/ROW]
[ROW][C]R Server[/C][C]'Herman Ole Andreas Wold' @ 193.190.124.10:1001[/C][/ROW]
[/TABLE]
Source: https://freestatistics.org/blog/index.php?pk=28360&T=0

Globally Unique Identifier (entire table): ba.freestatistics.org/blog/index.php?pk=28360&T=0

As an alternative you can also use a QR Code:  

The GUIDs for individual cells are displayed in the table below:

Summary of computational transaction
Raw Inputview raw input (R code)
Raw Outputview raw output of R engine
Computing time2 seconds
R Server'Herman Ole Andreas Wold' @ 193.190.124.10:1001


Autocorrelation Function
Time lag kACF(k)T-STATP-value
1-0.279565-2.14740.017941
20.0926350.71150.239775
3-0.035036-0.26910.39439
40.1881611.44530.076834
5-0.126329-0.97040.167916
6-0.133521-1.02560.154634
70.1283460.98580.164118
80.0623790.47910.316804
9-0.247538-1.90140.03107
100.0973370.74770.228818
110.1005740.77250.221444
12-0.005624-0.04320.482843
13-0.159012-1.22140.113398
14-6.6e-05-5e-040.499798
150.2075051.59390.058154
16-0.141417-1.08620.140894
17-0.031621-0.24290.404467
180.0109520.08410.466622
190.0447570.34380.366114
20-0.183504-1.40950.081966
210.0559950.43010.334342
220.0149450.11480.454499
230.0365460.28070.389956
24-0.10764-0.82680.205842
250.0854030.6560.25719
260.0849820.65280.258223
27-0.026389-0.20270.420034
28-0.022418-0.17220.431937
290.0044550.03420.48641
300.009690.07440.470459
31-0.08971-0.68910.246739
320.0194130.14910.440986
330.0167560.12870.449015
34-0.077653-0.59650.276574
350.0949850.72960.234263
36-0.054288-0.4170.339098

\begin{tabular}{lllllllll}
\hline
Autocorrelation Function \tabularnewline
Time lag k & ACF(k) & T-STAT & P-value \tabularnewline
1 & -0.279565 & -2.1474 & 0.017941 \tabularnewline
2 & 0.092635 & 0.7115 & 0.239775 \tabularnewline
3 & -0.035036 & -0.2691 & 0.39439 \tabularnewline
4 & 0.188161 & 1.4453 & 0.076834 \tabularnewline
5 & -0.126329 & -0.9704 & 0.167916 \tabularnewline
6 & -0.133521 & -1.0256 & 0.154634 \tabularnewline
7 & 0.128346 & 0.9858 & 0.164118 \tabularnewline
8 & 0.062379 & 0.4791 & 0.316804 \tabularnewline
9 & -0.247538 & -1.9014 & 0.03107 \tabularnewline
10 & 0.097337 & 0.7477 & 0.228818 \tabularnewline
11 & 0.100574 & 0.7725 & 0.221444 \tabularnewline
12 & -0.005624 & -0.0432 & 0.482843 \tabularnewline
13 & -0.159012 & -1.2214 & 0.113398 \tabularnewline
14 & -6.6e-05 & -5e-04 & 0.499798 \tabularnewline
15 & 0.207505 & 1.5939 & 0.058154 \tabularnewline
16 & -0.141417 & -1.0862 & 0.140894 \tabularnewline
17 & -0.031621 & -0.2429 & 0.404467 \tabularnewline
18 & 0.010952 & 0.0841 & 0.466622 \tabularnewline
19 & 0.044757 & 0.3438 & 0.366114 \tabularnewline
20 & -0.183504 & -1.4095 & 0.081966 \tabularnewline
21 & 0.055995 & 0.4301 & 0.334342 \tabularnewline
22 & 0.014945 & 0.1148 & 0.454499 \tabularnewline
23 & 0.036546 & 0.2807 & 0.389956 \tabularnewline
24 & -0.10764 & -0.8268 & 0.205842 \tabularnewline
25 & 0.085403 & 0.656 & 0.25719 \tabularnewline
26 & 0.084982 & 0.6528 & 0.258223 \tabularnewline
27 & -0.026389 & -0.2027 & 0.420034 \tabularnewline
28 & -0.022418 & -0.1722 & 0.431937 \tabularnewline
29 & 0.004455 & 0.0342 & 0.48641 \tabularnewline
30 & 0.00969 & 0.0744 & 0.470459 \tabularnewline
31 & -0.08971 & -0.6891 & 0.246739 \tabularnewline
32 & 0.019413 & 0.1491 & 0.440986 \tabularnewline
33 & 0.016756 & 0.1287 & 0.449015 \tabularnewline
34 & -0.077653 & -0.5965 & 0.276574 \tabularnewline
35 & 0.094985 & 0.7296 & 0.234263 \tabularnewline
36 & -0.054288 & -0.417 & 0.339098 \tabularnewline
\hline
\end{tabular}
%Source: https://freestatistics.org/blog/index.php?pk=28360&T=1

[TABLE]
[ROW][C]Autocorrelation Function[/C][/ROW]
[ROW][C]Time lag k[/C][C]ACF(k)[/C][C]T-STAT[/C][C]P-value[/C][/ROW]
[ROW][C]1[/C][C]-0.279565[/C][C]-2.1474[/C][C]0.017941[/C][/ROW]
[ROW][C]2[/C][C]0.092635[/C][C]0.7115[/C][C]0.239775[/C][/ROW]
[ROW][C]3[/C][C]-0.035036[/C][C]-0.2691[/C][C]0.39439[/C][/ROW]
[ROW][C]4[/C][C]0.188161[/C][C]1.4453[/C][C]0.076834[/C][/ROW]
[ROW][C]5[/C][C]-0.126329[/C][C]-0.9704[/C][C]0.167916[/C][/ROW]
[ROW][C]6[/C][C]-0.133521[/C][C]-1.0256[/C][C]0.154634[/C][/ROW]
[ROW][C]7[/C][C]0.128346[/C][C]0.9858[/C][C]0.164118[/C][/ROW]
[ROW][C]8[/C][C]0.062379[/C][C]0.4791[/C][C]0.316804[/C][/ROW]
[ROW][C]9[/C][C]-0.247538[/C][C]-1.9014[/C][C]0.03107[/C][/ROW]
[ROW][C]10[/C][C]0.097337[/C][C]0.7477[/C][C]0.228818[/C][/ROW]
[ROW][C]11[/C][C]0.100574[/C][C]0.7725[/C][C]0.221444[/C][/ROW]
[ROW][C]12[/C][C]-0.005624[/C][C]-0.0432[/C][C]0.482843[/C][/ROW]
[ROW][C]13[/C][C]-0.159012[/C][C]-1.2214[/C][C]0.113398[/C][/ROW]
[ROW][C]14[/C][C]-6.6e-05[/C][C]-5e-04[/C][C]0.499798[/C][/ROW]
[ROW][C]15[/C][C]0.207505[/C][C]1.5939[/C][C]0.058154[/C][/ROW]
[ROW][C]16[/C][C]-0.141417[/C][C]-1.0862[/C][C]0.140894[/C][/ROW]
[ROW][C]17[/C][C]-0.031621[/C][C]-0.2429[/C][C]0.404467[/C][/ROW]
[ROW][C]18[/C][C]0.010952[/C][C]0.0841[/C][C]0.466622[/C][/ROW]
[ROW][C]19[/C][C]0.044757[/C][C]0.3438[/C][C]0.366114[/C][/ROW]
[ROW][C]20[/C][C]-0.183504[/C][C]-1.4095[/C][C]0.081966[/C][/ROW]
[ROW][C]21[/C][C]0.055995[/C][C]0.4301[/C][C]0.334342[/C][/ROW]
[ROW][C]22[/C][C]0.014945[/C][C]0.1148[/C][C]0.454499[/C][/ROW]
[ROW][C]23[/C][C]0.036546[/C][C]0.2807[/C][C]0.389956[/C][/ROW]
[ROW][C]24[/C][C]-0.10764[/C][C]-0.8268[/C][C]0.205842[/C][/ROW]
[ROW][C]25[/C][C]0.085403[/C][C]0.656[/C][C]0.25719[/C][/ROW]
[ROW][C]26[/C][C]0.084982[/C][C]0.6528[/C][C]0.258223[/C][/ROW]
[ROW][C]27[/C][C]-0.026389[/C][C]-0.2027[/C][C]0.420034[/C][/ROW]
[ROW][C]28[/C][C]-0.022418[/C][C]-0.1722[/C][C]0.431937[/C][/ROW]
[ROW][C]29[/C][C]0.004455[/C][C]0.0342[/C][C]0.48641[/C][/ROW]
[ROW][C]30[/C][C]0.00969[/C][C]0.0744[/C][C]0.470459[/C][/ROW]
[ROW][C]31[/C][C]-0.08971[/C][C]-0.6891[/C][C]0.246739[/C][/ROW]
[ROW][C]32[/C][C]0.019413[/C][C]0.1491[/C][C]0.440986[/C][/ROW]
[ROW][C]33[/C][C]0.016756[/C][C]0.1287[/C][C]0.449015[/C][/ROW]
[ROW][C]34[/C][C]-0.077653[/C][C]-0.5965[/C][C]0.276574[/C][/ROW]
[ROW][C]35[/C][C]0.094985[/C][C]0.7296[/C][C]0.234263[/C][/ROW]
[ROW][C]36[/C][C]-0.054288[/C][C]-0.417[/C][C]0.339098[/C][/ROW]
[/TABLE]
Source: https://freestatistics.org/blog/index.php?pk=28360&T=1

Globally Unique Identifier (entire table): ba.freestatistics.org/blog/index.php?pk=28360&T=1

As an alternative you can also use a QR Code:  

The GUIDs for individual cells are displayed in the table below:

Autocorrelation Function
Time lag kACF(k)T-STATP-value
1-0.279565-2.14740.017941
20.0926350.71150.239775
3-0.035036-0.26910.39439
40.1881611.44530.076834
5-0.126329-0.97040.167916
6-0.133521-1.02560.154634
70.1283460.98580.164118
80.0623790.47910.316804
9-0.247538-1.90140.03107
100.0973370.74770.228818
110.1005740.77250.221444
12-0.005624-0.04320.482843
13-0.159012-1.22140.113398
14-6.6e-05-5e-040.499798
150.2075051.59390.058154
16-0.141417-1.08620.140894
17-0.031621-0.24290.404467
180.0109520.08410.466622
190.0447570.34380.366114
20-0.183504-1.40950.081966
210.0559950.43010.334342
220.0149450.11480.454499
230.0365460.28070.389956
24-0.10764-0.82680.205842
250.0854030.6560.25719
260.0849820.65280.258223
27-0.026389-0.20270.420034
28-0.022418-0.17220.431937
290.0044550.03420.48641
300.009690.07440.470459
31-0.08971-0.68910.246739
320.0194130.14910.440986
330.0167560.12870.449015
34-0.077653-0.59650.276574
350.0949850.72960.234263
36-0.054288-0.4170.339098


Partial Autocorrelation Function
Time lag kPACF(k)T-STATP-value
1-0.279565-2.14740.017941
20.0157060.12060.452193
3-0.005592-0.0430.482941
40.1905921.4640.074256
5-0.028627-0.21990.41336
6-0.217649-1.67180.04993
70.048750.37450.354703
80.124520.95650.171373
9-0.211056-1.62120.055159
100.0192580.14790.441453
110.1307121.0040.159735
120.0004590.00350.498599
13-0.082525-0.63390.264301
14-0.126021-0.9680.168501
150.1272520.97740.166171
160.0526690.40460.343632
17-0.035546-0.2730.392891
18-0.106398-0.81730.208534
19-0.037364-0.2870.387558
20-0.090591-0.69580.24463
210.0608080.46710.321083
22-0.047007-0.36110.359671
23-0.012157-0.09340.462959
240.0694040.53310.297982
250.0119740.0920.463515
260.0257890.19810.42183
270.0135140.10380.458839
280.0265350.20380.419597
29-0.045481-0.34930.364036
30-0.042957-0.330.371301
31-0.080076-0.61510.270435
320.0253510.19470.423137
330.0115450.08870.464819
34-0.112069-0.86080.196411
350.166591.27960.102847
36-0.03186-0.24470.403762

\begin{tabular}{lllllllll}
\hline
Partial Autocorrelation Function \tabularnewline
Time lag k & PACF(k) & T-STAT & P-value \tabularnewline
1 & -0.279565 & -2.1474 & 0.017941 \tabularnewline
2 & 0.015706 & 0.1206 & 0.452193 \tabularnewline
3 & -0.005592 & -0.043 & 0.482941 \tabularnewline
4 & 0.190592 & 1.464 & 0.074256 \tabularnewline
5 & -0.028627 & -0.2199 & 0.41336 \tabularnewline
6 & -0.217649 & -1.6718 & 0.04993 \tabularnewline
7 & 0.04875 & 0.3745 & 0.354703 \tabularnewline
8 & 0.12452 & 0.9565 & 0.171373 \tabularnewline
9 & -0.211056 & -1.6212 & 0.055159 \tabularnewline
10 & 0.019258 & 0.1479 & 0.441453 \tabularnewline
11 & 0.130712 & 1.004 & 0.159735 \tabularnewline
12 & 0.000459 & 0.0035 & 0.498599 \tabularnewline
13 & -0.082525 & -0.6339 & 0.264301 \tabularnewline
14 & -0.126021 & -0.968 & 0.168501 \tabularnewline
15 & 0.127252 & 0.9774 & 0.166171 \tabularnewline
16 & 0.052669 & 0.4046 & 0.343632 \tabularnewline
17 & -0.035546 & -0.273 & 0.392891 \tabularnewline
18 & -0.106398 & -0.8173 & 0.208534 \tabularnewline
19 & -0.037364 & -0.287 & 0.387558 \tabularnewline
20 & -0.090591 & -0.6958 & 0.24463 \tabularnewline
21 & 0.060808 & 0.4671 & 0.321083 \tabularnewline
22 & -0.047007 & -0.3611 & 0.359671 \tabularnewline
23 & -0.012157 & -0.0934 & 0.462959 \tabularnewline
24 & 0.069404 & 0.5331 & 0.297982 \tabularnewline
25 & 0.011974 & 0.092 & 0.463515 \tabularnewline
26 & 0.025789 & 0.1981 & 0.42183 \tabularnewline
27 & 0.013514 & 0.1038 & 0.458839 \tabularnewline
28 & 0.026535 & 0.2038 & 0.419597 \tabularnewline
29 & -0.045481 & -0.3493 & 0.364036 \tabularnewline
30 & -0.042957 & -0.33 & 0.371301 \tabularnewline
31 & -0.080076 & -0.6151 & 0.270435 \tabularnewline
32 & 0.025351 & 0.1947 & 0.423137 \tabularnewline
33 & 0.011545 & 0.0887 & 0.464819 \tabularnewline
34 & -0.112069 & -0.8608 & 0.196411 \tabularnewline
35 & 0.16659 & 1.2796 & 0.102847 \tabularnewline
36 & -0.03186 & -0.2447 & 0.403762 \tabularnewline
\hline
\end{tabular}
%Source: https://freestatistics.org/blog/index.php?pk=28360&T=2

[TABLE]
[ROW][C]Partial Autocorrelation Function[/C][/ROW]
[ROW][C]Time lag k[/C][C]PACF(k)[/C][C]T-STAT[/C][C]P-value[/C][/ROW]
[ROW][C]1[/C][C]-0.279565[/C][C]-2.1474[/C][C]0.017941[/C][/ROW]
[ROW][C]2[/C][C]0.015706[/C][C]0.1206[/C][C]0.452193[/C][/ROW]
[ROW][C]3[/C][C]-0.005592[/C][C]-0.043[/C][C]0.482941[/C][/ROW]
[ROW][C]4[/C][C]0.190592[/C][C]1.464[/C][C]0.074256[/C][/ROW]
[ROW][C]5[/C][C]-0.028627[/C][C]-0.2199[/C][C]0.41336[/C][/ROW]
[ROW][C]6[/C][C]-0.217649[/C][C]-1.6718[/C][C]0.04993[/C][/ROW]
[ROW][C]7[/C][C]0.04875[/C][C]0.3745[/C][C]0.354703[/C][/ROW]
[ROW][C]8[/C][C]0.12452[/C][C]0.9565[/C][C]0.171373[/C][/ROW]
[ROW][C]9[/C][C]-0.211056[/C][C]-1.6212[/C][C]0.055159[/C][/ROW]
[ROW][C]10[/C][C]0.019258[/C][C]0.1479[/C][C]0.441453[/C][/ROW]
[ROW][C]11[/C][C]0.130712[/C][C]1.004[/C][C]0.159735[/C][/ROW]
[ROW][C]12[/C][C]0.000459[/C][C]0.0035[/C][C]0.498599[/C][/ROW]
[ROW][C]13[/C][C]-0.082525[/C][C]-0.6339[/C][C]0.264301[/C][/ROW]
[ROW][C]14[/C][C]-0.126021[/C][C]-0.968[/C][C]0.168501[/C][/ROW]
[ROW][C]15[/C][C]0.127252[/C][C]0.9774[/C][C]0.166171[/C][/ROW]
[ROW][C]16[/C][C]0.052669[/C][C]0.4046[/C][C]0.343632[/C][/ROW]
[ROW][C]17[/C][C]-0.035546[/C][C]-0.273[/C][C]0.392891[/C][/ROW]
[ROW][C]18[/C][C]-0.106398[/C][C]-0.8173[/C][C]0.208534[/C][/ROW]
[ROW][C]19[/C][C]-0.037364[/C][C]-0.287[/C][C]0.387558[/C][/ROW]
[ROW][C]20[/C][C]-0.090591[/C][C]-0.6958[/C][C]0.24463[/C][/ROW]
[ROW][C]21[/C][C]0.060808[/C][C]0.4671[/C][C]0.321083[/C][/ROW]
[ROW][C]22[/C][C]-0.047007[/C][C]-0.3611[/C][C]0.359671[/C][/ROW]
[ROW][C]23[/C][C]-0.012157[/C][C]-0.0934[/C][C]0.462959[/C][/ROW]
[ROW][C]24[/C][C]0.069404[/C][C]0.5331[/C][C]0.297982[/C][/ROW]
[ROW][C]25[/C][C]0.011974[/C][C]0.092[/C][C]0.463515[/C][/ROW]
[ROW][C]26[/C][C]0.025789[/C][C]0.1981[/C][C]0.42183[/C][/ROW]
[ROW][C]27[/C][C]0.013514[/C][C]0.1038[/C][C]0.458839[/C][/ROW]
[ROW][C]28[/C][C]0.026535[/C][C]0.2038[/C][C]0.419597[/C][/ROW]
[ROW][C]29[/C][C]-0.045481[/C][C]-0.3493[/C][C]0.364036[/C][/ROW]
[ROW][C]30[/C][C]-0.042957[/C][C]-0.33[/C][C]0.371301[/C][/ROW]
[ROW][C]31[/C][C]-0.080076[/C][C]-0.6151[/C][C]0.270435[/C][/ROW]
[ROW][C]32[/C][C]0.025351[/C][C]0.1947[/C][C]0.423137[/C][/ROW]
[ROW][C]33[/C][C]0.011545[/C][C]0.0887[/C][C]0.464819[/C][/ROW]
[ROW][C]34[/C][C]-0.112069[/C][C]-0.8608[/C][C]0.196411[/C][/ROW]
[ROW][C]35[/C][C]0.16659[/C][C]1.2796[/C][C]0.102847[/C][/ROW]
[ROW][C]36[/C][C]-0.03186[/C][C]-0.2447[/C][C]0.403762[/C][/ROW]
[/TABLE]
Source: https://freestatistics.org/blog/index.php?pk=28360&T=2

Globally Unique Identifier (entire table): ba.freestatistics.org/blog/index.php?pk=28360&T=2

As an alternative you can also use a QR Code:  

The GUIDs for individual cells are displayed in the table below:

Partial Autocorrelation Function
Time lag kPACF(k)T-STATP-value
1-0.279565-2.14740.017941
20.0157060.12060.452193
3-0.005592-0.0430.482941
40.1905921.4640.074256
5-0.028627-0.21990.41336
6-0.217649-1.67180.04993
70.048750.37450.354703
80.124520.95650.171373
9-0.211056-1.62120.055159
100.0192580.14790.441453
110.1307121.0040.159735
120.0004590.00350.498599
13-0.082525-0.63390.264301
14-0.126021-0.9680.168501
150.1272520.97740.166171
160.0526690.40460.343632
17-0.035546-0.2730.392891
18-0.106398-0.81730.208534
19-0.037364-0.2870.387558
20-0.090591-0.69580.24463
210.0608080.46710.321083
22-0.047007-0.36110.359671
23-0.012157-0.09340.462959
240.0694040.53310.297982
250.0119740.0920.463515
260.0257890.19810.42183
270.0135140.10380.458839
280.0265350.20380.419597
29-0.045481-0.34930.364036
30-0.042957-0.330.371301
31-0.080076-0.61510.270435
320.0253510.19470.423137
330.0115450.08870.464819
34-0.112069-0.86080.196411
350.166591.27960.102847
36-0.03186-0.24470.403762


Parameters (Session):
par1 = 36 ; par2 = 1 ; par3 = 2 ; par4 = 0 ; par5 = 12 ;
Parameters (R input):
par1 = 36 ; par2 = 1 ; par3 = 2 ; par4 = 0 ; par5 = 12 ;
R code (references can be found in the software module):
if (par1 == 'Default') {
par1 = 10*log10(length(x))
} else {
par1 <- as.numeric(par1)
}
par2 <- as.numeric(par2)
par3 <- as.numeric(par3)
par4 <- as.numeric(par4)
par5 <- as.numeric(par5)
if (par2 == 0) {
x <- log(x)
} else {
x <- (x ^ par2 - 1) / par2
}
if (par3 > 0) x <- diff(x,lag=1,difference=par3)
if (par4 > 0) x <- diff(x,lag=par5,difference=par4)
bitmap(file='pic1.png')
racf <- acf(x,par1,main='Autocorrelation',xlab='lags',ylab='ACF')
dev.off()
bitmap(file='pic2.png')
rpacf <- pacf(x,par1,main='Partial Autocorrelation',xlab='lags',ylab='PACF')
dev.off()
(myacf <- c(racf$acf))
(mypacf <- c(rpacf$acf))
lengthx <- length(x)
sqrtn <- sqrt(lengthx)
load(file='createtable')
a<-table.start()
a<-table.row.start(a)
a<-table.element(a,'Autocorrelation Function',4,TRUE)
a<-table.row.end(a)
a<-table.row.start(a)
a<-table.element(a,'Time lag k',header=TRUE)
a<-table.element(a,hyperlink('basics.htm','ACF(k)','click here for more information about the Autocorrelation Function'),header=TRUE)
a<-table.element(a,'T-STAT',header=TRUE)
a<-table.element(a,'P-value',header=TRUE)
a<-table.row.end(a)
for (i in 2:(par1+1)) {
a<-table.row.start(a)
a<-table.element(a,i-1,header=TRUE)
a<-table.element(a,round(myacf[i],6))
mytstat <- myacf[i]*sqrtn
a<-table.element(a,round(mytstat,4))
a<-table.element(a,round(1-pt(abs(mytstat),lengthx),6))
a<-table.row.end(a)
}
a<-table.end(a)
table.save(a,file='mytable.tab')
a<-table.start()
a<-table.row.start(a)
a<-table.element(a,'Partial Autocorrelation Function',4,TRUE)
a<-table.row.end(a)
a<-table.row.start(a)
a<-table.element(a,'Time lag k',header=TRUE)
a<-table.element(a,hyperlink('basics.htm','PACF(k)','click here for more information about the Partial Autocorrelation Function'),header=TRUE)
a<-table.element(a,'T-STAT',header=TRUE)
a<-table.element(a,'P-value',header=TRUE)
a<-table.row.end(a)
for (i in 1:par1) {
a<-table.row.start(a)
a<-table.element(a,i,header=TRUE)
a<-table.element(a,round(mypacf[i],6))
mytstat <- mypacf[i]*sqrtn
a<-table.element(a,round(mytstat,4))
a<-table.element(a,round(1-pt(abs(mytstat),lengthx),6))
a<-table.row.end(a)
}
a<-table.end(a)
table.save(a,file='mytable1.tab')