Free Statistics

of Irreproducible Research!

Author's title

Author*The author of this computation has been verified*
R Software Modulerwasp_cross.wasp
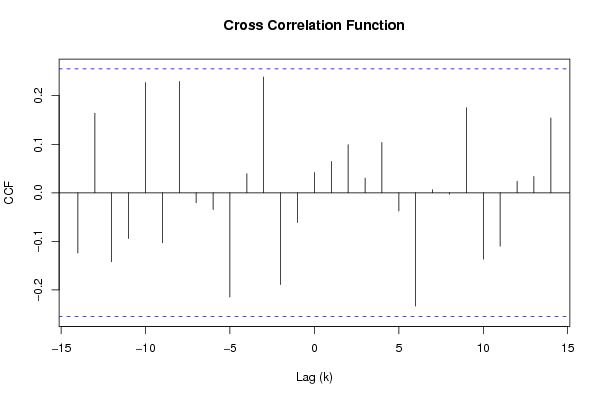
Title produced by softwareCross Correlation Function
Date of computationTue, 02 Dec 2008 13:12:04 -0700
Cite this page as followsStatistical Computations at FreeStatistics.org, Office for Research Development and Education, URL https://freestatistics.org/blog/index.php?v=date/2008/Dec/02/t1228249060eet250x9wpbqwda.htm/, Retrieved Sun, 19 May 2024 08:56:58 +0000
Statistical Computations at FreeStatistics.org, Office for Research Development and Education, URL https://freestatistics.org/blog/index.php?pk=28354, Retrieved Sun, 19 May 2024 08:56:58 +0000
QR Codes:

Original text written by user:
IsPrivate?No (this computation is public)
User-defined keywords
Estimated Impact146
Family? (F = Feedback message, R = changed R code, M = changed R Module, P = changed Parameters, D = changed Data)
F     [Cross Correlation Function] [nsts Q7] [2008-12-02 19:32:48] [3a9fc6d5b5e0e816787b7dbace57e7cd]
F    D    [Cross Correlation Function] [nsts Q8] [2008-12-02 20:12:04] [821c4b3d195be8e737cf8c9dc649d3cf] [Current]
Feedback Forum
2008-12-08 19:46:25 [Gert-Jan Geudens] [reply
Hier ben je de mist ingegaan. Je bent vergeten de correcte parameters in te stellen voor lambda van beide tijdreeksen. Je hebt deze lambda's reeds gevonden in Q8.
Tevens heb je niet alle correcte parameters ingegeven zoals je deze gevonden had in Q8. Lambda xt : lambda = 0.7 d=1 D=0 en yt : lambda = 1.5, d=0, D=0

Als je dit zou doen, merk je dat er inderdaad geen correlatie meer is. De gevonden correlatie in Q7 is dus louter een nonsenscorrelatie.
2008-12-08 19:48:24 [Gert-Jan Geudens] [reply
Kleine correctie op de vorige post : De parameters zijn bij beide reeksen : d=1 en D=0.

Post a new message
Dataseries X:
109.57
107.08
110.33
110.36
106.5
104.3
107.21
109.34
108.2
109.86
108.68
113.38
117.12
116.23
114.75
115.81
115.86
117.8
117.11
116.31
118.38
121.57
121.65
124.2
126.12
128.6
128.16
130.12
135.83
138.05
134.99
132.38
128.94
128.12
127.84
132.43
134.13
134.78
133.13
129.08
134.48
132.86
134.08
134.54
134.51
135.97
136.09
139.14
135.63
136.55
138.83
138.84
135.37
132.22
134.75
135.98
136.06
138.05
139.59
140.58
Dataseries Y:
377.2
332.2
364.8
352.4
341.6
298.2
355.3
330.9
314.5
418.9
433.2
367
422.9
352.1
419.8
432.7
414.2
387.7
297.2
357.4
384.2
425.2
385.3
355.4
409.8
421.2
421.8
464.2
494
404.2
411.4
403.4
403.3
520.9
439.8
434.8
476.5
454.3
522
498.4
439.9
450.7
447.1
451.3
466.8
498
533.6
451.9
477.1
410.4
469.5
485.4
406.7
439.7
412.2
440.2
411.1
477.7
463.2
320.5


Summary of computational transaction
Raw Inputview raw input (R code)
Raw Outputview raw output of R engine
Computing time2 seconds
R Server'Sir Ronald Aylmer Fisher' @ 193.190.124.24

\begin{tabular}{lllllllll}
\hline
Summary of computational transaction \tabularnewline
Raw Input & view raw input (R code)  \tabularnewline
Raw Output & view raw output of R engine  \tabularnewline
Computing time & 2 seconds \tabularnewline
R Server & 'Sir Ronald Aylmer Fisher' @ 193.190.124.24 \tabularnewline
\hline
\end{tabular}
%Source: https://freestatistics.org/blog/index.php?pk=28354&T=0

[TABLE]
[ROW][C]Summary of computational transaction[/C][/ROW]
[ROW][C]Raw Input[/C][C]view raw input (R code) [/C][/ROW]
[ROW][C]Raw Output[/C][C]view raw output of R engine [/C][/ROW]
[ROW][C]Computing time[/C][C]2 seconds[/C][/ROW]
[ROW][C]R Server[/C][C]'Sir Ronald Aylmer Fisher' @ 193.190.124.24[/C][/ROW]
[/TABLE]
Source: https://freestatistics.org/blog/index.php?pk=28354&T=0

Globally Unique Identifier (entire table): ba.freestatistics.org/blog/index.php?pk=28354&T=0

As an alternative you can also use a QR Code:  

The GUIDs for individual cells are displayed in the table below:

Summary of computational transaction
Raw Inputview raw input (R code)
Raw Outputview raw output of R engine
Computing time2 seconds
R Server'Sir Ronald Aylmer Fisher' @ 193.190.124.24


Cross Correlation Function
ParameterValue
Box-Cox transformation parameter (lambda) of X series1
Degree of non-seasonal differencing (d) of X series1
Degree of seasonal differencing (D) of X series0
Seasonal Period (s)12
Box-Cox transformation parameter (lambda) of Y series1
Degree of non-seasonal differencing (d) of Y series1
Degree of seasonal differencing (D) of Y series0
krho(Y[t],X[t+k])
-14-0.124149667566373
-130.163888994208301
-12-0.1421488948949
-11-0.0942805402194792
-100.22709490384045
-9-0.102985838044367
-80.229365685430667
-7-0.0205180623281939
-6-0.0346072245531741
-5-0.214790491887750
-40.0391250953058877
-30.238511237100304
-2-0.189009584816962
-1-0.0610919751270638
00.0417195063905237
10.0645846939690777
20.0992221677543288
30.0302645709222219
40.103608930730243
5-0.0376503785509522
6-0.233215669324554
70.00646319407912062
8-0.00278015804844742
90.175343397239323
10-0.136686001191090
11-0.109935560126747
120.0240371919197645
130.0337133011023627
140.154168402873538

\begin{tabular}{lllllllll}
\hline
Cross Correlation Function \tabularnewline
Parameter & Value \tabularnewline
Box-Cox transformation parameter (lambda) of X series & 1 \tabularnewline
Degree of non-seasonal differencing (d) of X series & 1 \tabularnewline
Degree of seasonal differencing (D) of X series & 0 \tabularnewline
Seasonal Period (s) & 12 \tabularnewline
Box-Cox transformation parameter (lambda) of Y series & 1 \tabularnewline
Degree of non-seasonal differencing (d) of Y series & 1 \tabularnewline
Degree of seasonal differencing (D) of Y series & 0 \tabularnewline
k & rho(Y[t],X[t+k]) \tabularnewline
-14 & -0.124149667566373 \tabularnewline
-13 & 0.163888994208301 \tabularnewline
-12 & -0.1421488948949 \tabularnewline
-11 & -0.0942805402194792 \tabularnewline
-10 & 0.22709490384045 \tabularnewline
-9 & -0.102985838044367 \tabularnewline
-8 & 0.229365685430667 \tabularnewline
-7 & -0.0205180623281939 \tabularnewline
-6 & -0.0346072245531741 \tabularnewline
-5 & -0.214790491887750 \tabularnewline
-4 & 0.0391250953058877 \tabularnewline
-3 & 0.238511237100304 \tabularnewline
-2 & -0.189009584816962 \tabularnewline
-1 & -0.0610919751270638 \tabularnewline
0 & 0.0417195063905237 \tabularnewline
1 & 0.0645846939690777 \tabularnewline
2 & 0.0992221677543288 \tabularnewline
3 & 0.0302645709222219 \tabularnewline
4 & 0.103608930730243 \tabularnewline
5 & -0.0376503785509522 \tabularnewline
6 & -0.233215669324554 \tabularnewline
7 & 0.00646319407912062 \tabularnewline
8 & -0.00278015804844742 \tabularnewline
9 & 0.175343397239323 \tabularnewline
10 & -0.136686001191090 \tabularnewline
11 & -0.109935560126747 \tabularnewline
12 & 0.0240371919197645 \tabularnewline
13 & 0.0337133011023627 \tabularnewline
14 & 0.154168402873538 \tabularnewline
\hline
\end{tabular}
%Source: https://freestatistics.org/blog/index.php?pk=28354&T=1

[TABLE]
[ROW][C]Cross Correlation Function[/C][/ROW]
[ROW][C]Parameter[/C][C]Value[/C][/ROW]
[ROW][C]Box-Cox transformation parameter (lambda) of X series[/C][C]1[/C][/ROW]
[ROW][C]Degree of non-seasonal differencing (d) of X series[/C][C]1[/C][/ROW]
[ROW][C]Degree of seasonal differencing (D) of X series[/C][C]0[/C][/ROW]
[ROW][C]Seasonal Period (s)[/C][C]12[/C][/ROW]
[ROW][C]Box-Cox transformation parameter (lambda) of Y series[/C][C]1[/C][/ROW]
[ROW][C]Degree of non-seasonal differencing (d) of Y series[/C][C]1[/C][/ROW]
[ROW][C]Degree of seasonal differencing (D) of Y series[/C][C]0[/C][/ROW]
[ROW][C]k[/C][C]rho(Y[t],X[t+k])[/C][/ROW]
[ROW][C]-14[/C][C]-0.124149667566373[/C][/ROW]
[ROW][C]-13[/C][C]0.163888994208301[/C][/ROW]
[ROW][C]-12[/C][C]-0.1421488948949[/C][/ROW]
[ROW][C]-11[/C][C]-0.0942805402194792[/C][/ROW]
[ROW][C]-10[/C][C]0.22709490384045[/C][/ROW]
[ROW][C]-9[/C][C]-0.102985838044367[/C][/ROW]
[ROW][C]-8[/C][C]0.229365685430667[/C][/ROW]
[ROW][C]-7[/C][C]-0.0205180623281939[/C][/ROW]
[ROW][C]-6[/C][C]-0.0346072245531741[/C][/ROW]
[ROW][C]-5[/C][C]-0.214790491887750[/C][/ROW]
[ROW][C]-4[/C][C]0.0391250953058877[/C][/ROW]
[ROW][C]-3[/C][C]0.238511237100304[/C][/ROW]
[ROW][C]-2[/C][C]-0.189009584816962[/C][/ROW]
[ROW][C]-1[/C][C]-0.0610919751270638[/C][/ROW]
[ROW][C]0[/C][C]0.0417195063905237[/C][/ROW]
[ROW][C]1[/C][C]0.0645846939690777[/C][/ROW]
[ROW][C]2[/C][C]0.0992221677543288[/C][/ROW]
[ROW][C]3[/C][C]0.0302645709222219[/C][/ROW]
[ROW][C]4[/C][C]0.103608930730243[/C][/ROW]
[ROW][C]5[/C][C]-0.0376503785509522[/C][/ROW]
[ROW][C]6[/C][C]-0.233215669324554[/C][/ROW]
[ROW][C]7[/C][C]0.00646319407912062[/C][/ROW]
[ROW][C]8[/C][C]-0.00278015804844742[/C][/ROW]
[ROW][C]9[/C][C]0.175343397239323[/C][/ROW]
[ROW][C]10[/C][C]-0.136686001191090[/C][/ROW]
[ROW][C]11[/C][C]-0.109935560126747[/C][/ROW]
[ROW][C]12[/C][C]0.0240371919197645[/C][/ROW]
[ROW][C]13[/C][C]0.0337133011023627[/C][/ROW]
[ROW][C]14[/C][C]0.154168402873538[/C][/ROW]
[/TABLE]
Source: https://freestatistics.org/blog/index.php?pk=28354&T=1

Globally Unique Identifier (entire table): ba.freestatistics.org/blog/index.php?pk=28354&T=1

As an alternative you can also use a QR Code:  

The GUIDs for individual cells are displayed in the table below:

Cross Correlation Function
ParameterValue
Box-Cox transformation parameter (lambda) of X series1
Degree of non-seasonal differencing (d) of X series1
Degree of seasonal differencing (D) of X series0
Seasonal Period (s)12
Box-Cox transformation parameter (lambda) of Y series1
Degree of non-seasonal differencing (d) of Y series1
Degree of seasonal differencing (D) of Y series0
krho(Y[t],X[t+k])
-14-0.124149667566373
-130.163888994208301
-12-0.1421488948949
-11-0.0942805402194792
-100.22709490384045
-9-0.102985838044367
-80.229365685430667
-7-0.0205180623281939
-6-0.0346072245531741
-5-0.214790491887750
-40.0391250953058877
-30.238511237100304
-2-0.189009584816962
-1-0.0610919751270638
00.0417195063905237
10.0645846939690777
20.0992221677543288
30.0302645709222219
40.103608930730243
5-0.0376503785509522
6-0.233215669324554
70.00646319407912062
8-0.00278015804844742
90.175343397239323
10-0.136686001191090
11-0.109935560126747
120.0240371919197645
130.0337133011023627
140.154168402873538


Parameters (Session):
par1 = 1 ; par2 = 0 ; par3 = 0 ; par4 = 12 ; par5 = 1 ; par6 = 0 ; par7 = 0 ;
Parameters (R input):
par1 = 1 ; par2 = 1 ; par3 = 0 ; par4 = 12 ; par5 = 1 ; par6 = 1 ; par7 = 0 ;
R code (references can be found in the software module):
par1 <- as.numeric(par1)
par2 <- as.numeric(par2)
par3 <- as.numeric(par3)
par4 <- as.numeric(par4)
par5 <- as.numeric(par5)
par6 <- as.numeric(par6)
par7 <- as.numeric(par7)
if (par1 == 0) {
x <- log(x)
} else {
x <- (x ^ par1 - 1) / par1
}
if (par5 == 0) {
y <- log(y)
} else {
y <- (y ^ par5 - 1) / par5
}
if (par2 > 0) x <- diff(x,lag=1,difference=par2)
if (par6 > 0) y <- diff(y,lag=1,difference=par6)
if (par3 > 0) x <- diff(x,lag=par4,difference=par3)
if (par7 > 0) y <- diff(y,lag=par4,difference=par7)
x
y
bitmap(file='test1.png')
(r <- ccf(x,y,main='Cross Correlation Function',ylab='CCF',xlab='Lag (k)'))
dev.off()
load(file='createtable')
a<-table.start()
a<-table.row.start(a)
a<-table.element(a,'Cross Correlation Function',2,TRUE)
a<-table.row.end(a)
a<-table.row.start(a)
a<-table.element(a,'Parameter',header=TRUE)
a<-table.element(a,'Value',header=TRUE)
a<-table.row.end(a)
a<-table.row.start(a)
a<-table.element(a,'Box-Cox transformation parameter (lambda) of X series',header=TRUE)
a<-table.element(a,par1)
a<-table.row.end(a)
a<-table.row.start(a)
a<-table.element(a,'Degree of non-seasonal differencing (d) of X series',header=TRUE)
a<-table.element(a,par2)
a<-table.row.end(a)
a<-table.row.start(a)
a<-table.element(a,'Degree of seasonal differencing (D) of X series',header=TRUE)
a<-table.element(a,par3)
a<-table.row.end(a)
a<-table.row.start(a)
a<-table.element(a,'Seasonal Period (s)',header=TRUE)
a<-table.element(a,par4)
a<-table.row.end(a)
a<-table.row.start(a)
a<-table.element(a,'Box-Cox transformation parameter (lambda) of Y series',header=TRUE)
a<-table.element(a,par5)
a<-table.row.end(a)
a<-table.row.start(a)
a<-table.element(a,'Degree of non-seasonal differencing (d) of Y series',header=TRUE)
a<-table.element(a,par6)
a<-table.row.end(a)
a<-table.row.start(a)
a<-table.element(a,'Degree of seasonal differencing (D) of Y series',header=TRUE)
a<-table.element(a,par7)
a<-table.row.end(a)
a<-table.row.start(a)
a<-table.element(a,'k',header=TRUE)
a<-table.element(a,'rho(Y[t],X[t+k])',header=TRUE)
a<-table.row.end(a)
mylength <- length(r$acf)
myhalf <- floor((mylength-1)/2)
for (i in 1:mylength) {
a<-table.row.start(a)
a<-table.element(a,i-myhalf-1,header=TRUE)
a<-table.element(a,r$acf[i])
a<-table.row.end(a)
}
a<-table.end(a)
table.save(a,file='mytable.tab')