Free Statistics

of Irreproducible Research!

Author's title

Author*Unverified author*
R Software Modulerwasp_autocorrelation.wasp
Title produced by software(Partial) Autocorrelation Function
Date of computationTue, 02 Dec 2008 13:15:11 -0700
Cite this page as followsStatistical Computations at FreeStatistics.org, Office for Research Development and Education, URL https://freestatistics.org/blog/index.php?v=date/2008/Dec/02/t1228248939899y1kixzhxxctq.htm/, Retrieved Sun, 19 May 2024 11:29:29 +0000
Statistical Computations at FreeStatistics.org, Office for Research Development and Education, URL https://freestatistics.org/blog/index.php?pk=28347, Retrieved Sun, 19 May 2024 11:29:29 +0000
QR Codes:

Original text written by user:
IsPrivate?No (this computation is public)
User-defined keywords
Estimated Impact150
Family? (F = Feedback message, R = changed R code, M = changed R Module, P = changed Parameters, D = changed Data)
F     [(Partial) Autocorrelation Function] [autocorrelation] [2008-12-02 20:08:00] [c94d7012e41b73cfa20d93e879679ede]
-   PD  [(Partial) Autocorrelation Function] [autocorrelation] [2008-12-02 20:10:31] [c94d7012e41b73cfa20d93e879679ede]
-   PD    [(Partial) Autocorrelation Function] [autocorrelation] [2008-12-02 20:13:09] [c94d7012e41b73cfa20d93e879679ede]
-   PD        [(Partial) Autocorrelation Function] [autocorrelation] [2008-12-02 20:15:11] [72e979bcc364082694890d2eccc1a66f] [Current]
Feedback Forum

Post a new message
Dataseries X:
11.836
11.85
11.897
12.082
11.936
11.928
12.646
12.747
12.447
12.445
12.257
12.878
13.69
13.665
13.78
13.608
13.375
13.376
13.918
14.304
13.877
14.543
14.291
14.788
15.241
15.265
15.322
15.175
14.817
14.579
15.247
15.385
14.891
14.766
14.42
14.85
15.117
15.352
15.099
15.291
15.208
14.995
15.454
15.251
14.975
14.005
13.55
13.422
13.848
13.376
13.038
12.974
12.554
11.971
12.916
12.757
11.924
11.693
11.382
11.821


Summary of computational transaction
Raw Inputview raw input (R code)
Raw Outputview raw output of R engine
Computing time2 seconds
R Server'Sir Ronald Aylmer Fisher' @ 193.190.124.24

\begin{tabular}{lllllllll}
\hline
Summary of computational transaction \tabularnewline
Raw Input & view raw input (R code)  \tabularnewline
Raw Output & view raw output of R engine  \tabularnewline
Computing time & 2 seconds \tabularnewline
R Server & 'Sir Ronald Aylmer Fisher' @ 193.190.124.24 \tabularnewline
\hline
\end{tabular}
%Source: https://freestatistics.org/blog/index.php?pk=28347&T=0

[TABLE]
[ROW][C]Summary of computational transaction[/C][/ROW]
[ROW][C]Raw Input[/C][C]view raw input (R code) [/C][/ROW]
[ROW][C]Raw Output[/C][C]view raw output of R engine [/C][/ROW]
[ROW][C]Computing time[/C][C]2 seconds[/C][/ROW]
[ROW][C]R Server[/C][C]'Sir Ronald Aylmer Fisher' @ 193.190.124.24[/C][/ROW]
[/TABLE]
Source: https://freestatistics.org/blog/index.php?pk=28347&T=0

Globally Unique Identifier (entire table): ba.freestatistics.org/blog/index.php?pk=28347&T=0

As an alternative you can also use a QR Code:  

The GUIDs for individual cells are displayed in the table below:

Summary of computational transaction
Raw Inputview raw input (R code)
Raw Outputview raw output of R engine
Computing time2 seconds
R Server'Sir Ronald Aylmer Fisher' @ 193.190.124.24


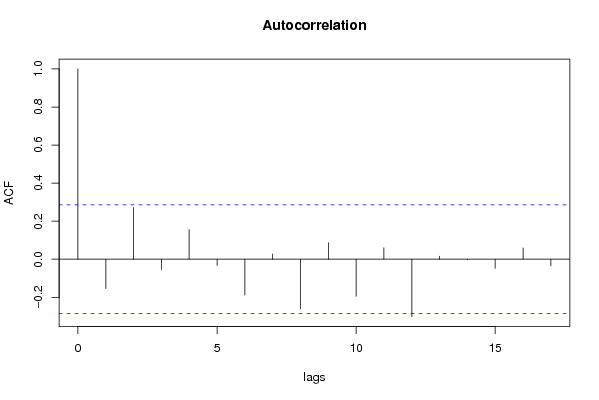
Autocorrelation Function
Time lag kACF(k)T-STATP-value
1-0.153726-1.05390.148659
20.2715481.86160.034457
3-0.054016-0.37030.356406
40.1554721.06590.145965
5-0.032552-0.22320.412188
6-0.187606-1.28620.102343
70.0279030.19130.42456
8-0.260763-1.78770.040137
90.0864560.59270.278106
10-0.194842-1.33580.094028
110.0598430.41030.341738
12-0.301725-2.06850.022058
130.0162840.11160.455793
14-0.002338-0.0160.493639
15-0.047055-0.32260.374217
160.05890.40380.344097
17-0.033816-0.23180.408839

\begin{tabular}{lllllllll}
\hline
Autocorrelation Function \tabularnewline
Time lag k & ACF(k) & T-STAT & P-value \tabularnewline
1 & -0.153726 & -1.0539 & 0.148659 \tabularnewline
2 & 0.271548 & 1.8616 & 0.034457 \tabularnewline
3 & -0.054016 & -0.3703 & 0.356406 \tabularnewline
4 & 0.155472 & 1.0659 & 0.145965 \tabularnewline
5 & -0.032552 & -0.2232 & 0.412188 \tabularnewline
6 & -0.187606 & -1.2862 & 0.102343 \tabularnewline
7 & 0.027903 & 0.1913 & 0.42456 \tabularnewline
8 & -0.260763 & -1.7877 & 0.040137 \tabularnewline
9 & 0.086456 & 0.5927 & 0.278106 \tabularnewline
10 & -0.194842 & -1.3358 & 0.094028 \tabularnewline
11 & 0.059843 & 0.4103 & 0.341738 \tabularnewline
12 & -0.301725 & -2.0685 & 0.022058 \tabularnewline
13 & 0.016284 & 0.1116 & 0.455793 \tabularnewline
14 & -0.002338 & -0.016 & 0.493639 \tabularnewline
15 & -0.047055 & -0.3226 & 0.374217 \tabularnewline
16 & 0.0589 & 0.4038 & 0.344097 \tabularnewline
17 & -0.033816 & -0.2318 & 0.408839 \tabularnewline
\hline
\end{tabular}
%Source: https://freestatistics.org/blog/index.php?pk=28347&T=1

[TABLE]
[ROW][C]Autocorrelation Function[/C][/ROW]
[ROW][C]Time lag k[/C][C]ACF(k)[/C][C]T-STAT[/C][C]P-value[/C][/ROW]
[ROW][C]1[/C][C]-0.153726[/C][C]-1.0539[/C][C]0.148659[/C][/ROW]
[ROW][C]2[/C][C]0.271548[/C][C]1.8616[/C][C]0.034457[/C][/ROW]
[ROW][C]3[/C][C]-0.054016[/C][C]-0.3703[/C][C]0.356406[/C][/ROW]
[ROW][C]4[/C][C]0.155472[/C][C]1.0659[/C][C]0.145965[/C][/ROW]
[ROW][C]5[/C][C]-0.032552[/C][C]-0.2232[/C][C]0.412188[/C][/ROW]
[ROW][C]6[/C][C]-0.187606[/C][C]-1.2862[/C][C]0.102343[/C][/ROW]
[ROW][C]7[/C][C]0.027903[/C][C]0.1913[/C][C]0.42456[/C][/ROW]
[ROW][C]8[/C][C]-0.260763[/C][C]-1.7877[/C][C]0.040137[/C][/ROW]
[ROW][C]9[/C][C]0.086456[/C][C]0.5927[/C][C]0.278106[/C][/ROW]
[ROW][C]10[/C][C]-0.194842[/C][C]-1.3358[/C][C]0.094028[/C][/ROW]
[ROW][C]11[/C][C]0.059843[/C][C]0.4103[/C][C]0.341738[/C][/ROW]
[ROW][C]12[/C][C]-0.301725[/C][C]-2.0685[/C][C]0.022058[/C][/ROW]
[ROW][C]13[/C][C]0.016284[/C][C]0.1116[/C][C]0.455793[/C][/ROW]
[ROW][C]14[/C][C]-0.002338[/C][C]-0.016[/C][C]0.493639[/C][/ROW]
[ROW][C]15[/C][C]-0.047055[/C][C]-0.3226[/C][C]0.374217[/C][/ROW]
[ROW][C]16[/C][C]0.0589[/C][C]0.4038[/C][C]0.344097[/C][/ROW]
[ROW][C]17[/C][C]-0.033816[/C][C]-0.2318[/C][C]0.408839[/C][/ROW]
[/TABLE]
Source: https://freestatistics.org/blog/index.php?pk=28347&T=1

Globally Unique Identifier (entire table): ba.freestatistics.org/blog/index.php?pk=28347&T=1

As an alternative you can also use a QR Code:  

The GUIDs for individual cells are displayed in the table below:

Autocorrelation Function
Time lag kACF(k)T-STATP-value
1-0.153726-1.05390.148659
20.2715481.86160.034457
3-0.054016-0.37030.356406
40.1554721.06590.145965
5-0.032552-0.22320.412188
6-0.187606-1.28620.102343
70.0279030.19130.42456
8-0.260763-1.78770.040137
90.0864560.59270.278106
10-0.194842-1.33580.094028
110.0598430.41030.341738
12-0.301725-2.06850.022058
130.0162840.11160.455793
14-0.002338-0.0160.493639
15-0.047055-0.32260.374217
160.05890.40380.344097
17-0.033816-0.23180.408839


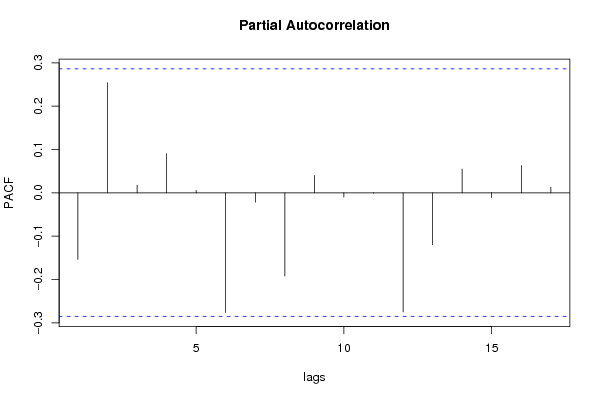
Partial Autocorrelation Function
Time lag kPACF(k)T-STATP-value
1-0.153726-1.05390.148659
20.2539171.74080.044134
30.0176950.12130.451982
40.0900780.61750.269929
50.0054470.03730.485186
6-0.276111-1.89290.032268
7-0.021542-0.14770.441611
8-0.192321-1.31850.096866
90.0398650.27330.39291
10-0.00971-0.06660.473605
11-0.001261-0.00860.49657
12-0.274959-1.8850.032809
13-0.120102-0.82340.207226
140.0547230.37520.354613
15-0.011007-0.07550.470084
160.0625240.42860.33507
170.0130520.08950.464541

\begin{tabular}{lllllllll}
\hline
Partial Autocorrelation Function \tabularnewline
Time lag k & PACF(k) & T-STAT & P-value \tabularnewline
1 & -0.153726 & -1.0539 & 0.148659 \tabularnewline
2 & 0.253917 & 1.7408 & 0.044134 \tabularnewline
3 & 0.017695 & 0.1213 & 0.451982 \tabularnewline
4 & 0.090078 & 0.6175 & 0.269929 \tabularnewline
5 & 0.005447 & 0.0373 & 0.485186 \tabularnewline
6 & -0.276111 & -1.8929 & 0.032268 \tabularnewline
7 & -0.021542 & -0.1477 & 0.441611 \tabularnewline
8 & -0.192321 & -1.3185 & 0.096866 \tabularnewline
9 & 0.039865 & 0.2733 & 0.39291 \tabularnewline
10 & -0.00971 & -0.0666 & 0.473605 \tabularnewline
11 & -0.001261 & -0.0086 & 0.49657 \tabularnewline
12 & -0.274959 & -1.885 & 0.032809 \tabularnewline
13 & -0.120102 & -0.8234 & 0.207226 \tabularnewline
14 & 0.054723 & 0.3752 & 0.354613 \tabularnewline
15 & -0.011007 & -0.0755 & 0.470084 \tabularnewline
16 & 0.062524 & 0.4286 & 0.33507 \tabularnewline
17 & 0.013052 & 0.0895 & 0.464541 \tabularnewline
\hline
\end{tabular}
%Source: https://freestatistics.org/blog/index.php?pk=28347&T=2

[TABLE]
[ROW][C]Partial Autocorrelation Function[/C][/ROW]
[ROW][C]Time lag k[/C][C]PACF(k)[/C][C]T-STAT[/C][C]P-value[/C][/ROW]
[ROW][C]1[/C][C]-0.153726[/C][C]-1.0539[/C][C]0.148659[/C][/ROW]
[ROW][C]2[/C][C]0.253917[/C][C]1.7408[/C][C]0.044134[/C][/ROW]
[ROW][C]3[/C][C]0.017695[/C][C]0.1213[/C][C]0.451982[/C][/ROW]
[ROW][C]4[/C][C]0.090078[/C][C]0.6175[/C][C]0.269929[/C][/ROW]
[ROW][C]5[/C][C]0.005447[/C][C]0.0373[/C][C]0.485186[/C][/ROW]
[ROW][C]6[/C][C]-0.276111[/C][C]-1.8929[/C][C]0.032268[/C][/ROW]
[ROW][C]7[/C][C]-0.021542[/C][C]-0.1477[/C][C]0.441611[/C][/ROW]
[ROW][C]8[/C][C]-0.192321[/C][C]-1.3185[/C][C]0.096866[/C][/ROW]
[ROW][C]9[/C][C]0.039865[/C][C]0.2733[/C][C]0.39291[/C][/ROW]
[ROW][C]10[/C][C]-0.00971[/C][C]-0.0666[/C][C]0.473605[/C][/ROW]
[ROW][C]11[/C][C]-0.001261[/C][C]-0.0086[/C][C]0.49657[/C][/ROW]
[ROW][C]12[/C][C]-0.274959[/C][C]-1.885[/C][C]0.032809[/C][/ROW]
[ROW][C]13[/C][C]-0.120102[/C][C]-0.8234[/C][C]0.207226[/C][/ROW]
[ROW][C]14[/C][C]0.054723[/C][C]0.3752[/C][C]0.354613[/C][/ROW]
[ROW][C]15[/C][C]-0.011007[/C][C]-0.0755[/C][C]0.470084[/C][/ROW]
[ROW][C]16[/C][C]0.062524[/C][C]0.4286[/C][C]0.33507[/C][/ROW]
[ROW][C]17[/C][C]0.013052[/C][C]0.0895[/C][C]0.464541[/C][/ROW]
[/TABLE]
Source: https://freestatistics.org/blog/index.php?pk=28347&T=2

Globally Unique Identifier (entire table): ba.freestatistics.org/blog/index.php?pk=28347&T=2

As an alternative you can also use a QR Code:  

The GUIDs for individual cells are displayed in the table below:

Partial Autocorrelation Function
Time lag kPACF(k)T-STATP-value
1-0.153726-1.05390.148659
20.2539171.74080.044134
30.0176950.12130.451982
40.0900780.61750.269929
50.0054470.03730.485186
6-0.276111-1.89290.032268
7-0.021542-0.14770.441611
8-0.192321-1.31850.096866
90.0398650.27330.39291
10-0.00971-0.06660.473605
11-0.001261-0.00860.49657
12-0.274959-1.8850.032809
13-0.120102-0.82340.207226
140.0547230.37520.354613
15-0.011007-0.07550.470084
160.0625240.42860.33507
170.0130520.08950.464541


Parameters (Session):
par1 = Default ; par2 = 1 ; par3 = 1 ; par4 = 1 ; par5 = 12 ;
Parameters (R input):
par1 = Default ; par2 = 1 ; par3 = 1 ; par4 = 1 ; par5 = 12 ;
R code (references can be found in the software module):
if (par1 == 'Default') {
par1 = 10*log10(length(x))
} else {
par1 <- as.numeric(par1)
}
par2 <- as.numeric(par2)
par3 <- as.numeric(par3)
par4 <- as.numeric(par4)
par5 <- as.numeric(par5)
if (par2 == 0) {
x <- log(x)
} else {
x <- (x ^ par2 - 1) / par2
}
if (par3 > 0) x <- diff(x,lag=1,difference=par3)
if (par4 > 0) x <- diff(x,lag=par5,difference=par4)
bitmap(file='pic1.png')
racf <- acf(x,par1,main='Autocorrelation',xlab='lags',ylab='ACF')
dev.off()
bitmap(file='pic2.png')
rpacf <- pacf(x,par1,main='Partial Autocorrelation',xlab='lags',ylab='PACF')
dev.off()
(myacf <- c(racf$acf))
(mypacf <- c(rpacf$acf))
lengthx <- length(x)
sqrtn <- sqrt(lengthx)
load(file='createtable')
a<-table.start()
a<-table.row.start(a)
a<-table.element(a,'Autocorrelation Function',4,TRUE)
a<-table.row.end(a)
a<-table.row.start(a)
a<-table.element(a,'Time lag k',header=TRUE)
a<-table.element(a,hyperlink('basics.htm','ACF(k)','click here for more information about the Autocorrelation Function'),header=TRUE)
a<-table.element(a,'T-STAT',header=TRUE)
a<-table.element(a,'P-value',header=TRUE)
a<-table.row.end(a)
for (i in 2:(par1+1)) {
a<-table.row.start(a)
a<-table.element(a,i-1,header=TRUE)
a<-table.element(a,round(myacf[i],6))
mytstat <- myacf[i]*sqrtn
a<-table.element(a,round(mytstat,4))
a<-table.element(a,round(1-pt(abs(mytstat),lengthx),6))
a<-table.row.end(a)
}
a<-table.end(a)
table.save(a,file='mytable.tab')
a<-table.start()
a<-table.row.start(a)
a<-table.element(a,'Partial Autocorrelation Function',4,TRUE)
a<-table.row.end(a)
a<-table.row.start(a)
a<-table.element(a,'Time lag k',header=TRUE)
a<-table.element(a,hyperlink('basics.htm','PACF(k)','click here for more information about the Partial Autocorrelation Function'),header=TRUE)
a<-table.element(a,'T-STAT',header=TRUE)
a<-table.element(a,'P-value',header=TRUE)
a<-table.row.end(a)
for (i in 1:par1) {
a<-table.row.start(a)
a<-table.element(a,i,header=TRUE)
a<-table.element(a,round(mypacf[i],6))
mytstat <- mypacf[i]*sqrtn
a<-table.element(a,round(mytstat,4))
a<-table.element(a,round(1-pt(abs(mytstat),lengthx),6))
a<-table.row.end(a)
}
a<-table.end(a)
table.save(a,file='mytable1.tab')