Free Statistics

of Irreproducible Research!

Author's title

Author*The author of this computation has been verified*
R Software Modulerwasp_autocorrelation.wasp
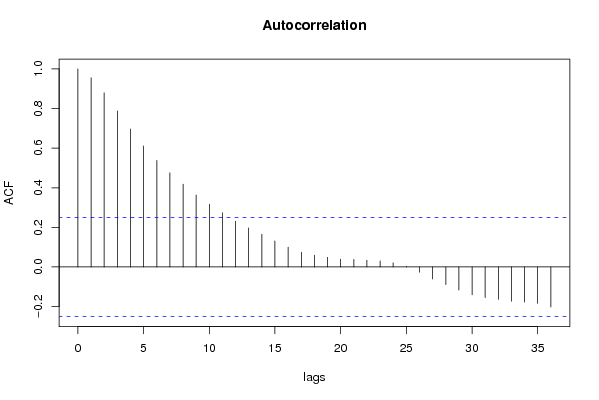
Title produced by software(Partial) Autocorrelation Function
Date of computationTue, 02 Dec 2008 13:08:10 -0700
Cite this page as followsStatistical Computations at FreeStatistics.org, Office for Research Development and Education, URL https://freestatistics.org/blog/index.php?v=date/2008/Dec/02/t1228248585lzyq2jei5axe2v8.htm/, Retrieved Sun, 19 May 2024 12:13:58 +0000
Statistical Computations at FreeStatistics.org, Office for Research Development and Education, URL https://freestatistics.org/blog/index.php?pk=28331, Retrieved Sun, 19 May 2024 12:13:58 +0000
QR Codes:

Original text written by user:
IsPrivate?No (this computation is public)
User-defined keywords
Estimated Impact146
Family? (F = Feedback message, R = changed R code, M = changed R Module, P = changed Parameters, D = changed Data)
F       [(Partial) Autocorrelation Function] [Non stat time ser...] [2008-12-02 20:08:10] [c5d6d05aee6be5527ac4a30a8c3b8fe5] [Current]
Feedback Forum
2008-12-09 23:01:05 [Gert-Jan Geudens] [reply
We zien hier duidelijk een lineaire trend en dus moeten we niet-seizonaal differentiëren (d=1).

Post a new message
Dataseries X:
105,4
107,1
110,7
117,1
118,7
126,5
127,5
134,6
131,8
135,9
142,7
141,7
153,4
145
137,7
148,3
152,2
169,4
168,6
161,1
174,1
179
190,6
190
181,6
174,8
180,5
196,8
193,8
197
216,3
221,4
217,9
229,7
227,4
204,2
196,6
198,8
207,5
190,7
201,6
210,5
223,5
223,8
231,2
244
234,7
250,2
265,7
287,6
283,3
295,4
312,3
333,8
347,7
383,2
407,1
413,6
362,7
321,9
239,4


Summary of computational transaction
Raw Inputview raw input (R code)
Raw Outputview raw output of R engine
Computing time1 seconds
R Server'Gwilym Jenkins' @ 72.249.127.135

\begin{tabular}{lllllllll}
\hline
Summary of computational transaction \tabularnewline
Raw Input & view raw input (R code)  \tabularnewline
Raw Output & view raw output of R engine  \tabularnewline
Computing time & 1 seconds \tabularnewline
R Server & 'Gwilym Jenkins' @ 72.249.127.135 \tabularnewline
\hline
\end{tabular}
%Source: https://freestatistics.org/blog/index.php?pk=28331&T=0

[TABLE]
[ROW][C]Summary of computational transaction[/C][/ROW]
[ROW][C]Raw Input[/C][C]view raw input (R code) [/C][/ROW]
[ROW][C]Raw Output[/C][C]view raw output of R engine [/C][/ROW]
[ROW][C]Computing time[/C][C]1 seconds[/C][/ROW]
[ROW][C]R Server[/C][C]'Gwilym Jenkins' @ 72.249.127.135[/C][/ROW]
[/TABLE]
Source: https://freestatistics.org/blog/index.php?pk=28331&T=0

Globally Unique Identifier (entire table): ba.freestatistics.org/blog/index.php?pk=28331&T=0

As an alternative you can also use a QR Code:  

The GUIDs for individual cells are displayed in the table below:

Summary of computational transaction
Raw Inputview raw input (R code)
Raw Outputview raw output of R engine
Computing time1 seconds
R Server'Gwilym Jenkins' @ 72.249.127.135


Autocorrelation Function
Time lag kACF(k)T-STATP-value
10.9549347.45830
20.8794896.8690
30.7878166.1530
40.6965455.44020
50.6104454.76776e-06
60.5381134.20284.4e-05
70.4751813.71130.000224
80.417753.26270.000905
90.3632472.8370.003086
100.3170362.47610.008036
110.2735772.13670.018321
120.2313571.8070.037851
130.197011.53870.064524
140.1654471.29220.100584
150.1316671.02840.153922
160.0998960.78020.219142
170.0746830.58330.280923
180.0596140.46560.321581
190.0488950.38190.351939
200.039320.30710.379907
210.0377080.29450.384685
220.034220.26730.395084
230.0303710.23720.406646
240.0210790.16460.434888
250.0030170.02360.490638
26-0.026726-0.20870.417675
27-0.06039-0.47170.319425
28-0.088656-0.69240.24565
29-0.116516-0.910.183198
30-0.140793-1.09960.137907
31-0.154756-1.20870.115725
32-0.16342-1.27630.103335
33-0.172653-1.34850.091248
34-0.177459-1.3860.085397
35-0.183491-1.43310.078466
36-0.201959-1.57730.059944

\begin{tabular}{lllllllll}
\hline
Autocorrelation Function \tabularnewline
Time lag k & ACF(k) & T-STAT & P-value \tabularnewline
1 & 0.954934 & 7.4583 & 0 \tabularnewline
2 & 0.879489 & 6.869 & 0 \tabularnewline
3 & 0.787816 & 6.153 & 0 \tabularnewline
4 & 0.696545 & 5.4402 & 0 \tabularnewline
5 & 0.610445 & 4.7677 & 6e-06 \tabularnewline
6 & 0.538113 & 4.2028 & 4.4e-05 \tabularnewline
7 & 0.475181 & 3.7113 & 0.000224 \tabularnewline
8 & 0.41775 & 3.2627 & 0.000905 \tabularnewline
9 & 0.363247 & 2.837 & 0.003086 \tabularnewline
10 & 0.317036 & 2.4761 & 0.008036 \tabularnewline
11 & 0.273577 & 2.1367 & 0.018321 \tabularnewline
12 & 0.231357 & 1.807 & 0.037851 \tabularnewline
13 & 0.19701 & 1.5387 & 0.064524 \tabularnewline
14 & 0.165447 & 1.2922 & 0.100584 \tabularnewline
15 & 0.131667 & 1.0284 & 0.153922 \tabularnewline
16 & 0.099896 & 0.7802 & 0.219142 \tabularnewline
17 & 0.074683 & 0.5833 & 0.280923 \tabularnewline
18 & 0.059614 & 0.4656 & 0.321581 \tabularnewline
19 & 0.048895 & 0.3819 & 0.351939 \tabularnewline
20 & 0.03932 & 0.3071 & 0.379907 \tabularnewline
21 & 0.037708 & 0.2945 & 0.384685 \tabularnewline
22 & 0.03422 & 0.2673 & 0.395084 \tabularnewline
23 & 0.030371 & 0.2372 & 0.406646 \tabularnewline
24 & 0.021079 & 0.1646 & 0.434888 \tabularnewline
25 & 0.003017 & 0.0236 & 0.490638 \tabularnewline
26 & -0.026726 & -0.2087 & 0.417675 \tabularnewline
27 & -0.06039 & -0.4717 & 0.319425 \tabularnewline
28 & -0.088656 & -0.6924 & 0.24565 \tabularnewline
29 & -0.116516 & -0.91 & 0.183198 \tabularnewline
30 & -0.140793 & -1.0996 & 0.137907 \tabularnewline
31 & -0.154756 & -1.2087 & 0.115725 \tabularnewline
32 & -0.16342 & -1.2763 & 0.103335 \tabularnewline
33 & -0.172653 & -1.3485 & 0.091248 \tabularnewline
34 & -0.177459 & -1.386 & 0.085397 \tabularnewline
35 & -0.183491 & -1.4331 & 0.078466 \tabularnewline
36 & -0.201959 & -1.5773 & 0.059944 \tabularnewline
\hline
\end{tabular}
%Source: https://freestatistics.org/blog/index.php?pk=28331&T=1

[TABLE]
[ROW][C]Autocorrelation Function[/C][/ROW]
[ROW][C]Time lag k[/C][C]ACF(k)[/C][C]T-STAT[/C][C]P-value[/C][/ROW]
[ROW][C]1[/C][C]0.954934[/C][C]7.4583[/C][C]0[/C][/ROW]
[ROW][C]2[/C][C]0.879489[/C][C]6.869[/C][C]0[/C][/ROW]
[ROW][C]3[/C][C]0.787816[/C][C]6.153[/C][C]0[/C][/ROW]
[ROW][C]4[/C][C]0.696545[/C][C]5.4402[/C][C]0[/C][/ROW]
[ROW][C]5[/C][C]0.610445[/C][C]4.7677[/C][C]6e-06[/C][/ROW]
[ROW][C]6[/C][C]0.538113[/C][C]4.2028[/C][C]4.4e-05[/C][/ROW]
[ROW][C]7[/C][C]0.475181[/C][C]3.7113[/C][C]0.000224[/C][/ROW]
[ROW][C]8[/C][C]0.41775[/C][C]3.2627[/C][C]0.000905[/C][/ROW]
[ROW][C]9[/C][C]0.363247[/C][C]2.837[/C][C]0.003086[/C][/ROW]
[ROW][C]10[/C][C]0.317036[/C][C]2.4761[/C][C]0.008036[/C][/ROW]
[ROW][C]11[/C][C]0.273577[/C][C]2.1367[/C][C]0.018321[/C][/ROW]
[ROW][C]12[/C][C]0.231357[/C][C]1.807[/C][C]0.037851[/C][/ROW]
[ROW][C]13[/C][C]0.19701[/C][C]1.5387[/C][C]0.064524[/C][/ROW]
[ROW][C]14[/C][C]0.165447[/C][C]1.2922[/C][C]0.100584[/C][/ROW]
[ROW][C]15[/C][C]0.131667[/C][C]1.0284[/C][C]0.153922[/C][/ROW]
[ROW][C]16[/C][C]0.099896[/C][C]0.7802[/C][C]0.219142[/C][/ROW]
[ROW][C]17[/C][C]0.074683[/C][C]0.5833[/C][C]0.280923[/C][/ROW]
[ROW][C]18[/C][C]0.059614[/C][C]0.4656[/C][C]0.321581[/C][/ROW]
[ROW][C]19[/C][C]0.048895[/C][C]0.3819[/C][C]0.351939[/C][/ROW]
[ROW][C]20[/C][C]0.03932[/C][C]0.3071[/C][C]0.379907[/C][/ROW]
[ROW][C]21[/C][C]0.037708[/C][C]0.2945[/C][C]0.384685[/C][/ROW]
[ROW][C]22[/C][C]0.03422[/C][C]0.2673[/C][C]0.395084[/C][/ROW]
[ROW][C]23[/C][C]0.030371[/C][C]0.2372[/C][C]0.406646[/C][/ROW]
[ROW][C]24[/C][C]0.021079[/C][C]0.1646[/C][C]0.434888[/C][/ROW]
[ROW][C]25[/C][C]0.003017[/C][C]0.0236[/C][C]0.490638[/C][/ROW]
[ROW][C]26[/C][C]-0.026726[/C][C]-0.2087[/C][C]0.417675[/C][/ROW]
[ROW][C]27[/C][C]-0.06039[/C][C]-0.4717[/C][C]0.319425[/C][/ROW]
[ROW][C]28[/C][C]-0.088656[/C][C]-0.6924[/C][C]0.24565[/C][/ROW]
[ROW][C]29[/C][C]-0.116516[/C][C]-0.91[/C][C]0.183198[/C][/ROW]
[ROW][C]30[/C][C]-0.140793[/C][C]-1.0996[/C][C]0.137907[/C][/ROW]
[ROW][C]31[/C][C]-0.154756[/C][C]-1.2087[/C][C]0.115725[/C][/ROW]
[ROW][C]32[/C][C]-0.16342[/C][C]-1.2763[/C][C]0.103335[/C][/ROW]
[ROW][C]33[/C][C]-0.172653[/C][C]-1.3485[/C][C]0.091248[/C][/ROW]
[ROW][C]34[/C][C]-0.177459[/C][C]-1.386[/C][C]0.085397[/C][/ROW]
[ROW][C]35[/C][C]-0.183491[/C][C]-1.4331[/C][C]0.078466[/C][/ROW]
[ROW][C]36[/C][C]-0.201959[/C][C]-1.5773[/C][C]0.059944[/C][/ROW]
[/TABLE]
Source: https://freestatistics.org/blog/index.php?pk=28331&T=1

Globally Unique Identifier (entire table): ba.freestatistics.org/blog/index.php?pk=28331&T=1

As an alternative you can also use a QR Code:  

The GUIDs for individual cells are displayed in the table below:

Autocorrelation Function
Time lag kACF(k)T-STATP-value
10.9549347.45830
20.8794896.8690
30.7878166.1530
40.6965455.44020
50.6104454.76776e-06
60.5381134.20284.4e-05
70.4751813.71130.000224
80.417753.26270.000905
90.3632472.8370.003086
100.3170362.47610.008036
110.2735772.13670.018321
120.2313571.8070.037851
130.197011.53870.064524
140.1654471.29220.100584
150.1316671.02840.153922
160.0998960.78020.219142
170.0746830.58330.280923
180.0596140.46560.321581
190.0488950.38190.351939
200.039320.30710.379907
210.0377080.29450.384685
220.034220.26730.395084
230.0303710.23720.406646
240.0210790.16460.434888
250.0030170.02360.490638
26-0.026726-0.20870.417675
27-0.06039-0.47170.319425
28-0.088656-0.69240.24565
29-0.116516-0.910.183198
30-0.140793-1.09960.137907
31-0.154756-1.20870.115725
32-0.16342-1.27630.103335
33-0.172653-1.34850.091248
34-0.177459-1.3860.085397
35-0.183491-1.43310.078466
36-0.201959-1.57730.059944


Partial Autocorrelation Function
Time lag kPACF(k)T-STATP-value
10.9549347.45830
2-0.367882-2.87320.002792
3-0.127367-0.99480.16189
40.0432060.33750.368467
5-0.00128-0.010.496028
60.0748440.58460.280503
7-0.028798-0.22490.411397
8-0.049686-0.38810.349662
9-0.02556-0.19960.421218
100.0628440.49080.312655
11-0.046223-0.3610.35967
12-0.04405-0.3440.365998
130.0753250.58830.27925
14-0.053046-0.41430.340053
15-0.075646-0.59080.278413
160.0317410.24790.402519
170.0465110.36330.358834
180.064350.50260.308532
19-0.038745-0.30260.38161
20-0.055877-0.43640.33204
210.1015280.7930.215437
22-0.057781-0.45130.326693
230.0004170.00330.498707
24-0.076733-0.59930.275594
25-0.090207-0.70450.241889
26-0.072401-0.56550.286914
270.0090840.07090.471837
280.0727590.56830.285971
29-0.102714-0.80220.212769
300.0155750.12160.451791
310.0660070.51550.304024
32-0.06059-0.47320.318872
33-0.032455-0.25350.400376
340.0540510.42220.337198
35-0.077558-0.60570.273465
36-0.188338-1.4710.07322

\begin{tabular}{lllllllll}
\hline
Partial Autocorrelation Function \tabularnewline
Time lag k & PACF(k) & T-STAT & P-value \tabularnewline
1 & 0.954934 & 7.4583 & 0 \tabularnewline
2 & -0.367882 & -2.8732 & 0.002792 \tabularnewline
3 & -0.127367 & -0.9948 & 0.16189 \tabularnewline
4 & 0.043206 & 0.3375 & 0.368467 \tabularnewline
5 & -0.00128 & -0.01 & 0.496028 \tabularnewline
6 & 0.074844 & 0.5846 & 0.280503 \tabularnewline
7 & -0.028798 & -0.2249 & 0.411397 \tabularnewline
8 & -0.049686 & -0.3881 & 0.349662 \tabularnewline
9 & -0.02556 & -0.1996 & 0.421218 \tabularnewline
10 & 0.062844 & 0.4908 & 0.312655 \tabularnewline
11 & -0.046223 & -0.361 & 0.35967 \tabularnewline
12 & -0.04405 & -0.344 & 0.365998 \tabularnewline
13 & 0.075325 & 0.5883 & 0.27925 \tabularnewline
14 & -0.053046 & -0.4143 & 0.340053 \tabularnewline
15 & -0.075646 & -0.5908 & 0.278413 \tabularnewline
16 & 0.031741 & 0.2479 & 0.402519 \tabularnewline
17 & 0.046511 & 0.3633 & 0.358834 \tabularnewline
18 & 0.06435 & 0.5026 & 0.308532 \tabularnewline
19 & -0.038745 & -0.3026 & 0.38161 \tabularnewline
20 & -0.055877 & -0.4364 & 0.33204 \tabularnewline
21 & 0.101528 & 0.793 & 0.215437 \tabularnewline
22 & -0.057781 & -0.4513 & 0.326693 \tabularnewline
23 & 0.000417 & 0.0033 & 0.498707 \tabularnewline
24 & -0.076733 & -0.5993 & 0.275594 \tabularnewline
25 & -0.090207 & -0.7045 & 0.241889 \tabularnewline
26 & -0.072401 & -0.5655 & 0.286914 \tabularnewline
27 & 0.009084 & 0.0709 & 0.471837 \tabularnewline
28 & 0.072759 & 0.5683 & 0.285971 \tabularnewline
29 & -0.102714 & -0.8022 & 0.212769 \tabularnewline
30 & 0.015575 & 0.1216 & 0.451791 \tabularnewline
31 & 0.066007 & 0.5155 & 0.304024 \tabularnewline
32 & -0.06059 & -0.4732 & 0.318872 \tabularnewline
33 & -0.032455 & -0.2535 & 0.400376 \tabularnewline
34 & 0.054051 & 0.4222 & 0.337198 \tabularnewline
35 & -0.077558 & -0.6057 & 0.273465 \tabularnewline
36 & -0.188338 & -1.471 & 0.07322 \tabularnewline
\hline
\end{tabular}
%Source: https://freestatistics.org/blog/index.php?pk=28331&T=2

[TABLE]
[ROW][C]Partial Autocorrelation Function[/C][/ROW]
[ROW][C]Time lag k[/C][C]PACF(k)[/C][C]T-STAT[/C][C]P-value[/C][/ROW]
[ROW][C]1[/C][C]0.954934[/C][C]7.4583[/C][C]0[/C][/ROW]
[ROW][C]2[/C][C]-0.367882[/C][C]-2.8732[/C][C]0.002792[/C][/ROW]
[ROW][C]3[/C][C]-0.127367[/C][C]-0.9948[/C][C]0.16189[/C][/ROW]
[ROW][C]4[/C][C]0.043206[/C][C]0.3375[/C][C]0.368467[/C][/ROW]
[ROW][C]5[/C][C]-0.00128[/C][C]-0.01[/C][C]0.496028[/C][/ROW]
[ROW][C]6[/C][C]0.074844[/C][C]0.5846[/C][C]0.280503[/C][/ROW]
[ROW][C]7[/C][C]-0.028798[/C][C]-0.2249[/C][C]0.411397[/C][/ROW]
[ROW][C]8[/C][C]-0.049686[/C][C]-0.3881[/C][C]0.349662[/C][/ROW]
[ROW][C]9[/C][C]-0.02556[/C][C]-0.1996[/C][C]0.421218[/C][/ROW]
[ROW][C]10[/C][C]0.062844[/C][C]0.4908[/C][C]0.312655[/C][/ROW]
[ROW][C]11[/C][C]-0.046223[/C][C]-0.361[/C][C]0.35967[/C][/ROW]
[ROW][C]12[/C][C]-0.04405[/C][C]-0.344[/C][C]0.365998[/C][/ROW]
[ROW][C]13[/C][C]0.075325[/C][C]0.5883[/C][C]0.27925[/C][/ROW]
[ROW][C]14[/C][C]-0.053046[/C][C]-0.4143[/C][C]0.340053[/C][/ROW]
[ROW][C]15[/C][C]-0.075646[/C][C]-0.5908[/C][C]0.278413[/C][/ROW]
[ROW][C]16[/C][C]0.031741[/C][C]0.2479[/C][C]0.402519[/C][/ROW]
[ROW][C]17[/C][C]0.046511[/C][C]0.3633[/C][C]0.358834[/C][/ROW]
[ROW][C]18[/C][C]0.06435[/C][C]0.5026[/C][C]0.308532[/C][/ROW]
[ROW][C]19[/C][C]-0.038745[/C][C]-0.3026[/C][C]0.38161[/C][/ROW]
[ROW][C]20[/C][C]-0.055877[/C][C]-0.4364[/C][C]0.33204[/C][/ROW]
[ROW][C]21[/C][C]0.101528[/C][C]0.793[/C][C]0.215437[/C][/ROW]
[ROW][C]22[/C][C]-0.057781[/C][C]-0.4513[/C][C]0.326693[/C][/ROW]
[ROW][C]23[/C][C]0.000417[/C][C]0.0033[/C][C]0.498707[/C][/ROW]
[ROW][C]24[/C][C]-0.076733[/C][C]-0.5993[/C][C]0.275594[/C][/ROW]
[ROW][C]25[/C][C]-0.090207[/C][C]-0.7045[/C][C]0.241889[/C][/ROW]
[ROW][C]26[/C][C]-0.072401[/C][C]-0.5655[/C][C]0.286914[/C][/ROW]
[ROW][C]27[/C][C]0.009084[/C][C]0.0709[/C][C]0.471837[/C][/ROW]
[ROW][C]28[/C][C]0.072759[/C][C]0.5683[/C][C]0.285971[/C][/ROW]
[ROW][C]29[/C][C]-0.102714[/C][C]-0.8022[/C][C]0.212769[/C][/ROW]
[ROW][C]30[/C][C]0.015575[/C][C]0.1216[/C][C]0.451791[/C][/ROW]
[ROW][C]31[/C][C]0.066007[/C][C]0.5155[/C][C]0.304024[/C][/ROW]
[ROW][C]32[/C][C]-0.06059[/C][C]-0.4732[/C][C]0.318872[/C][/ROW]
[ROW][C]33[/C][C]-0.032455[/C][C]-0.2535[/C][C]0.400376[/C][/ROW]
[ROW][C]34[/C][C]0.054051[/C][C]0.4222[/C][C]0.337198[/C][/ROW]
[ROW][C]35[/C][C]-0.077558[/C][C]-0.6057[/C][C]0.273465[/C][/ROW]
[ROW][C]36[/C][C]-0.188338[/C][C]-1.471[/C][C]0.07322[/C][/ROW]
[/TABLE]
Source: https://freestatistics.org/blog/index.php?pk=28331&T=2

Globally Unique Identifier (entire table): ba.freestatistics.org/blog/index.php?pk=28331&T=2

As an alternative you can also use a QR Code:  

The GUIDs for individual cells are displayed in the table below:

Partial Autocorrelation Function
Time lag kPACF(k)T-STATP-value
10.9549347.45830
2-0.367882-2.87320.002792
3-0.127367-0.99480.16189
40.0432060.33750.368467
5-0.00128-0.010.496028
60.0748440.58460.280503
7-0.028798-0.22490.411397
8-0.049686-0.38810.349662
9-0.02556-0.19960.421218
100.0628440.49080.312655
11-0.046223-0.3610.35967
12-0.04405-0.3440.365998
130.0753250.58830.27925
14-0.053046-0.41430.340053
15-0.075646-0.59080.278413
160.0317410.24790.402519
170.0465110.36330.358834
180.064350.50260.308532
19-0.038745-0.30260.38161
20-0.055877-0.43640.33204
210.1015280.7930.215437
22-0.057781-0.45130.326693
230.0004170.00330.498707
24-0.076733-0.59930.275594
25-0.090207-0.70450.241889
26-0.072401-0.56550.286914
270.0090840.07090.471837
280.0727590.56830.285971
29-0.102714-0.80220.212769
300.0155750.12160.451791
310.0660070.51550.304024
32-0.06059-0.47320.318872
33-0.032455-0.25350.400376
340.0540510.42220.337198
35-0.077558-0.60570.273465
36-0.188338-1.4710.07322


Parameters (Session):
par1 = 36 ; par2 = 1 ; par3 = 0 ; par4 = 0 ; par5 = 12 ;
Parameters (R input):
par1 = 36 ; par2 = 1 ; par3 = 0 ; par4 = 0 ; par5 = 12 ;
R code (references can be found in the software module):
if (par1 == 'Default') {
par1 = 10*log10(length(x))
} else {
par1 <- as.numeric(par1)
}
par2 <- as.numeric(par2)
par3 <- as.numeric(par3)
par4 <- as.numeric(par4)
par5 <- as.numeric(par5)
if (par2 == 0) {
x <- log(x)
} else {
x <- (x ^ par2 - 1) / par2
}
if (par3 > 0) x <- diff(x,lag=1,difference=par3)
if (par4 > 0) x <- diff(x,lag=par5,difference=par4)
bitmap(file='pic1.png')
racf <- acf(x,par1,main='Autocorrelation',xlab='lags',ylab='ACF')
dev.off()
bitmap(file='pic2.png')
rpacf <- pacf(x,par1,main='Partial Autocorrelation',xlab='lags',ylab='PACF')
dev.off()
(myacf <- c(racf$acf))
(mypacf <- c(rpacf$acf))
lengthx <- length(x)
sqrtn <- sqrt(lengthx)
load(file='createtable')
a<-table.start()
a<-table.row.start(a)
a<-table.element(a,'Autocorrelation Function',4,TRUE)
a<-table.row.end(a)
a<-table.row.start(a)
a<-table.element(a,'Time lag k',header=TRUE)
a<-table.element(a,hyperlink('basics.htm','ACF(k)','click here for more information about the Autocorrelation Function'),header=TRUE)
a<-table.element(a,'T-STAT',header=TRUE)
a<-table.element(a,'P-value',header=TRUE)
a<-table.row.end(a)
for (i in 2:(par1+1)) {
a<-table.row.start(a)
a<-table.element(a,i-1,header=TRUE)
a<-table.element(a,round(myacf[i],6))
mytstat <- myacf[i]*sqrtn
a<-table.element(a,round(mytstat,4))
a<-table.element(a,round(1-pt(abs(mytstat),lengthx),6))
a<-table.row.end(a)
}
a<-table.end(a)
table.save(a,file='mytable.tab')
a<-table.start()
a<-table.row.start(a)
a<-table.element(a,'Partial Autocorrelation Function',4,TRUE)
a<-table.row.end(a)
a<-table.row.start(a)
a<-table.element(a,'Time lag k',header=TRUE)
a<-table.element(a,hyperlink('basics.htm','PACF(k)','click here for more information about the Partial Autocorrelation Function'),header=TRUE)
a<-table.element(a,'T-STAT',header=TRUE)
a<-table.element(a,'P-value',header=TRUE)
a<-table.row.end(a)
for (i in 1:par1) {
a<-table.row.start(a)
a<-table.element(a,i,header=TRUE)
a<-table.element(a,round(mypacf[i],6))
mytstat <- mypacf[i]*sqrtn
a<-table.element(a,round(mytstat,4))
a<-table.element(a,round(1-pt(abs(mytstat),lengthx),6))
a<-table.row.end(a)
}
a<-table.end(a)
table.save(a,file='mytable1.tab')