Free Statistics

of Irreproducible Research!

Author's title

Author*The author of this computation has been verified*
R Software Modulerwasp_autocorrelation.wasp
Title produced by software(Partial) Autocorrelation Function
Date of computationTue, 02 Dec 2008 12:58:11 -0700
Cite this page as followsStatistical Computations at FreeStatistics.org, Office for Research Development and Education, URL https://freestatistics.org/blog/index.php?v=date/2008/Dec/02/t1228247936vyfsf1tya7ols0g.htm/, Retrieved Sun, 19 May 2024 11:36:42 +0000
Statistical Computations at FreeStatistics.org, Office for Research Development and Education, URL https://freestatistics.org/blog/index.php?pk=28305, Retrieved Sun, 19 May 2024 11:36:42 +0000
QR Codes:

Original text written by user:
IsPrivate?No (this computation is public)
User-defined keywords
Estimated Impact187
Family? (F = Feedback message, R = changed R code, M = changed R Module, P = changed Parameters, D = changed Data)
-     [Standard Deviation-Mean Plot] [nsts Q8] [2008-12-02 19:40:41] [3a9fc6d5b5e0e816787b7dbace57e7cd]
F RMPD  [(Partial) Autocorrelation Function] [nsts Q8] [2008-12-02 19:45:13] [3a9fc6d5b5e0e816787b7dbace57e7cd]
F RMPD    [Standard Deviation-Mean Plot] [nsts Q8] [2008-12-02 19:54:11] [3a9fc6d5b5e0e816787b7dbace57e7cd]
F RMPD        [(Partial) Autocorrelation Function] [nsts Q8] [2008-12-02 19:58:11] [821c4b3d195be8e737cf8c9dc649d3cf] [Current]
F   P           [(Partial) Autocorrelation Function] [nsts Q8] [2008-12-02 20:02:32] [3a9fc6d5b5e0e816787b7dbace57e7cd]
Feedback Forum
2008-12-09 23:34:22 [Gert-Jan Geudens] [reply
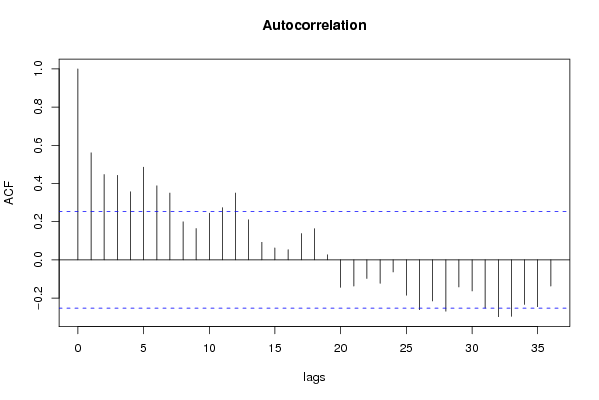
We bekomen hier inderdaad een lineaire trend waardoor we niet-seizonaal moeten differentiëren.

Post a new message
Dataseries X:
377.2
332.2
364.8
352.4
341.6
298.2
355.3
330.9
314.5
418.9
433.2
367
422.9
352.1
419.8
432.7
414.2
387.7
297.2
357.4
384.2
425.2
385.3
355.4
409.8
421.2
421.8
464.2
494
404.2
411.4
403.4
403.3
520.9
439.8
434.8
476.5
454.3
522
498.4
439.9
450.7
447.1
451.3
466.8
498
533.6
451.9
477.1
410.4
469.5
485.4
406.7
439.7
412.2
440.2
411.1
477.7
463.2
320.5


Summary of computational transaction
Raw Inputview raw input (R code)
Raw Outputview raw output of R engine
Computing time1 seconds
R Server'George Udny Yule' @ 72.249.76.132

\begin{tabular}{lllllllll}
\hline
Summary of computational transaction \tabularnewline
Raw Input & view raw input (R code)  \tabularnewline
Raw Output & view raw output of R engine  \tabularnewline
Computing time & 1 seconds \tabularnewline
R Server & 'George Udny Yule' @ 72.249.76.132 \tabularnewline
\hline
\end{tabular}
%Source: https://freestatistics.org/blog/index.php?pk=28305&T=0

[TABLE]
[ROW][C]Summary of computational transaction[/C][/ROW]
[ROW][C]Raw Input[/C][C]view raw input (R code) [/C][/ROW]
[ROW][C]Raw Output[/C][C]view raw output of R engine [/C][/ROW]
[ROW][C]Computing time[/C][C]1 seconds[/C][/ROW]
[ROW][C]R Server[/C][C]'George Udny Yule' @ 72.249.76.132[/C][/ROW]
[/TABLE]
Source: https://freestatistics.org/blog/index.php?pk=28305&T=0

Globally Unique Identifier (entire table): ba.freestatistics.org/blog/index.php?pk=28305&T=0

As an alternative you can also use a QR Code:  

The GUIDs for individual cells are displayed in the table below:

Summary of computational transaction
Raw Inputview raw input (R code)
Raw Outputview raw output of R engine
Computing time1 seconds
R Server'George Udny Yule' @ 72.249.76.132


Autocorrelation Function
Time lag kACF(k)T-STATP-value
10.5606284.34262.8e-05
20.4469913.46240.000497
30.4424993.42760.000553
40.3563822.76050.003822
50.4854453.76020.000194
60.3876193.00250.00195
70.3496692.70850.004397
80.1990791.54210.064159
90.1639431.26990.104512
100.2442421.89190.031667
110.2734272.1180.019165
120.350072.71160.00436
130.2094251.62220.055003
140.091890.71180.23968
150.0624090.48340.31528
160.0531190.41150.341103
170.1374161.06440.145701
180.1633961.26570.105263
190.0262690.20350.419724
20-0.143921-1.11480.13469
21-0.137298-1.06350.145908
22-0.097382-0.75430.226804
23-0.122866-0.95170.17253
24-0.063201-0.48960.313118
25-0.185412-1.43620.07807
26-0.261403-2.02480.023671
27-0.215084-1.6660.05046
28-0.268755-2.08180.020819
29-0.141704-1.09760.138374
30-0.163078-1.26320.105702
31-0.252614-1.95670.027518
32-0.297626-2.30540.012309
33-0.296059-2.29330.012676
34-0.23356-1.80910.037719
35-0.245372-1.90060.031078
36-0.137657-1.06630.145283

\begin{tabular}{lllllllll}
\hline
Autocorrelation Function \tabularnewline
Time lag k & ACF(k) & T-STAT & P-value \tabularnewline
1 & 0.560628 & 4.3426 & 2.8e-05 \tabularnewline
2 & 0.446991 & 3.4624 & 0.000497 \tabularnewline
3 & 0.442499 & 3.4276 & 0.000553 \tabularnewline
4 & 0.356382 & 2.7605 & 0.003822 \tabularnewline
5 & 0.485445 & 3.7602 & 0.000194 \tabularnewline
6 & 0.387619 & 3.0025 & 0.00195 \tabularnewline
7 & 0.349669 & 2.7085 & 0.004397 \tabularnewline
8 & 0.199079 & 1.5421 & 0.064159 \tabularnewline
9 & 0.163943 & 1.2699 & 0.104512 \tabularnewline
10 & 0.244242 & 1.8919 & 0.031667 \tabularnewline
11 & 0.273427 & 2.118 & 0.019165 \tabularnewline
12 & 0.35007 & 2.7116 & 0.00436 \tabularnewline
13 & 0.209425 & 1.6222 & 0.055003 \tabularnewline
14 & 0.09189 & 0.7118 & 0.23968 \tabularnewline
15 & 0.062409 & 0.4834 & 0.31528 \tabularnewline
16 & 0.053119 & 0.4115 & 0.341103 \tabularnewline
17 & 0.137416 & 1.0644 & 0.145701 \tabularnewline
18 & 0.163396 & 1.2657 & 0.105263 \tabularnewline
19 & 0.026269 & 0.2035 & 0.419724 \tabularnewline
20 & -0.143921 & -1.1148 & 0.13469 \tabularnewline
21 & -0.137298 & -1.0635 & 0.145908 \tabularnewline
22 & -0.097382 & -0.7543 & 0.226804 \tabularnewline
23 & -0.122866 & -0.9517 & 0.17253 \tabularnewline
24 & -0.063201 & -0.4896 & 0.313118 \tabularnewline
25 & -0.185412 & -1.4362 & 0.07807 \tabularnewline
26 & -0.261403 & -2.0248 & 0.023671 \tabularnewline
27 & -0.215084 & -1.666 & 0.05046 \tabularnewline
28 & -0.268755 & -2.0818 & 0.020819 \tabularnewline
29 & -0.141704 & -1.0976 & 0.138374 \tabularnewline
30 & -0.163078 & -1.2632 & 0.105702 \tabularnewline
31 & -0.252614 & -1.9567 & 0.027518 \tabularnewline
32 & -0.297626 & -2.3054 & 0.012309 \tabularnewline
33 & -0.296059 & -2.2933 & 0.012676 \tabularnewline
34 & -0.23356 & -1.8091 & 0.037719 \tabularnewline
35 & -0.245372 & -1.9006 & 0.031078 \tabularnewline
36 & -0.137657 & -1.0663 & 0.145283 \tabularnewline
\hline
\end{tabular}
%Source: https://freestatistics.org/blog/index.php?pk=28305&T=1

[TABLE]
[ROW][C]Autocorrelation Function[/C][/ROW]
[ROW][C]Time lag k[/C][C]ACF(k)[/C][C]T-STAT[/C][C]P-value[/C][/ROW]
[ROW][C]1[/C][C]0.560628[/C][C]4.3426[/C][C]2.8e-05[/C][/ROW]
[ROW][C]2[/C][C]0.446991[/C][C]3.4624[/C][C]0.000497[/C][/ROW]
[ROW][C]3[/C][C]0.442499[/C][C]3.4276[/C][C]0.000553[/C][/ROW]
[ROW][C]4[/C][C]0.356382[/C][C]2.7605[/C][C]0.003822[/C][/ROW]
[ROW][C]5[/C][C]0.485445[/C][C]3.7602[/C][C]0.000194[/C][/ROW]
[ROW][C]6[/C][C]0.387619[/C][C]3.0025[/C][C]0.00195[/C][/ROW]
[ROW][C]7[/C][C]0.349669[/C][C]2.7085[/C][C]0.004397[/C][/ROW]
[ROW][C]8[/C][C]0.199079[/C][C]1.5421[/C][C]0.064159[/C][/ROW]
[ROW][C]9[/C][C]0.163943[/C][C]1.2699[/C][C]0.104512[/C][/ROW]
[ROW][C]10[/C][C]0.244242[/C][C]1.8919[/C][C]0.031667[/C][/ROW]
[ROW][C]11[/C][C]0.273427[/C][C]2.118[/C][C]0.019165[/C][/ROW]
[ROW][C]12[/C][C]0.35007[/C][C]2.7116[/C][C]0.00436[/C][/ROW]
[ROW][C]13[/C][C]0.209425[/C][C]1.6222[/C][C]0.055003[/C][/ROW]
[ROW][C]14[/C][C]0.09189[/C][C]0.7118[/C][C]0.23968[/C][/ROW]
[ROW][C]15[/C][C]0.062409[/C][C]0.4834[/C][C]0.31528[/C][/ROW]
[ROW][C]16[/C][C]0.053119[/C][C]0.4115[/C][C]0.341103[/C][/ROW]
[ROW][C]17[/C][C]0.137416[/C][C]1.0644[/C][C]0.145701[/C][/ROW]
[ROW][C]18[/C][C]0.163396[/C][C]1.2657[/C][C]0.105263[/C][/ROW]
[ROW][C]19[/C][C]0.026269[/C][C]0.2035[/C][C]0.419724[/C][/ROW]
[ROW][C]20[/C][C]-0.143921[/C][C]-1.1148[/C][C]0.13469[/C][/ROW]
[ROW][C]21[/C][C]-0.137298[/C][C]-1.0635[/C][C]0.145908[/C][/ROW]
[ROW][C]22[/C][C]-0.097382[/C][C]-0.7543[/C][C]0.226804[/C][/ROW]
[ROW][C]23[/C][C]-0.122866[/C][C]-0.9517[/C][C]0.17253[/C][/ROW]
[ROW][C]24[/C][C]-0.063201[/C][C]-0.4896[/C][C]0.313118[/C][/ROW]
[ROW][C]25[/C][C]-0.185412[/C][C]-1.4362[/C][C]0.07807[/C][/ROW]
[ROW][C]26[/C][C]-0.261403[/C][C]-2.0248[/C][C]0.023671[/C][/ROW]
[ROW][C]27[/C][C]-0.215084[/C][C]-1.666[/C][C]0.05046[/C][/ROW]
[ROW][C]28[/C][C]-0.268755[/C][C]-2.0818[/C][C]0.020819[/C][/ROW]
[ROW][C]29[/C][C]-0.141704[/C][C]-1.0976[/C][C]0.138374[/C][/ROW]
[ROW][C]30[/C][C]-0.163078[/C][C]-1.2632[/C][C]0.105702[/C][/ROW]
[ROW][C]31[/C][C]-0.252614[/C][C]-1.9567[/C][C]0.027518[/C][/ROW]
[ROW][C]32[/C][C]-0.297626[/C][C]-2.3054[/C][C]0.012309[/C][/ROW]
[ROW][C]33[/C][C]-0.296059[/C][C]-2.2933[/C][C]0.012676[/C][/ROW]
[ROW][C]34[/C][C]-0.23356[/C][C]-1.8091[/C][C]0.037719[/C][/ROW]
[ROW][C]35[/C][C]-0.245372[/C][C]-1.9006[/C][C]0.031078[/C][/ROW]
[ROW][C]36[/C][C]-0.137657[/C][C]-1.0663[/C][C]0.145283[/C][/ROW]
[/TABLE]
Source: https://freestatistics.org/blog/index.php?pk=28305&T=1

Globally Unique Identifier (entire table): ba.freestatistics.org/blog/index.php?pk=28305&T=1

As an alternative you can also use a QR Code:  

The GUIDs for individual cells are displayed in the table below:

Autocorrelation Function
Time lag kACF(k)T-STATP-value
10.5606284.34262.8e-05
20.4469913.46240.000497
30.4424993.42760.000553
40.3563822.76050.003822
50.4854453.76020.000194
60.3876193.00250.00195
70.3496692.70850.004397
80.1990791.54210.064159
90.1639431.26990.104512
100.2442421.89190.031667
110.2734272.1180.019165
120.350072.71160.00436
130.2094251.62220.055003
140.091890.71180.23968
150.0624090.48340.31528
160.0531190.41150.341103
170.1374161.06440.145701
180.1633961.26570.105263
190.0262690.20350.419724
20-0.143921-1.11480.13469
21-0.137298-1.06350.145908
22-0.097382-0.75430.226804
23-0.122866-0.95170.17253
24-0.063201-0.48960.313118
25-0.185412-1.43620.07807
26-0.261403-2.02480.023671
27-0.215084-1.6660.05046
28-0.268755-2.08180.020819
29-0.141704-1.09760.138374
30-0.163078-1.26320.105702
31-0.252614-1.95670.027518
32-0.297626-2.30540.012309
33-0.296059-2.29330.012676
34-0.23356-1.80910.037719
35-0.245372-1.90060.031078
36-0.137657-1.06630.145283


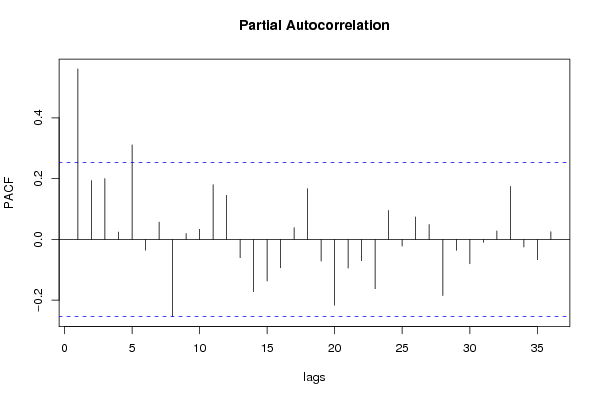
Partial Autocorrelation Function
Time lag kPACF(k)T-STATP-value
10.5606284.34262.8e-05
20.1935081.49890.069571
30.1998571.54810.06343
40.0241020.18670.426265
50.3108782.4080.009564
6-0.035676-0.27630.391617
70.0567910.43990.330793
8-0.254175-1.96880.026798
90.01920.14870.441135
100.0332710.25770.398754
110.1799141.39360.084288
120.1450841.12380.132783
13-0.060027-0.4650.321819
14-0.172253-1.33430.09358
15-0.13665-1.05850.147038
16-0.093717-0.72590.235353
170.0383090.29670.383846
180.166661.29090.100838
19-0.07131-0.55240.291376
20-0.216374-1.6760.049468
21-0.09426-0.73010.234075
22-0.070039-0.54250.294734
23-0.1624-1.25790.106643
240.0951590.73710.231968
25-0.021999-0.17040.432632
260.0737990.57160.284849
270.0487190.37740.353614
28-0.184632-1.43020.07893
29-0.035948-0.27850.390811
30-0.080489-0.62350.267672
31-0.009905-0.07670.469548
320.0277430.21490.415288
330.1741611.3490.091196
34-0.024677-0.19120.424526
35-0.066831-0.51770.303294
360.0252540.19560.422785

\begin{tabular}{lllllllll}
\hline
Partial Autocorrelation Function \tabularnewline
Time lag k & PACF(k) & T-STAT & P-value \tabularnewline
1 & 0.560628 & 4.3426 & 2.8e-05 \tabularnewline
2 & 0.193508 & 1.4989 & 0.069571 \tabularnewline
3 & 0.199857 & 1.5481 & 0.06343 \tabularnewline
4 & 0.024102 & 0.1867 & 0.426265 \tabularnewline
5 & 0.310878 & 2.408 & 0.009564 \tabularnewline
6 & -0.035676 & -0.2763 & 0.391617 \tabularnewline
7 & 0.056791 & 0.4399 & 0.330793 \tabularnewline
8 & -0.254175 & -1.9688 & 0.026798 \tabularnewline
9 & 0.0192 & 0.1487 & 0.441135 \tabularnewline
10 & 0.033271 & 0.2577 & 0.398754 \tabularnewline
11 & 0.179914 & 1.3936 & 0.084288 \tabularnewline
12 & 0.145084 & 1.1238 & 0.132783 \tabularnewline
13 & -0.060027 & -0.465 & 0.321819 \tabularnewline
14 & -0.172253 & -1.3343 & 0.09358 \tabularnewline
15 & -0.13665 & -1.0585 & 0.147038 \tabularnewline
16 & -0.093717 & -0.7259 & 0.235353 \tabularnewline
17 & 0.038309 & 0.2967 & 0.383846 \tabularnewline
18 & 0.16666 & 1.2909 & 0.100838 \tabularnewline
19 & -0.07131 & -0.5524 & 0.291376 \tabularnewline
20 & -0.216374 & -1.676 & 0.049468 \tabularnewline
21 & -0.09426 & -0.7301 & 0.234075 \tabularnewline
22 & -0.070039 & -0.5425 & 0.294734 \tabularnewline
23 & -0.1624 & -1.2579 & 0.106643 \tabularnewline
24 & 0.095159 & 0.7371 & 0.231968 \tabularnewline
25 & -0.021999 & -0.1704 & 0.432632 \tabularnewline
26 & 0.073799 & 0.5716 & 0.284849 \tabularnewline
27 & 0.048719 & 0.3774 & 0.353614 \tabularnewline
28 & -0.184632 & -1.4302 & 0.07893 \tabularnewline
29 & -0.035948 & -0.2785 & 0.390811 \tabularnewline
30 & -0.080489 & -0.6235 & 0.267672 \tabularnewline
31 & -0.009905 & -0.0767 & 0.469548 \tabularnewline
32 & 0.027743 & 0.2149 & 0.415288 \tabularnewline
33 & 0.174161 & 1.349 & 0.091196 \tabularnewline
34 & -0.024677 & -0.1912 & 0.424526 \tabularnewline
35 & -0.066831 & -0.5177 & 0.303294 \tabularnewline
36 & 0.025254 & 0.1956 & 0.422785 \tabularnewline
\hline
\end{tabular}
%Source: https://freestatistics.org/blog/index.php?pk=28305&T=2

[TABLE]
[ROW][C]Partial Autocorrelation Function[/C][/ROW]
[ROW][C]Time lag k[/C][C]PACF(k)[/C][C]T-STAT[/C][C]P-value[/C][/ROW]
[ROW][C]1[/C][C]0.560628[/C][C]4.3426[/C][C]2.8e-05[/C][/ROW]
[ROW][C]2[/C][C]0.193508[/C][C]1.4989[/C][C]0.069571[/C][/ROW]
[ROW][C]3[/C][C]0.199857[/C][C]1.5481[/C][C]0.06343[/C][/ROW]
[ROW][C]4[/C][C]0.024102[/C][C]0.1867[/C][C]0.426265[/C][/ROW]
[ROW][C]5[/C][C]0.310878[/C][C]2.408[/C][C]0.009564[/C][/ROW]
[ROW][C]6[/C][C]-0.035676[/C][C]-0.2763[/C][C]0.391617[/C][/ROW]
[ROW][C]7[/C][C]0.056791[/C][C]0.4399[/C][C]0.330793[/C][/ROW]
[ROW][C]8[/C][C]-0.254175[/C][C]-1.9688[/C][C]0.026798[/C][/ROW]
[ROW][C]9[/C][C]0.0192[/C][C]0.1487[/C][C]0.441135[/C][/ROW]
[ROW][C]10[/C][C]0.033271[/C][C]0.2577[/C][C]0.398754[/C][/ROW]
[ROW][C]11[/C][C]0.179914[/C][C]1.3936[/C][C]0.084288[/C][/ROW]
[ROW][C]12[/C][C]0.145084[/C][C]1.1238[/C][C]0.132783[/C][/ROW]
[ROW][C]13[/C][C]-0.060027[/C][C]-0.465[/C][C]0.321819[/C][/ROW]
[ROW][C]14[/C][C]-0.172253[/C][C]-1.3343[/C][C]0.09358[/C][/ROW]
[ROW][C]15[/C][C]-0.13665[/C][C]-1.0585[/C][C]0.147038[/C][/ROW]
[ROW][C]16[/C][C]-0.093717[/C][C]-0.7259[/C][C]0.235353[/C][/ROW]
[ROW][C]17[/C][C]0.038309[/C][C]0.2967[/C][C]0.383846[/C][/ROW]
[ROW][C]18[/C][C]0.16666[/C][C]1.2909[/C][C]0.100838[/C][/ROW]
[ROW][C]19[/C][C]-0.07131[/C][C]-0.5524[/C][C]0.291376[/C][/ROW]
[ROW][C]20[/C][C]-0.216374[/C][C]-1.676[/C][C]0.049468[/C][/ROW]
[ROW][C]21[/C][C]-0.09426[/C][C]-0.7301[/C][C]0.234075[/C][/ROW]
[ROW][C]22[/C][C]-0.070039[/C][C]-0.5425[/C][C]0.294734[/C][/ROW]
[ROW][C]23[/C][C]-0.1624[/C][C]-1.2579[/C][C]0.106643[/C][/ROW]
[ROW][C]24[/C][C]0.095159[/C][C]0.7371[/C][C]0.231968[/C][/ROW]
[ROW][C]25[/C][C]-0.021999[/C][C]-0.1704[/C][C]0.432632[/C][/ROW]
[ROW][C]26[/C][C]0.073799[/C][C]0.5716[/C][C]0.284849[/C][/ROW]
[ROW][C]27[/C][C]0.048719[/C][C]0.3774[/C][C]0.353614[/C][/ROW]
[ROW][C]28[/C][C]-0.184632[/C][C]-1.4302[/C][C]0.07893[/C][/ROW]
[ROW][C]29[/C][C]-0.035948[/C][C]-0.2785[/C][C]0.390811[/C][/ROW]
[ROW][C]30[/C][C]-0.080489[/C][C]-0.6235[/C][C]0.267672[/C][/ROW]
[ROW][C]31[/C][C]-0.009905[/C][C]-0.0767[/C][C]0.469548[/C][/ROW]
[ROW][C]32[/C][C]0.027743[/C][C]0.2149[/C][C]0.415288[/C][/ROW]
[ROW][C]33[/C][C]0.174161[/C][C]1.349[/C][C]0.091196[/C][/ROW]
[ROW][C]34[/C][C]-0.024677[/C][C]-0.1912[/C][C]0.424526[/C][/ROW]
[ROW][C]35[/C][C]-0.066831[/C][C]-0.5177[/C][C]0.303294[/C][/ROW]
[ROW][C]36[/C][C]0.025254[/C][C]0.1956[/C][C]0.422785[/C][/ROW]
[/TABLE]
Source: https://freestatistics.org/blog/index.php?pk=28305&T=2

Globally Unique Identifier (entire table): ba.freestatistics.org/blog/index.php?pk=28305&T=2

As an alternative you can also use a QR Code:  

The GUIDs for individual cells are displayed in the table below:

Partial Autocorrelation Function
Time lag kPACF(k)T-STATP-value
10.5606284.34262.8e-05
20.1935081.49890.069571
30.1998571.54810.06343
40.0241020.18670.426265
50.3108782.4080.009564
6-0.035676-0.27630.391617
70.0567910.43990.330793
8-0.254175-1.96880.026798
90.01920.14870.441135
100.0332710.25770.398754
110.1799141.39360.084288
120.1450841.12380.132783
13-0.060027-0.4650.321819
14-0.172253-1.33430.09358
15-0.13665-1.05850.147038
16-0.093717-0.72590.235353
170.0383090.29670.383846
180.166661.29090.100838
19-0.07131-0.55240.291376
20-0.216374-1.6760.049468
21-0.09426-0.73010.234075
22-0.070039-0.54250.294734
23-0.1624-1.25790.106643
240.0951590.73710.231968
25-0.021999-0.17040.432632
260.0737990.57160.284849
270.0487190.37740.353614
28-0.184632-1.43020.07893
29-0.035948-0.27850.390811
30-0.080489-0.62350.267672
31-0.009905-0.07670.469548
320.0277430.21490.415288
330.1741611.3490.091196
34-0.024677-0.19120.424526
35-0.066831-0.51770.303294
360.0252540.19560.422785


Parameters (Session):
par1 = 36 ; par2 = 1 ; par3 = 0 ; par4 = 0 ; par5 = 12 ;
Parameters (R input):
par1 = 36 ; par2 = 1 ; par3 = 0 ; par4 = 0 ; par5 = 12 ;
R code (references can be found in the software module):
if (par1 == 'Default') {
par1 = 10*log10(length(x))
} else {
par1 <- as.numeric(par1)
}
par2 <- as.numeric(par2)
par3 <- as.numeric(par3)
par4 <- as.numeric(par4)
par5 <- as.numeric(par5)
if (par2 == 0) {
x <- log(x)
} else {
x <- (x ^ par2 - 1) / par2
}
if (par3 > 0) x <- diff(x,lag=1,difference=par3)
if (par4 > 0) x <- diff(x,lag=par5,difference=par4)
bitmap(file='pic1.png')
racf <- acf(x,par1,main='Autocorrelation',xlab='lags',ylab='ACF')
dev.off()
bitmap(file='pic2.png')
rpacf <- pacf(x,par1,main='Partial Autocorrelation',xlab='lags',ylab='PACF')
dev.off()
(myacf <- c(racf$acf))
(mypacf <- c(rpacf$acf))
lengthx <- length(x)
sqrtn <- sqrt(lengthx)
load(file='createtable')
a<-table.start()
a<-table.row.start(a)
a<-table.element(a,'Autocorrelation Function',4,TRUE)
a<-table.row.end(a)
a<-table.row.start(a)
a<-table.element(a,'Time lag k',header=TRUE)
a<-table.element(a,hyperlink('basics.htm','ACF(k)','click here for more information about the Autocorrelation Function'),header=TRUE)
a<-table.element(a,'T-STAT',header=TRUE)
a<-table.element(a,'P-value',header=TRUE)
a<-table.row.end(a)
for (i in 2:(par1+1)) {
a<-table.row.start(a)
a<-table.element(a,i-1,header=TRUE)
a<-table.element(a,round(myacf[i],6))
mytstat <- myacf[i]*sqrtn
a<-table.element(a,round(mytstat,4))
a<-table.element(a,round(1-pt(abs(mytstat),lengthx),6))
a<-table.row.end(a)
}
a<-table.end(a)
table.save(a,file='mytable.tab')
a<-table.start()
a<-table.row.start(a)
a<-table.element(a,'Partial Autocorrelation Function',4,TRUE)
a<-table.row.end(a)
a<-table.row.start(a)
a<-table.element(a,'Time lag k',header=TRUE)
a<-table.element(a,hyperlink('basics.htm','PACF(k)','click here for more information about the Partial Autocorrelation Function'),header=TRUE)
a<-table.element(a,'T-STAT',header=TRUE)
a<-table.element(a,'P-value',header=TRUE)
a<-table.row.end(a)
for (i in 1:par1) {
a<-table.row.start(a)
a<-table.element(a,i,header=TRUE)
a<-table.element(a,round(mypacf[i],6))
mytstat <- mypacf[i]*sqrtn
a<-table.element(a,round(mytstat,4))
a<-table.element(a,round(1-pt(abs(mytstat),lengthx),6))
a<-table.row.end(a)
}
a<-table.end(a)
table.save(a,file='mytable1.tab')