Free Statistics

of Irreproducible Research!

Author's title

Author*The author of this computation has been verified*
R Software Modulerwasp_smp.wasp
Title produced by softwareStandard Deviation-Mean Plot
Date of computationTue, 02 Dec 2008 12:54:11 -0700
Cite this page as followsStatistical Computations at FreeStatistics.org, Office for Research Development and Education, URL https://freestatistics.org/blog/index.php?v=date/2008/Dec/02/t12282476967jq3nfh3ajs8fiu.htm/, Retrieved Sun, 19 May 2024 12:02:40 +0000
Statistical Computations at FreeStatistics.org, Office for Research Development and Education, URL https://freestatistics.org/blog/index.php?pk=28298, Retrieved Sun, 19 May 2024 12:02:40 +0000
QR Codes:

Original text written by user:
IsPrivate?No (this computation is public)
User-defined keywords
Estimated Impact179
Family? (F = Feedback message, R = changed R code, M = changed R Module, P = changed Parameters, D = changed Data)
-     [Standard Deviation-Mean Plot] [nsts Q8] [2008-12-02 19:40:41] [3a9fc6d5b5e0e816787b7dbace57e7cd]
F RMPD  [(Partial) Autocorrelation Function] [nsts Q8] [2008-12-02 19:45:13] [3a9fc6d5b5e0e816787b7dbace57e7cd]
F RMPD      [Standard Deviation-Mean Plot] [nsts Q8] [2008-12-02 19:54:11] [821c4b3d195be8e737cf8c9dc649d3cf] [Current]
F RMPD        [(Partial) Autocorrelation Function] [nsts Q8] [2008-12-02 19:58:11] [3a9fc6d5b5e0e816787b7dbace57e7cd]
F   P           [(Partial) Autocorrelation Function] [nsts Q8] [2008-12-02 20:02:32] [3a9fc6d5b5e0e816787b7dbace57e7cd]
Feedback Forum
2008-12-09 23:33:34 [Gert-Jan Geudens] [reply
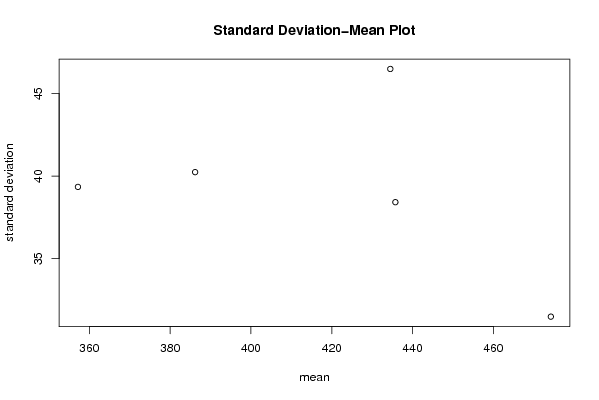
Ook hier is de transformatie nutteloos door te hoge p-waarde. Dit hebben we reeds uitgelegd in vorige feedbacks.

Post a new message
Dataseries X:
377,2
332,2
364,8
352,4
341,6
298,2
355,3
330,9
314,5
418,9
433,2
367
422,9
352,1
419,8
432,7
414,2
387,7
297,2
357,4
384,2
425,2
385,3
355,4
409,8
421,2
421,8
464,2
494
404,2
411,4
403,4
403,3
520,9
439,8
434,8
476,5
454,3
522
498,4
439,9
450,7
447,1
451,3
466,8
498
533,6
451,9
477,1
410,4
469,5
485,4
406,7
439,7
412,2
440,2
411,1
477,7
463,2
320,5


Summary of computational transaction
Raw Inputview raw input (R code)
Raw Outputview raw output of R engine
Computing time2 seconds
R Server'George Udny Yule' @ 72.249.76.132

\begin{tabular}{lllllllll}
\hline
Summary of computational transaction \tabularnewline
Raw Input & view raw input (R code)  \tabularnewline
Raw Output & view raw output of R engine  \tabularnewline
Computing time & 2 seconds \tabularnewline
R Server & 'George Udny Yule' @ 72.249.76.132 \tabularnewline
\hline
\end{tabular}
%Source: https://freestatistics.org/blog/index.php?pk=28298&T=0

[TABLE]
[ROW][C]Summary of computational transaction[/C][/ROW]
[ROW][C]Raw Input[/C][C]view raw input (R code) [/C][/ROW]
[ROW][C]Raw Output[/C][C]view raw output of R engine [/C][/ROW]
[ROW][C]Computing time[/C][C]2 seconds[/C][/ROW]
[ROW][C]R Server[/C][C]'George Udny Yule' @ 72.249.76.132[/C][/ROW]
[/TABLE]
Source: https://freestatistics.org/blog/index.php?pk=28298&T=0

Globally Unique Identifier (entire table): ba.freestatistics.org/blog/index.php?pk=28298&T=0

As an alternative you can also use a QR Code:  

The GUIDs for individual cells are displayed in the table below:

Summary of computational transaction
Raw Inputview raw input (R code)
Raw Outputview raw output of R engine
Computing time2 seconds
R Server'George Udny Yule' @ 72.249.76.132


Standard Deviation-Mean Plot
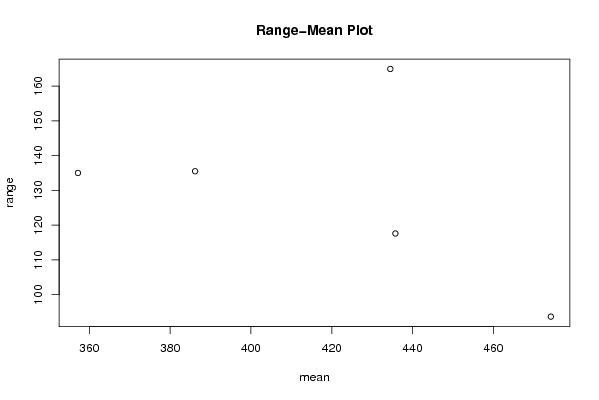
SectionMeanStandard DeviationRange
1357.18333333333339.3442575995609135
2386.17540.2402359698485135.5
3435.73333333333338.4209302176285117.6
4474.20833333333331.487644281912393.7
5434.47546.4900013688183164.9

\begin{tabular}{lllllllll}
\hline
Standard Deviation-Mean Plot \tabularnewline
Section & Mean & Standard Deviation & Range \tabularnewline
1 & 357.183333333333 & 39.3442575995609 & 135 \tabularnewline
2 & 386.175 & 40.2402359698485 & 135.5 \tabularnewline
3 & 435.733333333333 & 38.4209302176285 & 117.6 \tabularnewline
4 & 474.208333333333 & 31.4876442819123 & 93.7 \tabularnewline
5 & 434.475 & 46.4900013688183 & 164.9 \tabularnewline
\hline
\end{tabular}
%Source: https://freestatistics.org/blog/index.php?pk=28298&T=1

[TABLE]
[ROW][C]Standard Deviation-Mean Plot[/C][/ROW]
[ROW][C]Section[/C][C]Mean[/C][C]Standard Deviation[/C][C]Range[/C][/ROW]
[ROW][C]1[/C][C]357.183333333333[/C][C]39.3442575995609[/C][C]135[/C][/ROW]
[ROW][C]2[/C][C]386.175[/C][C]40.2402359698485[/C][C]135.5[/C][/ROW]
[ROW][C]3[/C][C]435.733333333333[/C][C]38.4209302176285[/C][C]117.6[/C][/ROW]
[ROW][C]4[/C][C]474.208333333333[/C][C]31.4876442819123[/C][C]93.7[/C][/ROW]
[ROW][C]5[/C][C]434.475[/C][C]46.4900013688183[/C][C]164.9[/C][/ROW]
[/TABLE]
Source: https://freestatistics.org/blog/index.php?pk=28298&T=1

Globally Unique Identifier (entire table): ba.freestatistics.org/blog/index.php?pk=28298&T=1

As an alternative you can also use a QR Code:  

The GUIDs for individual cells are displayed in the table below:

Standard Deviation-Mean Plot
SectionMeanStandard DeviationRange
1357.18333333333339.3442575995609135
2386.17540.2402359698485135.5
3435.73333333333338.4209302176285117.6
4474.20833333333331.487644281912393.7
5434.47546.4900013688183164.9


Regression: S.E.(k) = alpha + beta * Mean(k)
alpha57.4230311512667
beta-0.0436503389103543
S.D.0.0622256353449639
T-STAT-0.701484824837341
p-value0.533520956466064

\begin{tabular}{lllllllll}
\hline
Regression: S.E.(k) = alpha + beta * Mean(k) \tabularnewline
alpha & 57.4230311512667 \tabularnewline
beta & -0.0436503389103543 \tabularnewline
S.D. & 0.0622256353449639 \tabularnewline
T-STAT & -0.701484824837341 \tabularnewline
p-value & 0.533520956466064 \tabularnewline
\hline
\end{tabular}
%Source: https://freestatistics.org/blog/index.php?pk=28298&T=2

[TABLE]
[ROW][C]Regression: S.E.(k) = alpha + beta * Mean(k)[/C][/ROW]
[ROW][C]alpha[/C][C]57.4230311512667[/C][/ROW]
[ROW][C]beta[/C][C]-0.0436503389103543[/C][/ROW]
[ROW][C]S.D.[/C][C]0.0622256353449639[/C][/ROW]
[ROW][C]T-STAT[/C][C]-0.701484824837341[/C][/ROW]
[ROW][C]p-value[/C][C]0.533520956466064[/C][/ROW]
[/TABLE]
Source: https://freestatistics.org/blog/index.php?pk=28298&T=2

Globally Unique Identifier (entire table): ba.freestatistics.org/blog/index.php?pk=28298&T=2

As an alternative you can also use a QR Code:  

The GUIDs for individual cells are displayed in the table below:

Regression: S.E.(k) = alpha + beta * Mean(k)
alpha57.4230311512667
beta-0.0436503389103543
S.D.0.0622256353449639
T-STAT-0.701484824837341
p-value0.533520956466064


Regression: ln S.E.(k) = alpha + beta * ln Mean(k)
alpha6.65033654228162
beta-0.495799058555857
S.D.0.661693378594782
T-STAT-0.749288227137424
p-value0.508085733141113
Lambda1.49579905855586

\begin{tabular}{lllllllll}
\hline
Regression: ln S.E.(k) = alpha + beta * ln Mean(k) \tabularnewline
alpha & 6.65033654228162 \tabularnewline
beta & -0.495799058555857 \tabularnewline
S.D. & 0.661693378594782 \tabularnewline
T-STAT & -0.749288227137424 \tabularnewline
p-value & 0.508085733141113 \tabularnewline
Lambda & 1.49579905855586 \tabularnewline
\hline
\end{tabular}
%Source: https://freestatistics.org/blog/index.php?pk=28298&T=3

[TABLE]
[ROW][C]Regression: ln S.E.(k) = alpha + beta * ln Mean(k)[/C][/ROW]
[ROW][C]alpha[/C][C]6.65033654228162[/C][/ROW]
[ROW][C]beta[/C][C]-0.495799058555857[/C][/ROW]
[ROW][C]S.D.[/C][C]0.661693378594782[/C][/ROW]
[ROW][C]T-STAT[/C][C]-0.749288227137424[/C][/ROW]
[ROW][C]p-value[/C][C]0.508085733141113[/C][/ROW]
[ROW][C]Lambda[/C][C]1.49579905855586[/C][/ROW]
[/TABLE]
Source: https://freestatistics.org/blog/index.php?pk=28298&T=3

Globally Unique Identifier (entire table): ba.freestatistics.org/blog/index.php?pk=28298&T=3

As an alternative you can also use a QR Code:  

The GUIDs for individual cells are displayed in the table below:

Regression: ln S.E.(k) = alpha + beta * ln Mean(k)
alpha6.65033654228162
beta-0.495799058555857
S.D.0.661693378594782
T-STAT-0.749288227137424
p-value0.508085733141113
Lambda1.49579905855586


Parameters (Session):
par1 = 12 ;
Parameters (R input):
par1 = 12 ;
R code (references can be found in the software module):
par1 <- as.numeric(par1)
(n <- length(x))
(np <- floor(n / par1))
arr <- array(NA,dim=c(par1,np))
j <- 0
k <- 1
for (i in 1:(np*par1))
{
j = j + 1
arr[j,k] <- x[i]
if (j == par1) {
j = 0
k=k+1
}
}
arr
arr.mean <- array(NA,dim=np)
arr.sd <- array(NA,dim=np)
arr.range <- array(NA,dim=np)
for (j in 1:np)
{
arr.mean[j] <- mean(arr[,j],na.rm=TRUE)
arr.sd[j] <- sd(arr[,j],na.rm=TRUE)
arr.range[j] <- max(arr[,j],na.rm=TRUE) - min(arr[,j],na.rm=TRUE)
}
arr.mean
arr.sd
arr.range
(lm1 <- lm(arr.sd~arr.mean))
(lnlm1 <- lm(log(arr.sd)~log(arr.mean)))
(lm2 <- lm(arr.range~arr.mean))
bitmap(file='test1.png')
plot(arr.mean,arr.sd,main='Standard Deviation-Mean Plot',xlab='mean',ylab='standard deviation')
dev.off()
bitmap(file='test2.png')
plot(arr.mean,arr.range,main='Range-Mean Plot',xlab='mean',ylab='range')
dev.off()
load(file='createtable')
a<-table.start()
a<-table.row.start(a)
a<-table.element(a,'Standard Deviation-Mean Plot',4,TRUE)
a<-table.row.end(a)
a<-table.row.start(a)
a<-table.element(a,'Section',header=TRUE)
a<-table.element(a,'Mean',header=TRUE)
a<-table.element(a,'Standard Deviation',header=TRUE)
a<-table.element(a,'Range',header=TRUE)
a<-table.row.end(a)
for (j in 1:np) {
a<-table.row.start(a)
a<-table.element(a,j,header=TRUE)
a<-table.element(a,arr.mean[j])
a<-table.element(a,arr.sd[j] )
a<-table.element(a,arr.range[j] )
a<-table.row.end(a)
}
a<-table.end(a)
table.save(a,file='mytable.tab')
a<-table.start()
a<-table.row.start(a)
a<-table.element(a,'Regression: S.E.(k) = alpha + beta * Mean(k)',2,TRUE)
a<-table.row.end(a)
a<-table.row.start(a)
a<-table.element(a,'alpha',header=TRUE)
a<-table.element(a,lm1$coefficients[[1]])
a<-table.row.end(a)
a<-table.row.start(a)
a<-table.element(a,'beta',header=TRUE)
a<-table.element(a,lm1$coefficients[[2]])
a<-table.row.end(a)
a<-table.row.start(a)
a<-table.element(a,'S.D.',header=TRUE)
a<-table.element(a,summary(lm1)$coefficients[2,2])
a<-table.row.end(a)
a<-table.row.start(a)
a<-table.element(a,'T-STAT',header=TRUE)
a<-table.element(a,summary(lm1)$coefficients[2,3])
a<-table.row.end(a)
a<-table.row.start(a)
a<-table.element(a,'p-value',header=TRUE)
a<-table.element(a,summary(lm1)$coefficients[2,4])
a<-table.row.end(a)
a<-table.end(a)
table.save(a,file='mytable1.tab')
a<-table.start()
a<-table.row.start(a)
a<-table.element(a,'Regression: ln S.E.(k) = alpha + beta * ln Mean(k)',2,TRUE)
a<-table.row.end(a)
a<-table.row.start(a)
a<-table.element(a,'alpha',header=TRUE)
a<-table.element(a,lnlm1$coefficients[[1]])
a<-table.row.end(a)
a<-table.row.start(a)
a<-table.element(a,'beta',header=TRUE)
a<-table.element(a,lnlm1$coefficients[[2]])
a<-table.row.end(a)
a<-table.row.start(a)
a<-table.element(a,'S.D.',header=TRUE)
a<-table.element(a,summary(lnlm1)$coefficients[2,2])
a<-table.row.end(a)
a<-table.row.start(a)
a<-table.element(a,'T-STAT',header=TRUE)
a<-table.element(a,summary(lnlm1)$coefficients[2,3])
a<-table.row.end(a)
a<-table.row.start(a)
a<-table.element(a,'p-value',header=TRUE)
a<-table.element(a,summary(lnlm1)$coefficients[2,4])
a<-table.row.end(a)
a<-table.row.start(a)
a<-table.element(a,'Lambda',header=TRUE)
a<-table.element(a,1-lnlm1$coefficients[[2]])
a<-table.row.end(a)
a<-table.end(a)
table.save(a,file='mytable2.tab')